Chapter 8. Lidar and the National Map Viewer
The previous chapter introduced searching for and locating Lidar data on the internet, providing examples of local, state, and international websites and a brief introduction to the National Map Viewer. This chapter provides detailed instructions on using the National Map Viewer to locate and download lidar data.
Go to the National Map viewer download page at https://apps.nationalmap.gov/downloader/(Figure 8.1).
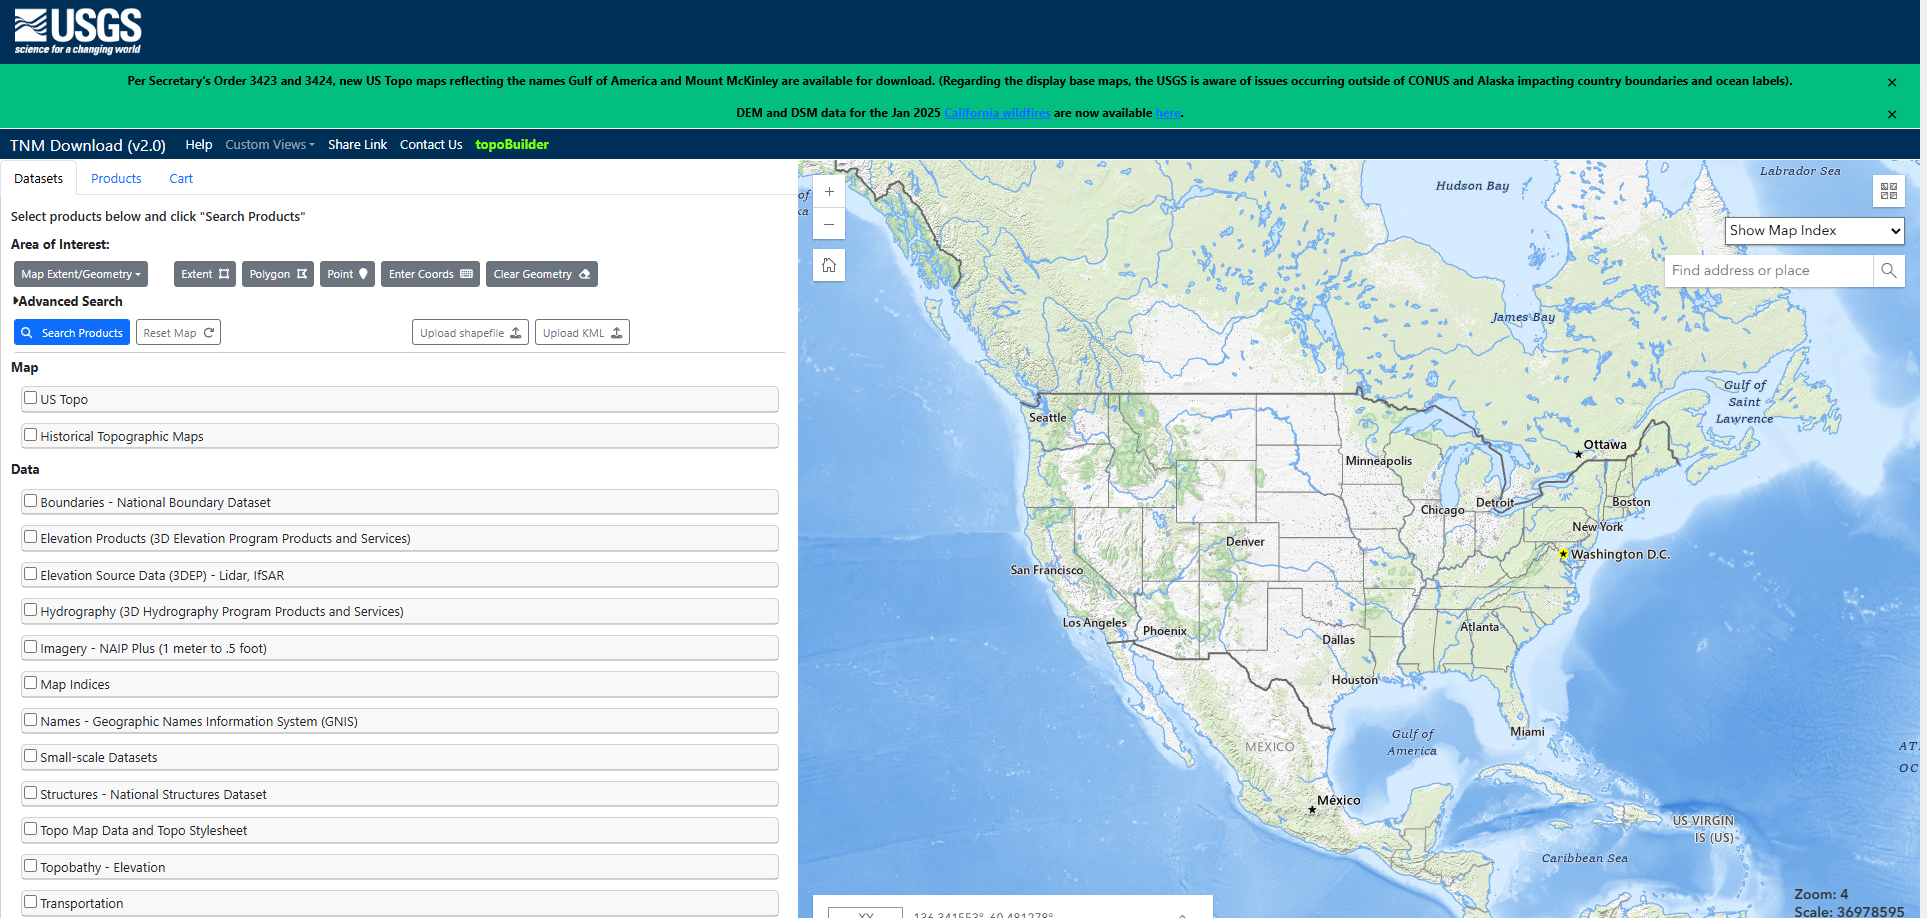
Searching for data on the National Map requires patience. The interactive nature of the map viewer is affected by internet speed AND server performance—often a product of the number of people using and displaying data at a given time.
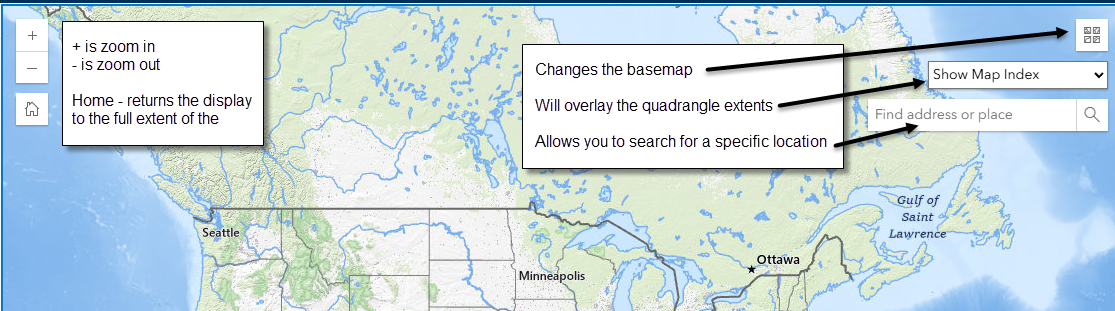
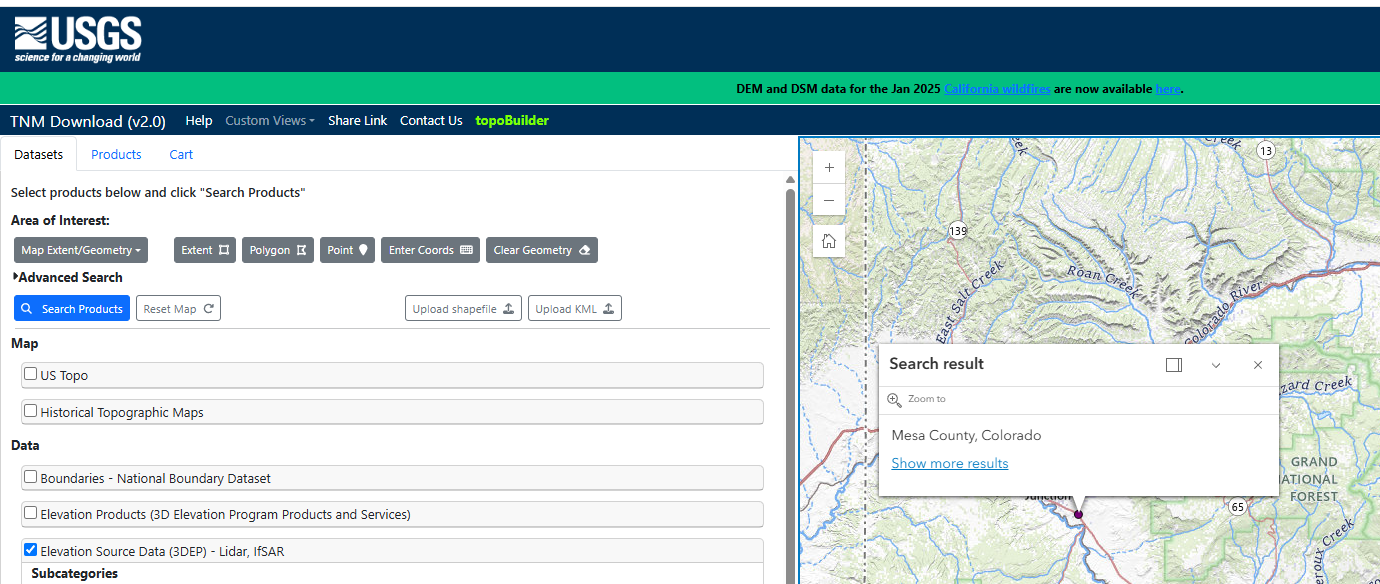
First, let’s review the USGS National Map website. On the right is the map viewer and some search tools. We will review the search options in detail, but first a couple of important tools are explained in Figure 8.2.
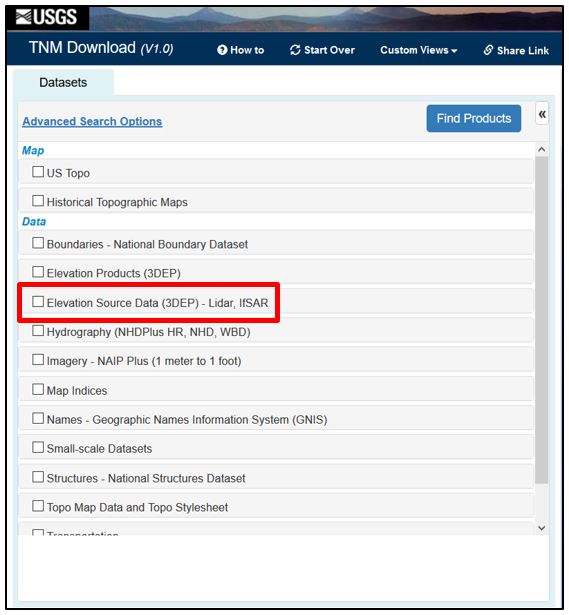
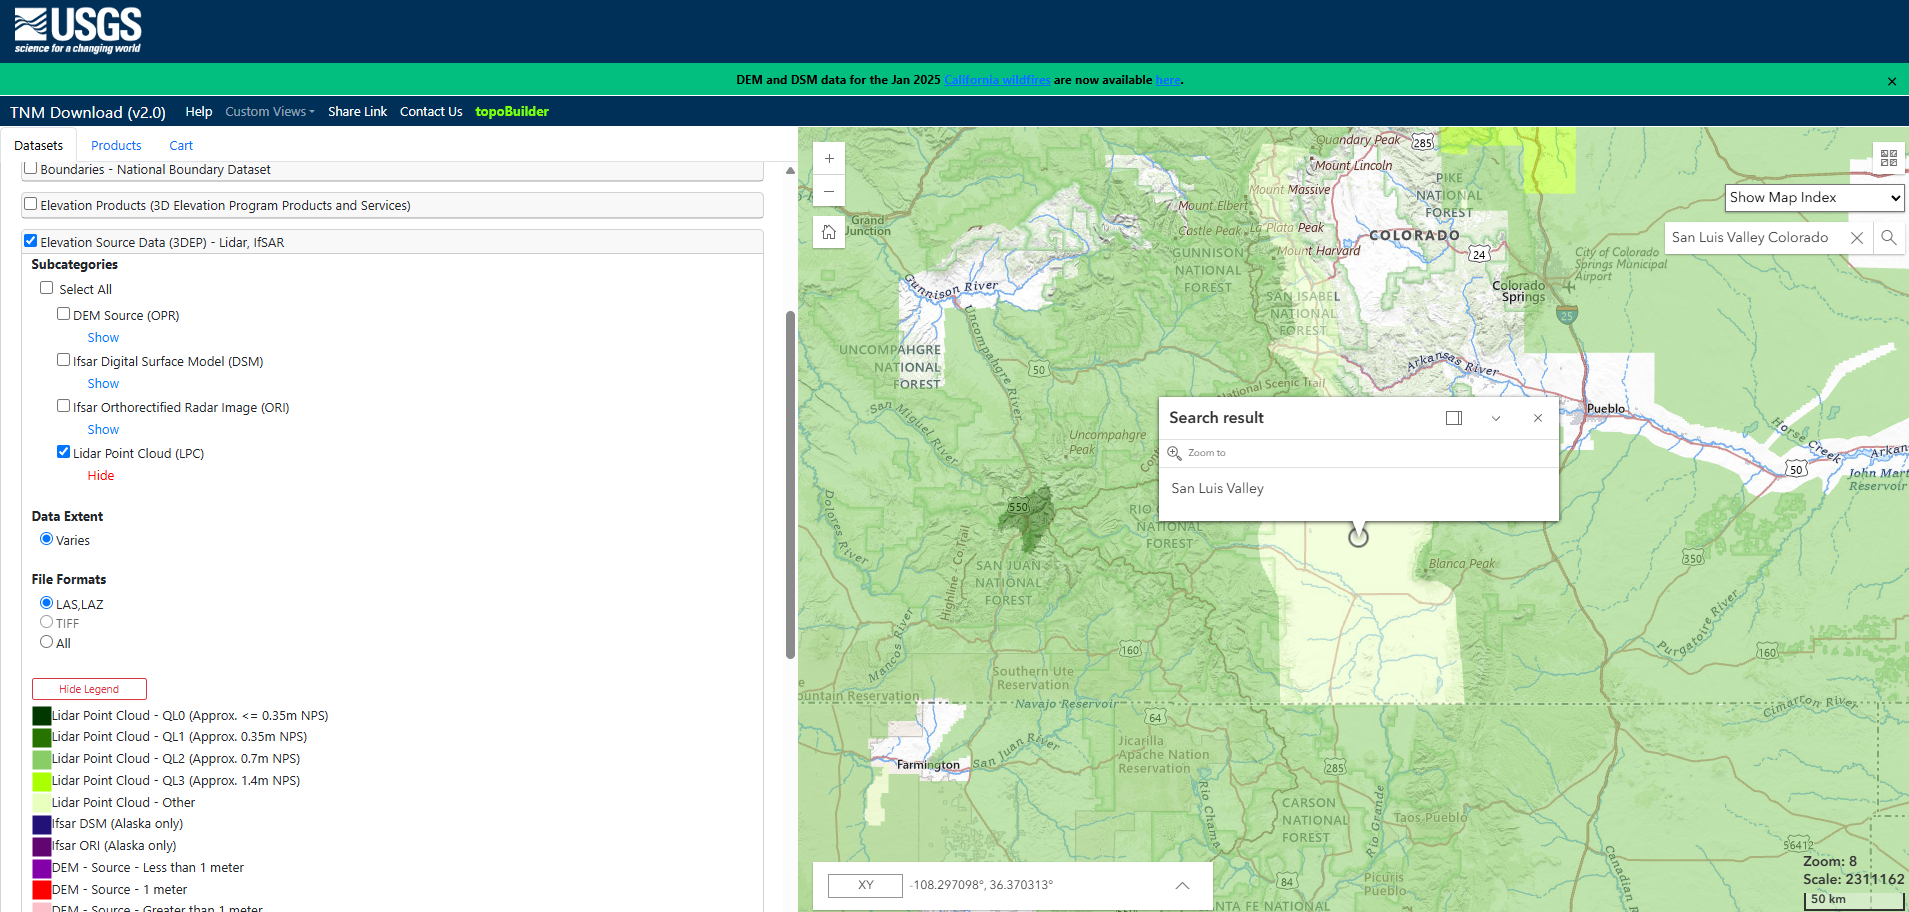
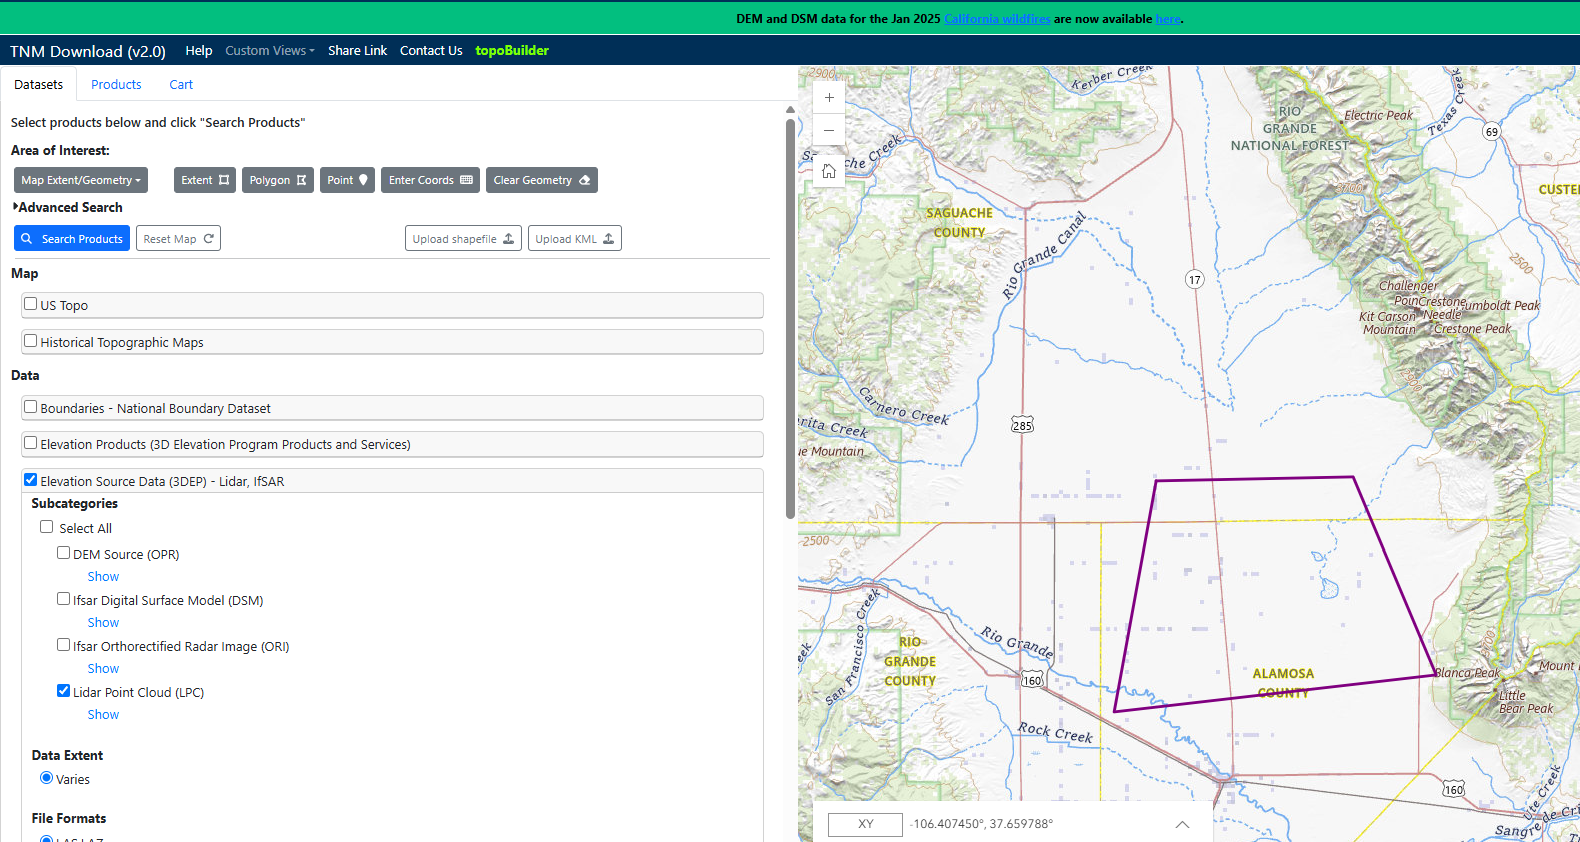
On the left side of The National Map Viewer website is the listing of products that are available through the National Map Viewer (Figure 8.3). For lidar data, check the Elevation Source Data (3DEP) – Lidar, ifSAR checkbox (red rectangle in Figure 8.3).
When checked, the information under the 3DEP product expands. DEM, ifSAR, and Lidar Point Cloud data are available. Check the Lidar Point Cloud(LPC) checkbox (Figure 8.4).
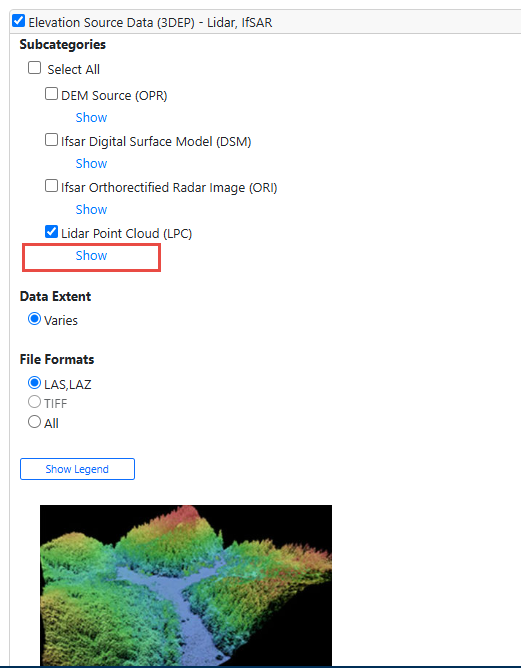
And under Lidar Point Cloud (LPC) click Show to reveal the coverage area for Lidar Point Cloud (LPC) data in the map viewer (Figure 8.5).
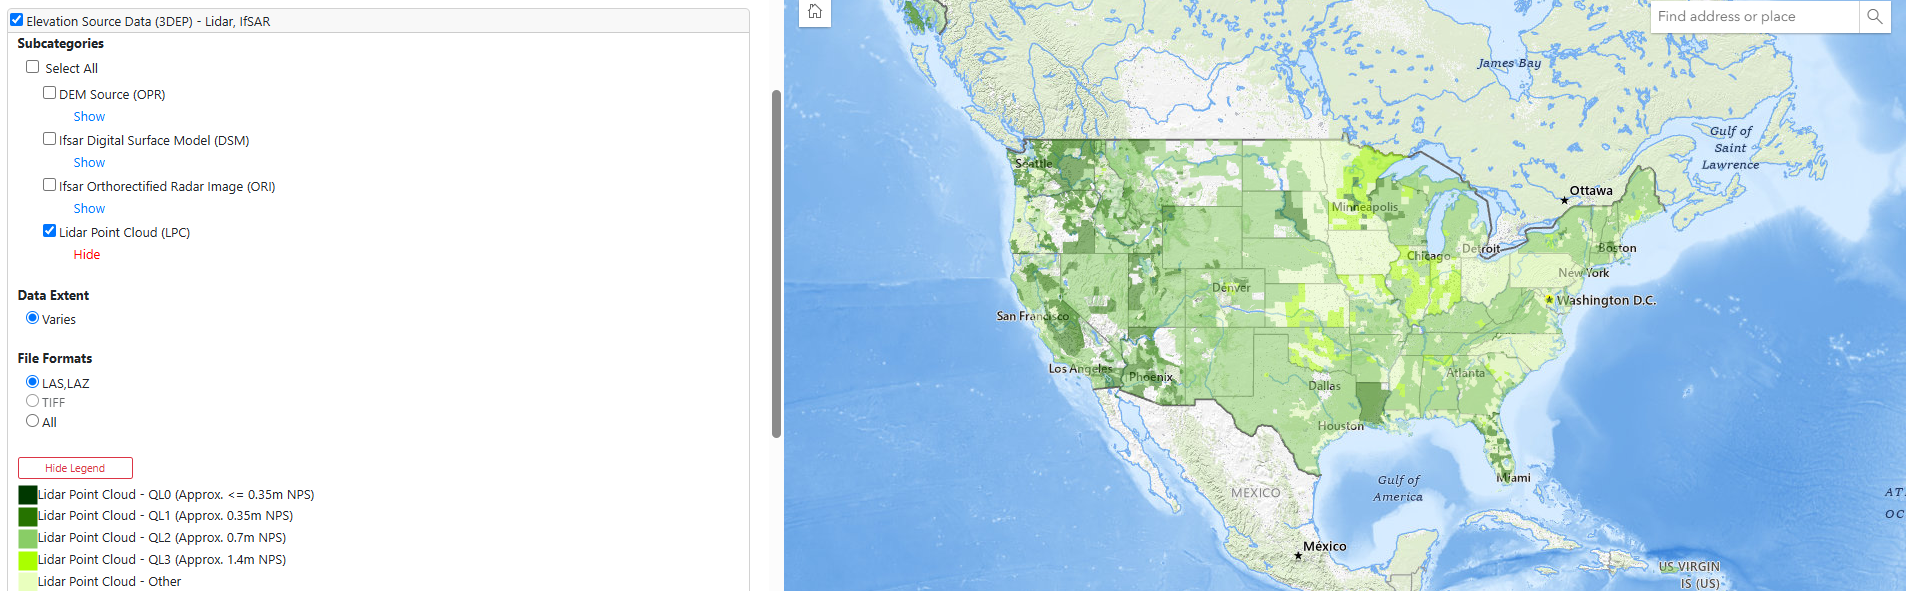
If necessary, use the scroll bar in the Product Search Filter pane to see the Availability Legend. The legend provides color-coded information in the map viewer on which products are available. We want LPC (Lidar Point Cloud) products, the first five shown in the legend.
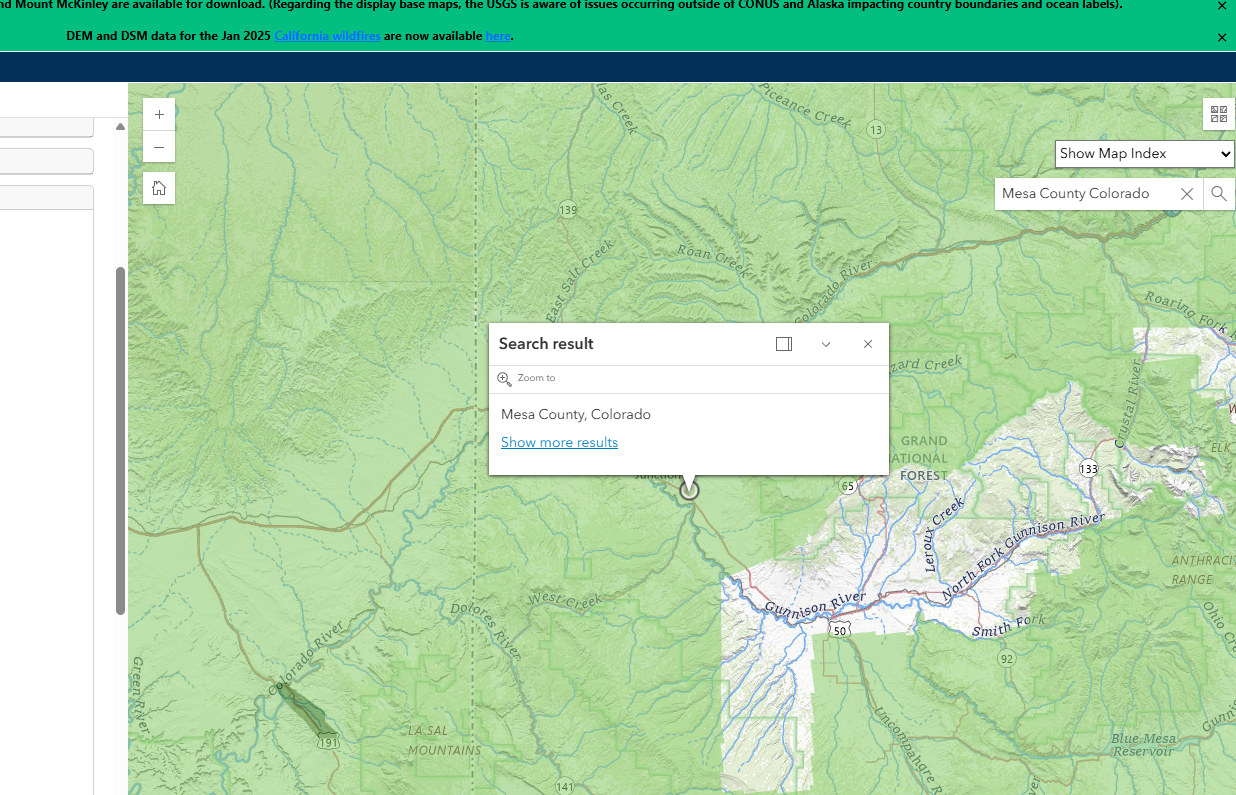
Search for lidar data for Mesa County Colorado.
A search can be accomplished in multiple ways. Let’s start with a location by entering “Mesa County, Colorado” in the search bar of the map viewer. The map viewer zooms to the location (Figure 8.6).
Next, define the area of interest using the Polygon drawing tool, the Point tool, or Enter Coordinates. For this example, we will use a point to define our area of interest. Select the point tool then click the location of interest in the map viewer (Figure 8.7).
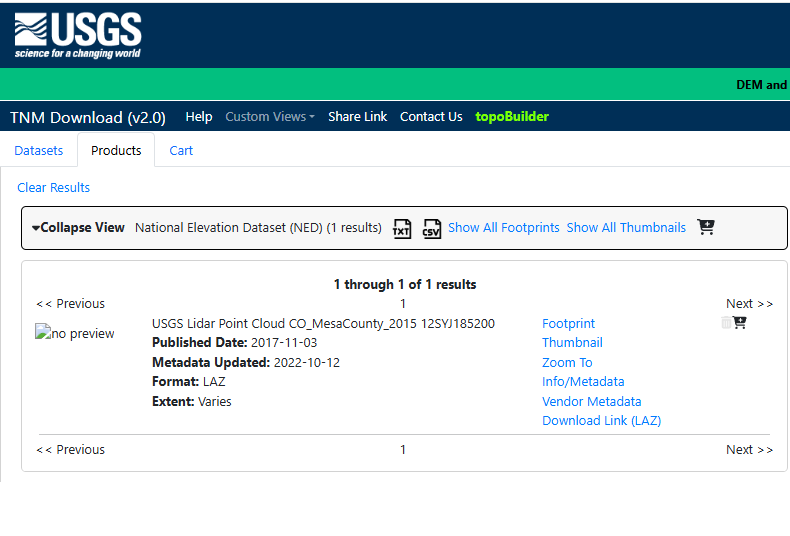
Select Search Products. The results should automatically display. There is only one result—the tile corresponding to the point in the map viewer (Figure 8.8).
Try another search on your own. Instead of going directly to Mesa County using an address, you could zoom to Mesa County and use Map Extent/Geometry for the area of interest. We will not provide detailed instructions here, but be careful, searches on a large extent can return thousands of results (See Figure 8.9). It is best to limit your area of interest.
Now, let’s take a closer look at the products available in a different area of interest.
If you don’t know where a particular location is, either by zooming in or using coordinates, search by address or place is the best option.
Follow along with the steps.
Use the search bar in the map viewer to locate San Luis Valley, Colorado (Figure 8.10).
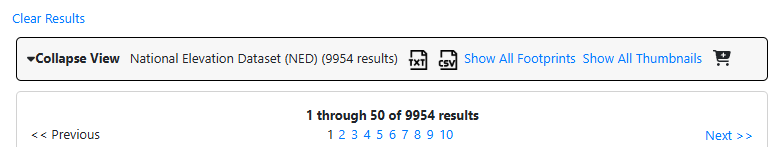
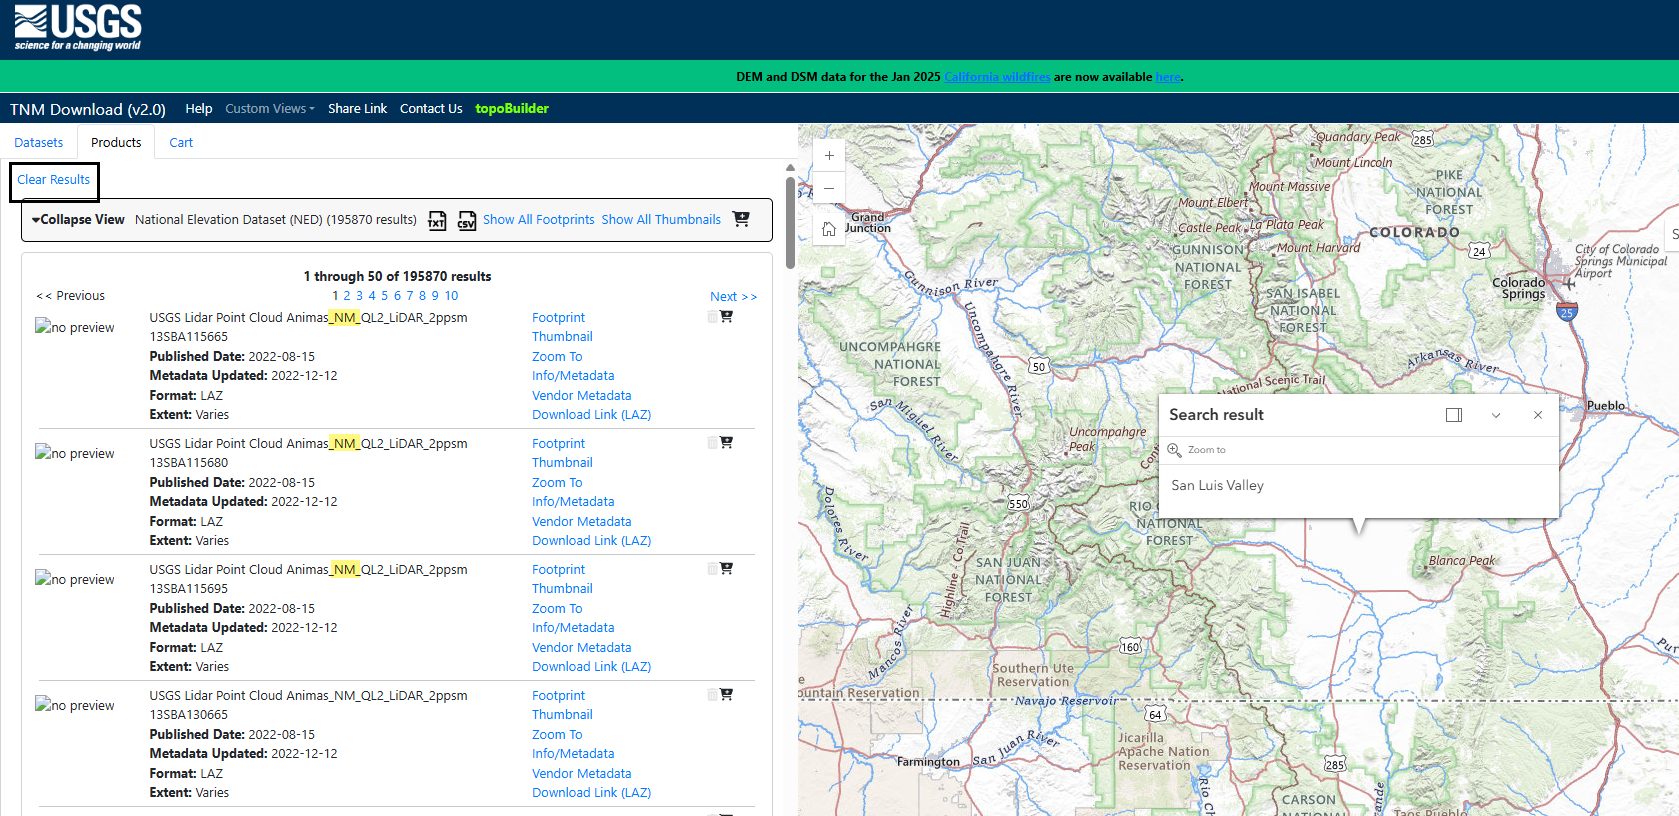
Now choose Search Products. An enormous number of datasets is returned because the search is using the extent of the viewer to locate datasets (the default if a different method is not chosen) (Figure 8.18). Notice in Figure 8.18, the yellow highlighting indicates data from New Mexico (NM).
Don’t worry if the results look just a bit different, your search area will not likely be the same as shown in Figure 8.11.
Let’s narrow the search. Begin by clearing these results. At the top of the Products page select Clear Results.
Go back to the Datasets tab and zoom in to (or search for) Alamosa County, Colorado in the map viewer. Select the Polygon tool (Figure 8.12)
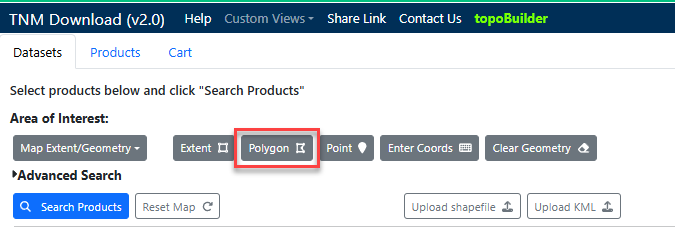
Click in the map viewer to place vertices of a polygon; double-click the last vertex to close the polygon (Figure 8.13).
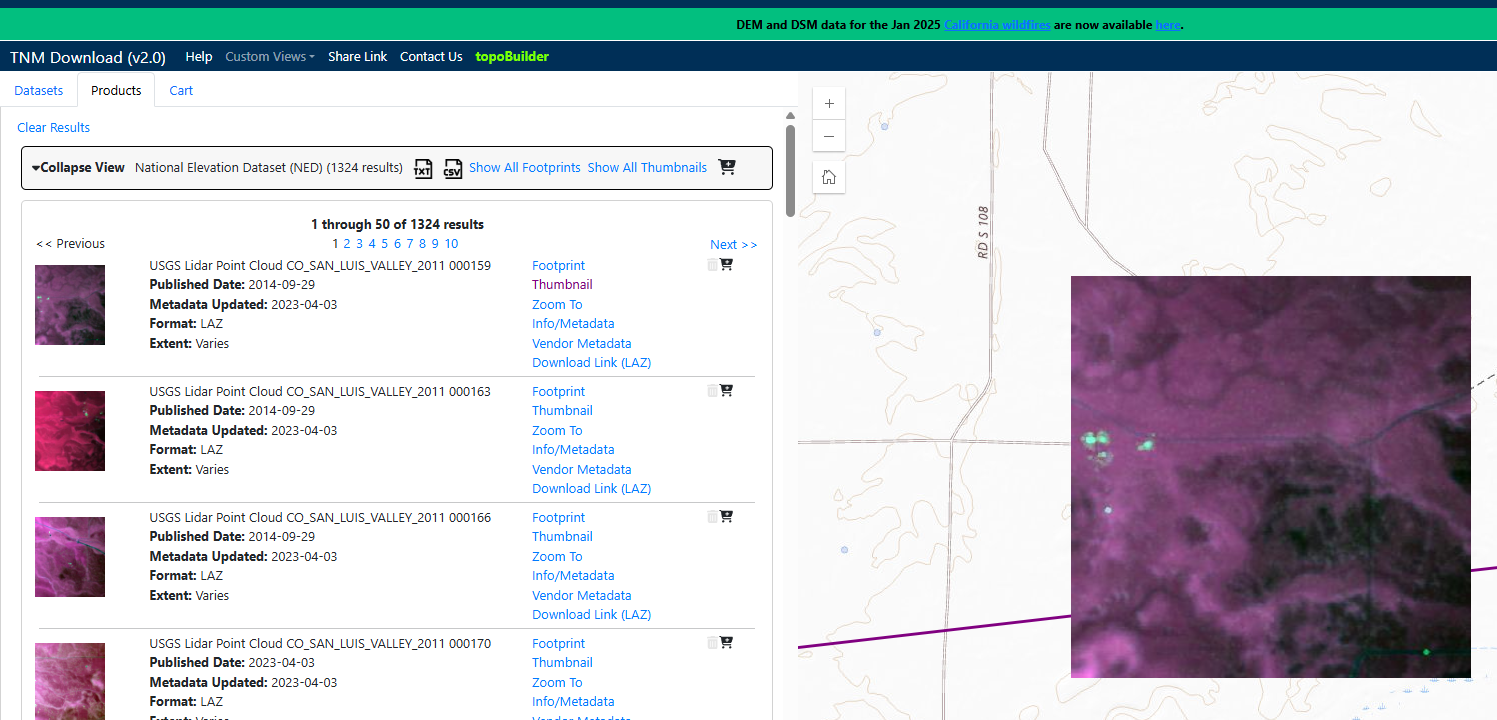
Now Search Products. The search returns multiple datasets that are limited to the extent of the polygon (Figure 8.14).

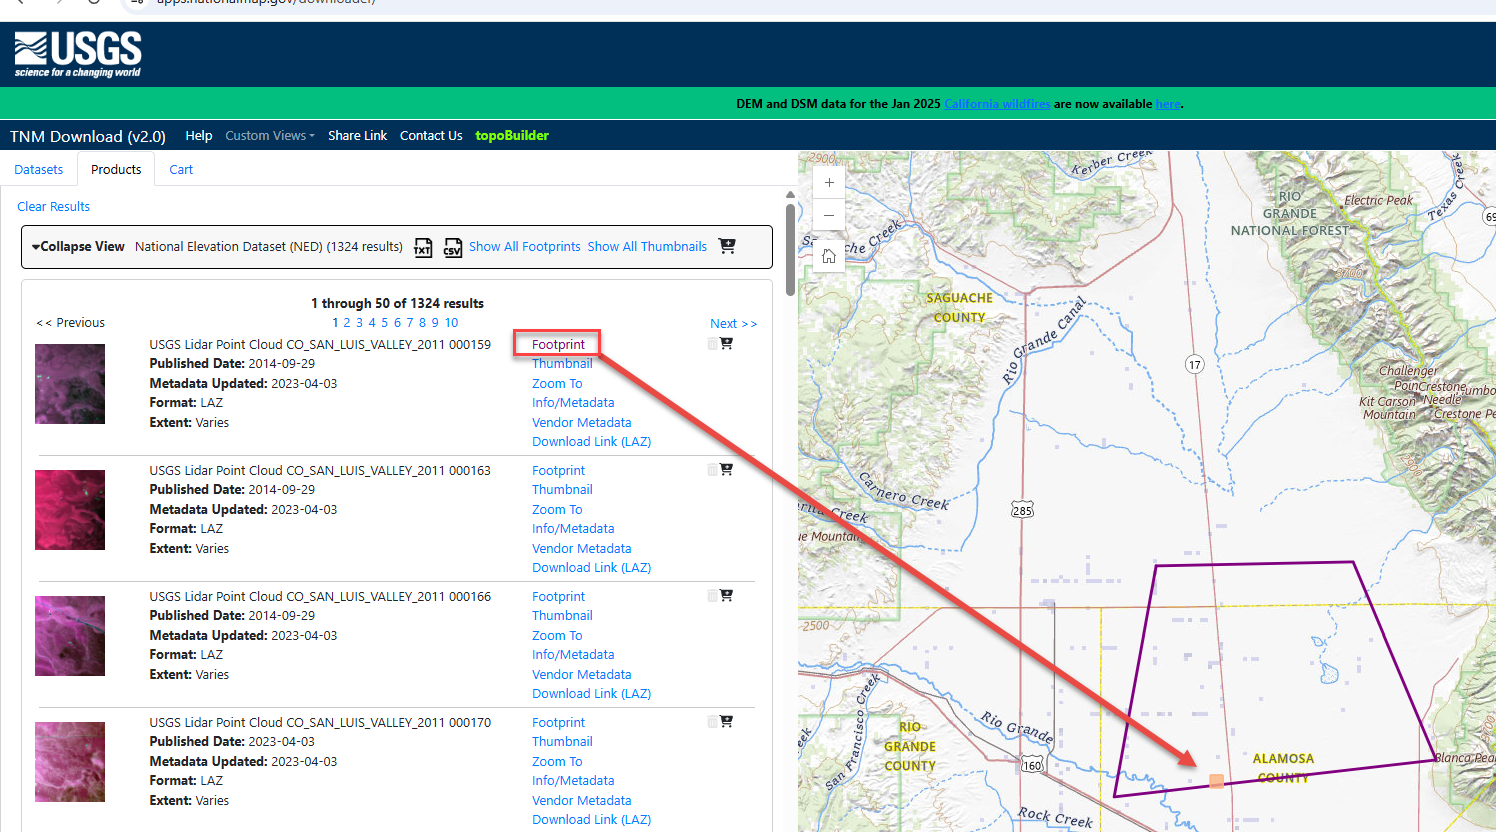
Let’s examine the first product in the list.
Click Footprint (Figure 8.15). See the little orange box in the southern part of the search area? That is the location of this individual tile.
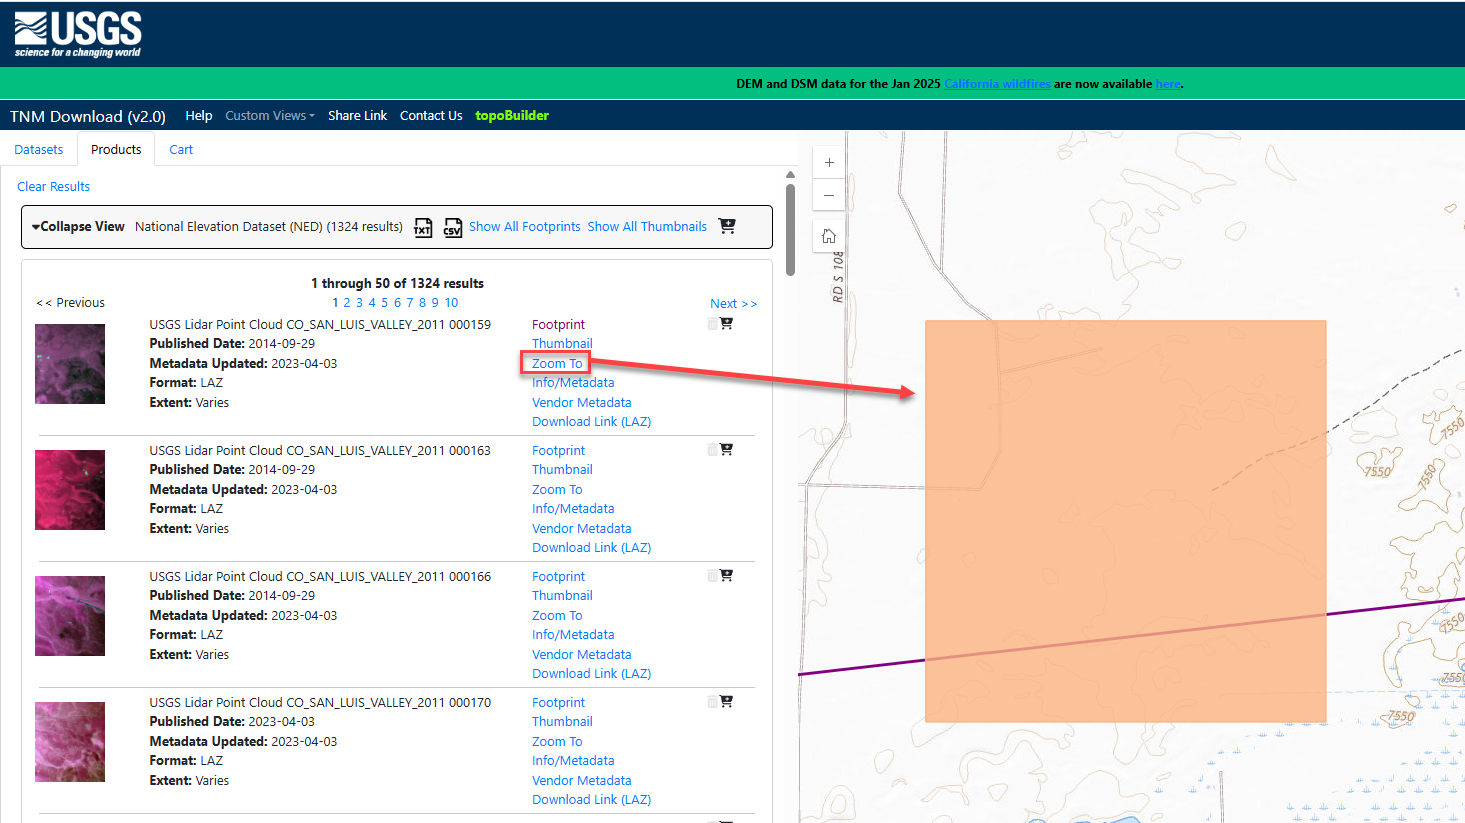
Below Footprint select Zoom To to zoom in to the footprint location (Figure 8.16).
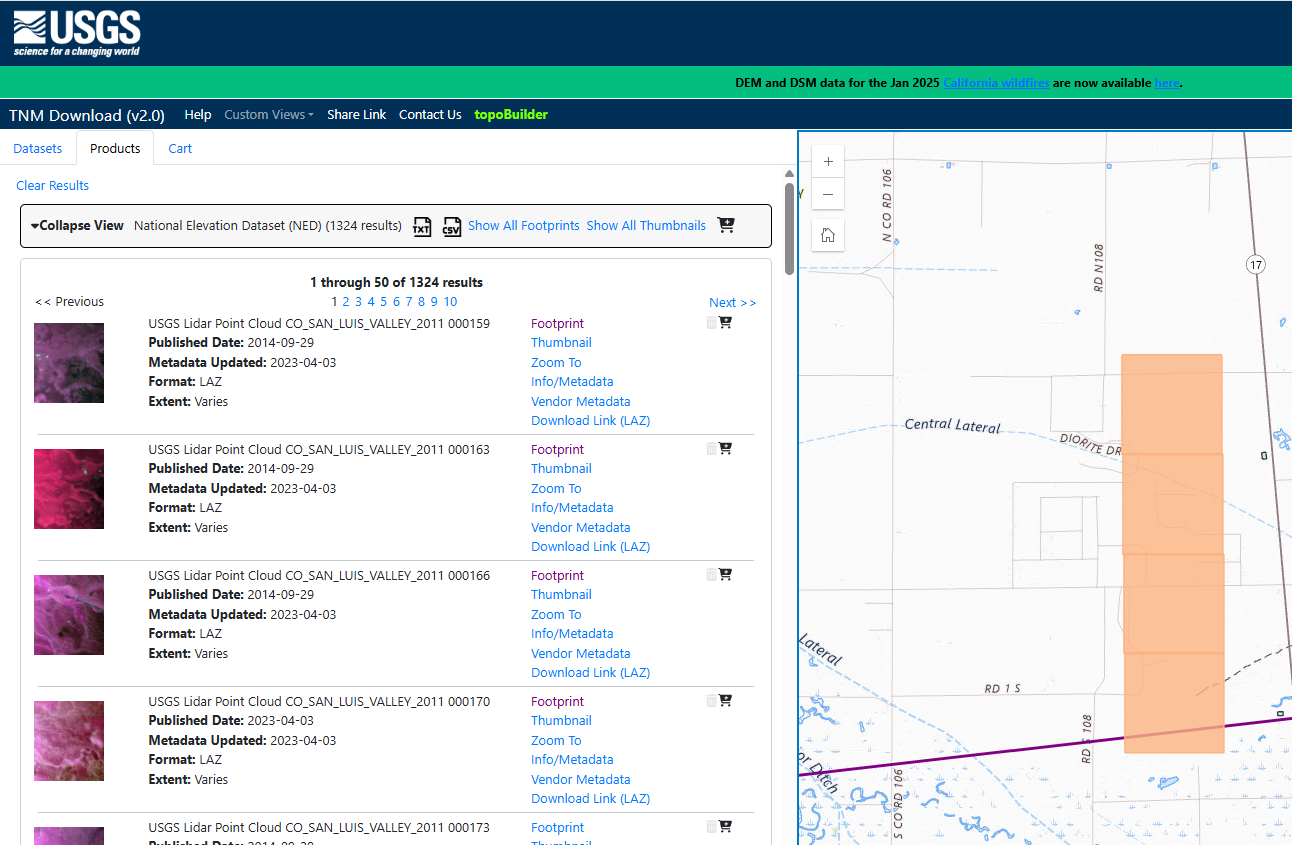
Use the zoom buttons to zoom back out. Multiple tile locations can be displayed by clicking on the Footprint for each tile (Figure 8.17).
Now deselect the footprints by clicking on Footprint again for each dataset. Thumbnail (right below Footprint) shows the same thing but with a JPEG image of the lidar point cloud located over the coverage area (Figure 8.18). Zoom To zooms in to display the extent of the point cloud.
Next select Info/Metadata (Figure 8.19).
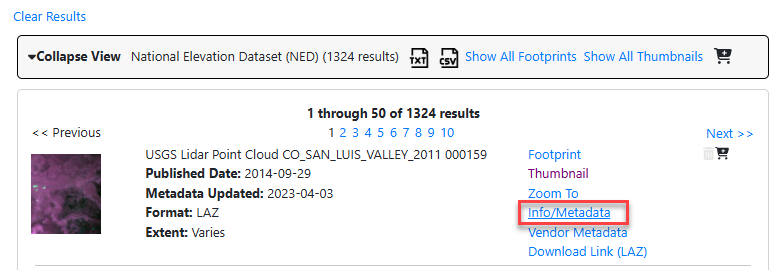
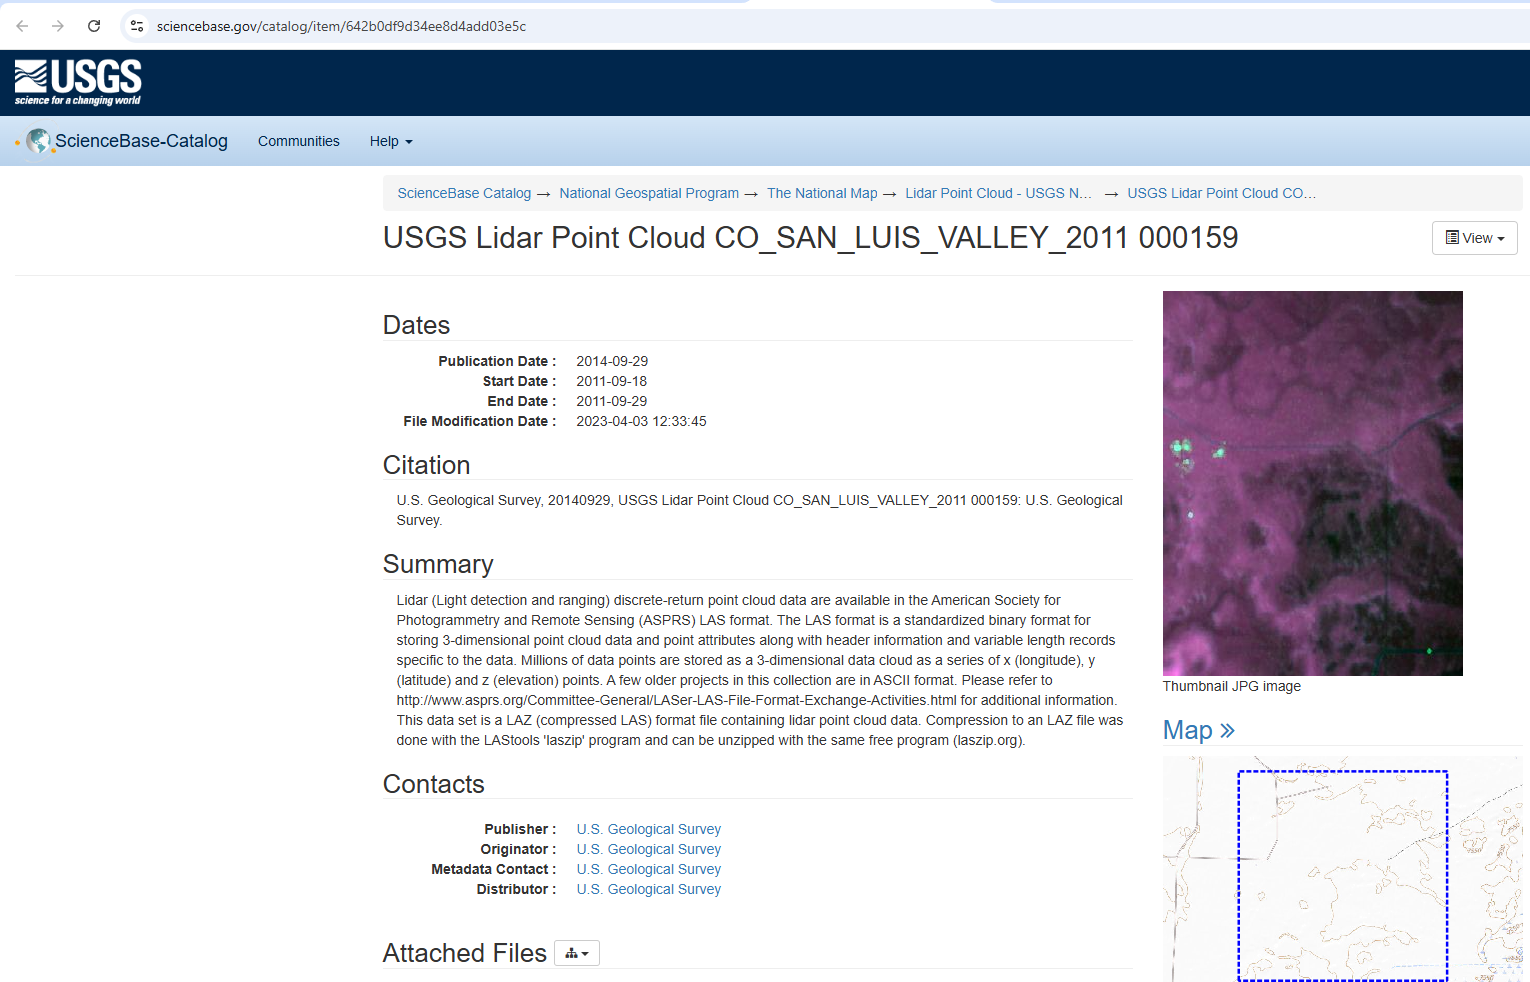
This takes you to the USGS web page with detailed information and metadata for the dataset (Figure 8.20).
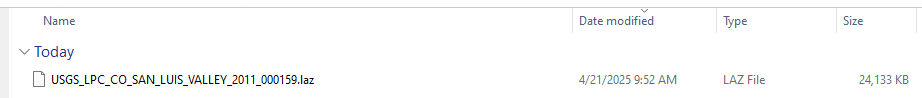
Next click on Download Link (LAZ) for one of the tiles (Figure 8.21).
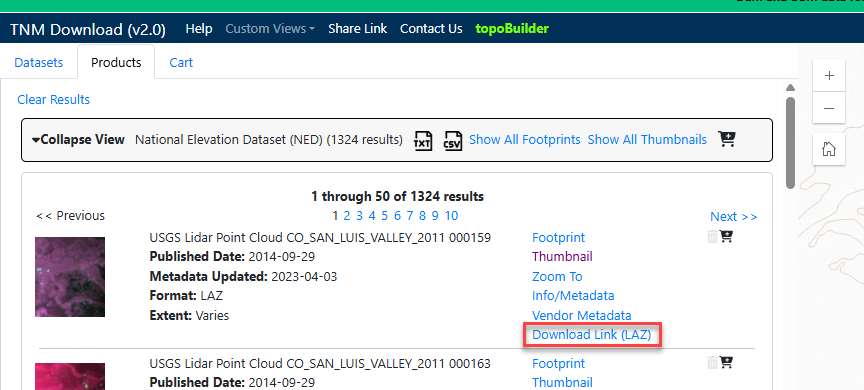
Selecting Download Link (LAZ) will begin the download to the local computer (Figure 8.22). ArcGIS Pro® only recognizes LAS files, but LAZ are the only file type available through The National Map. LAZ files can be processed using ArcGIS Pro® but require special tools which will be discussed in Chapter 12. Introducing the LAS Dataset Toolbars.
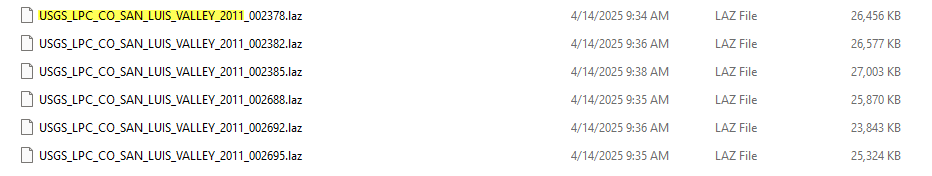
The San Luis Valley, Colorado lidar tiles that we will be using in future chapters are identified in Figure 8.23. Next we will demonstrate how to search for these specific files.
There is one more way to search—using a unique identifier for a specific lidar tile.
Each lidar tile has a unique identifier, highlighted in yellow in Figure 8.23. Each identifier begins the same—USGS_LPC_CO_SAN_LUIS_VALLEY_2011_. The last six digits vary.
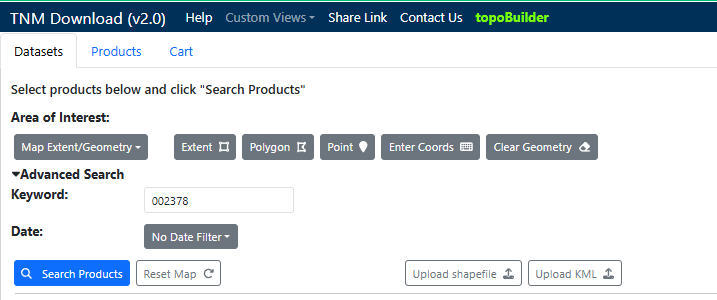
If the unique identifier is known for a lidar tile, a search can be completed with that identifier. Stay zoomed in to San Luis Valley and under the Datasets tab, expand Advanced Search (Figure 8.24). For Keyword, type the 6-digit identifier.[1]
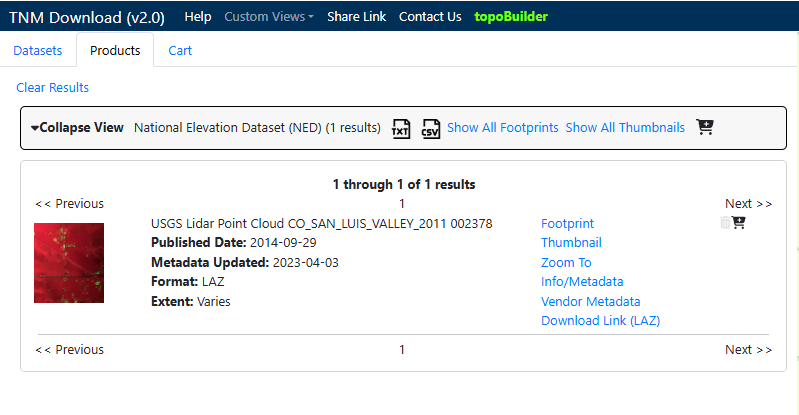
Select Search Products—the results list should contain only the unique tile associated with that product identifier (Figure 8.25)
Next, click on Download Link (LAZ) for this file. Once the download has completed, search for and download the other five files listed in Figure 8.23 using the 6-digit identifier (remember to stay zoomed in to San Luis Valley Colorado). As noted above, we will process these LAZ files to LAS in Chapter 12.
This ends the chapter on using the National Map Viewer download site.
Future chapters will utilize the San Luis Valley LAS files and those files downloaded from the Mesa County Colorado website and the North Dakota website in Chapter 7. Locating Lidar Data.
- You can also search using the entire product identifier if you are not zoomed in to San Luis Valley. ↵
