Chapter 5. Vector Symbology
This chapter provides basic instructions for working with vector symbology in ArcGIS Pro®.
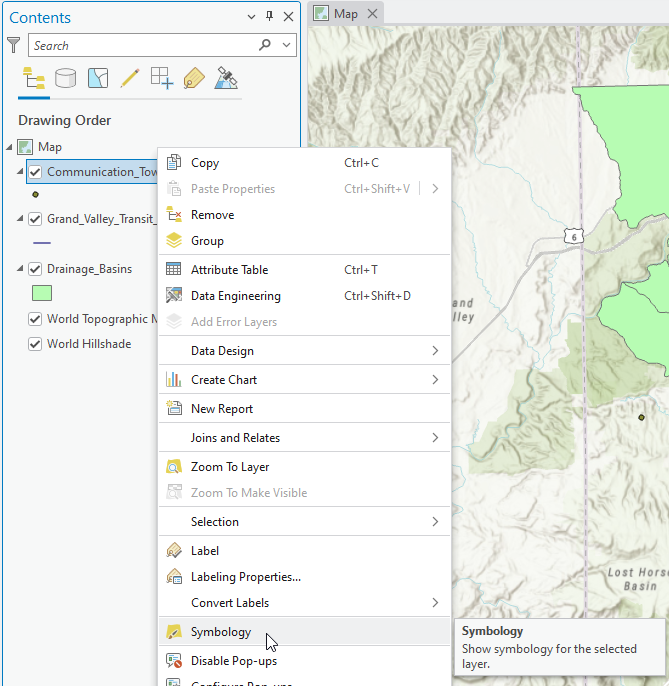
To change symbology for the Communication_Towers layer, right-click on the layer name in Contents and select Symbology from the menu (Figure 5.1).
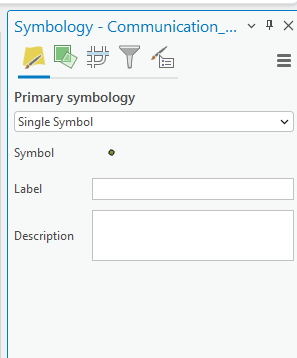
The Symbology dialog opens (Figure 5.2).
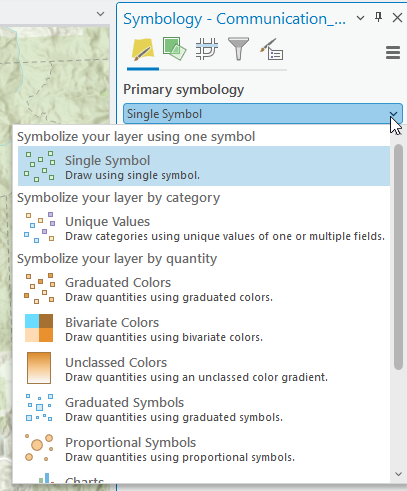
Under Primary Symbology, select the drop-down arrow adjacent to Single Symbol, and a list of symbol types appears (Figure 5.3).
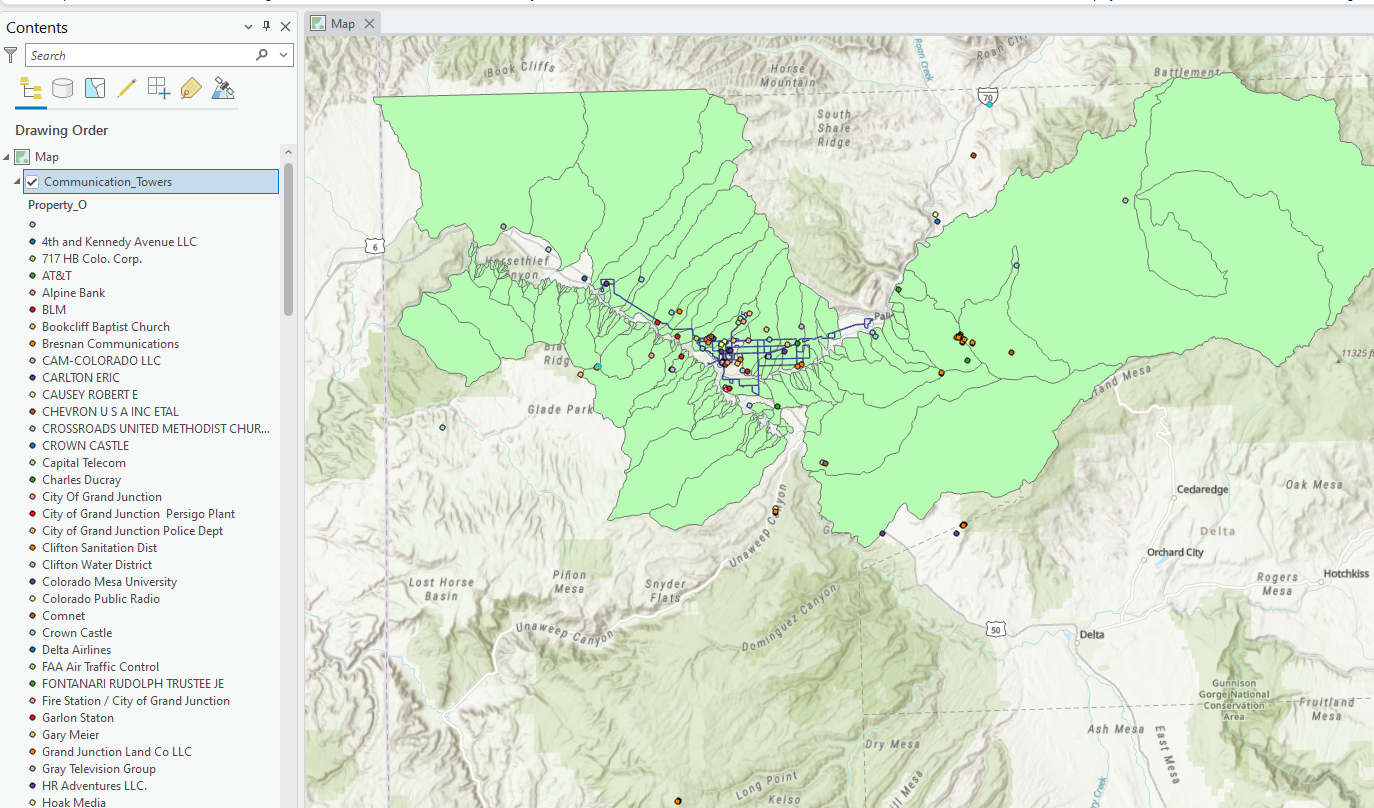
There are many types of symbology. This chapter will cover just a couple of them. Select Unique Values and additional options appear (Figure 5.4). For Field 1 choose Property_O from the feature’s attribute list. Choose a color ramp from the drop-down list for Color scheme. ArcGIS Pro® automatically changes the symbology as each selection is made. When finished, close the Symbology dialog (X in the upper right corner).
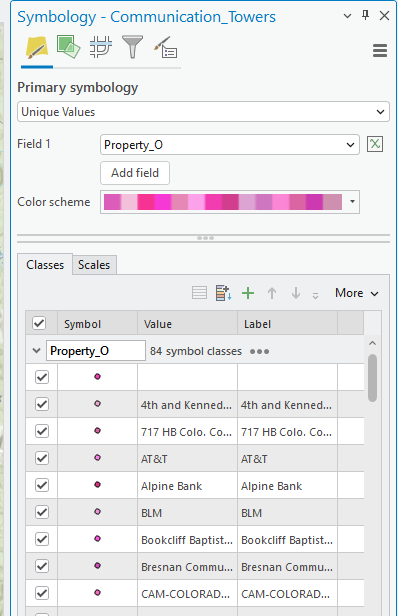
Figure 5.5 shows the new symbology for the Communication_Towers layer.
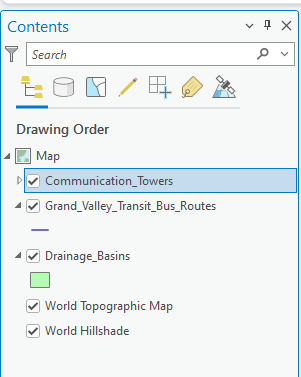
Collapse the symbology list for Communication_Towers by clicking the small triangle before the layer name in Contents (Figure 5.6). The triangle turns hollow.
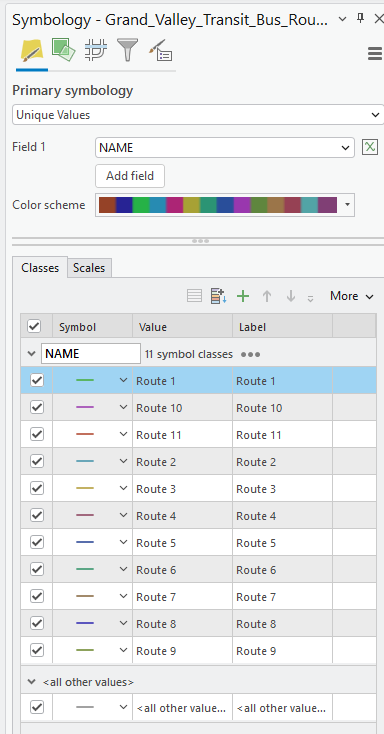
Now follow the same process to change the symbology for the Grand Valley Transit Bus Routes line shapefile, using the Name field. If all the values don’t show when choosing Unique Values, click Add all values under the Classes tab(Figures 5.7 and 5.8).
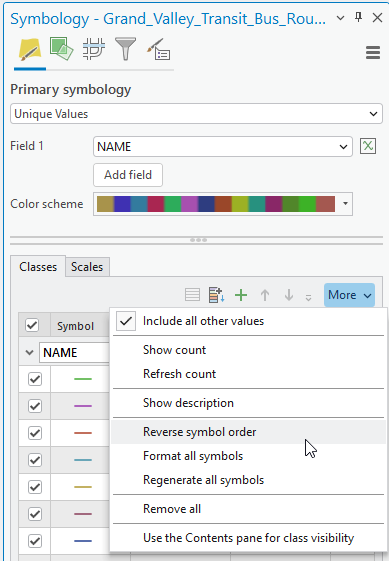
The line width is not very distinctive for this layer. To change the width of the line, select More and choose Format all symbols (Figure 5.9).
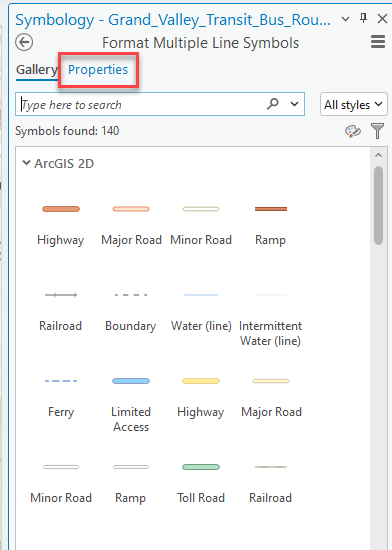
The Format Multiple Line Symbols dialog opens (Figure 5.10). Select the Properties option.
In Properties, change the Line width to 3 pt. (red box in Fig 5.11). Click Apply to apply the change.
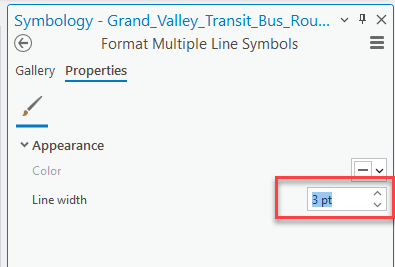
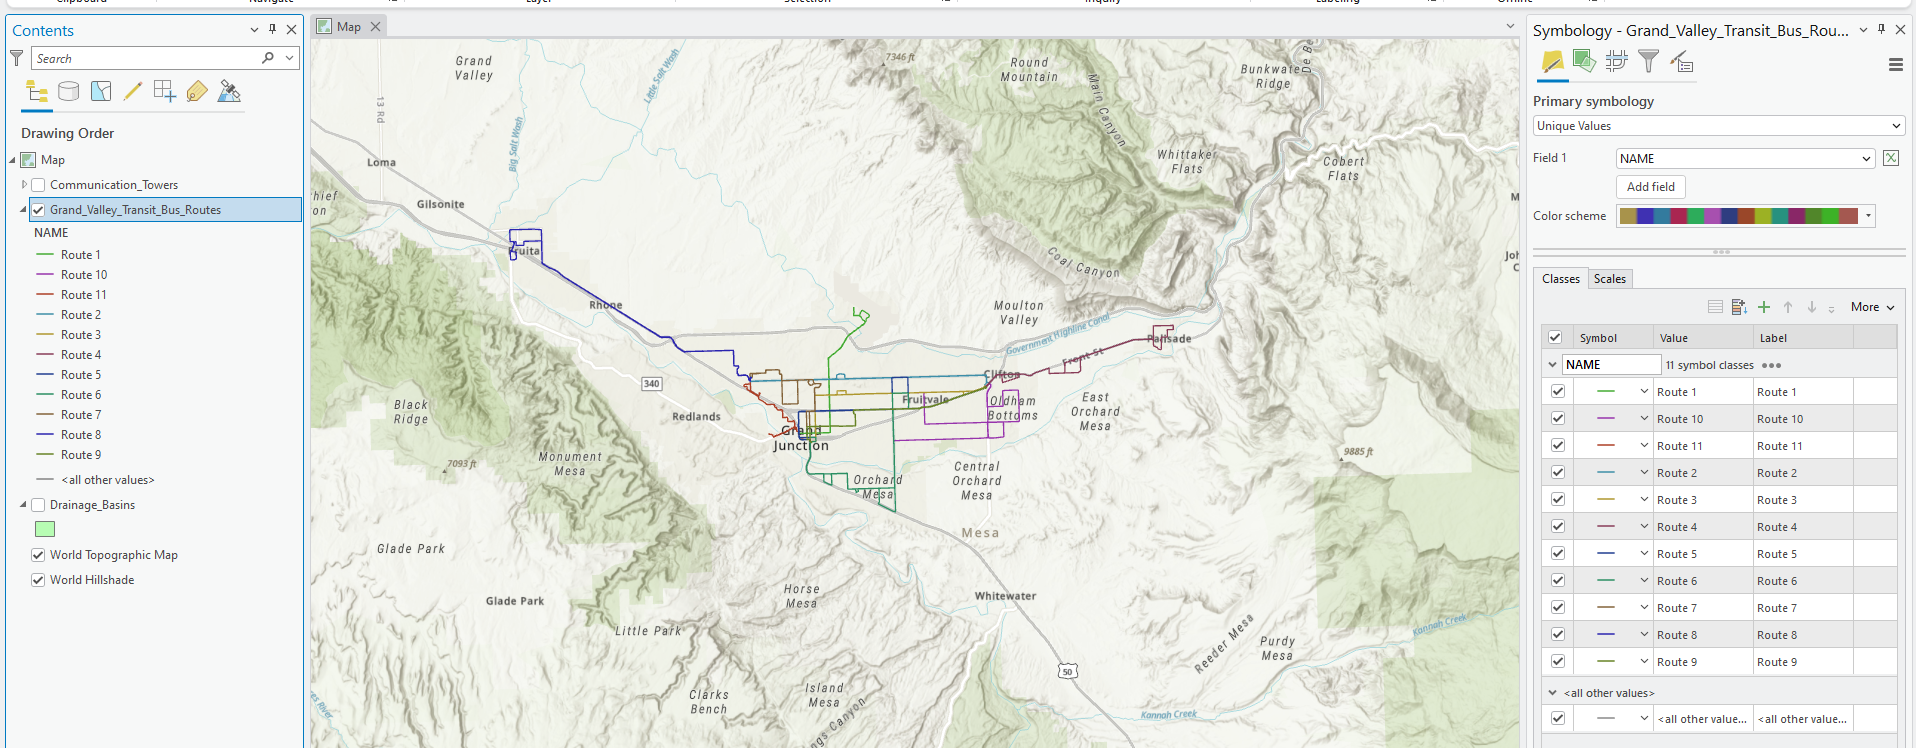
Figure 5.12 displays the results.
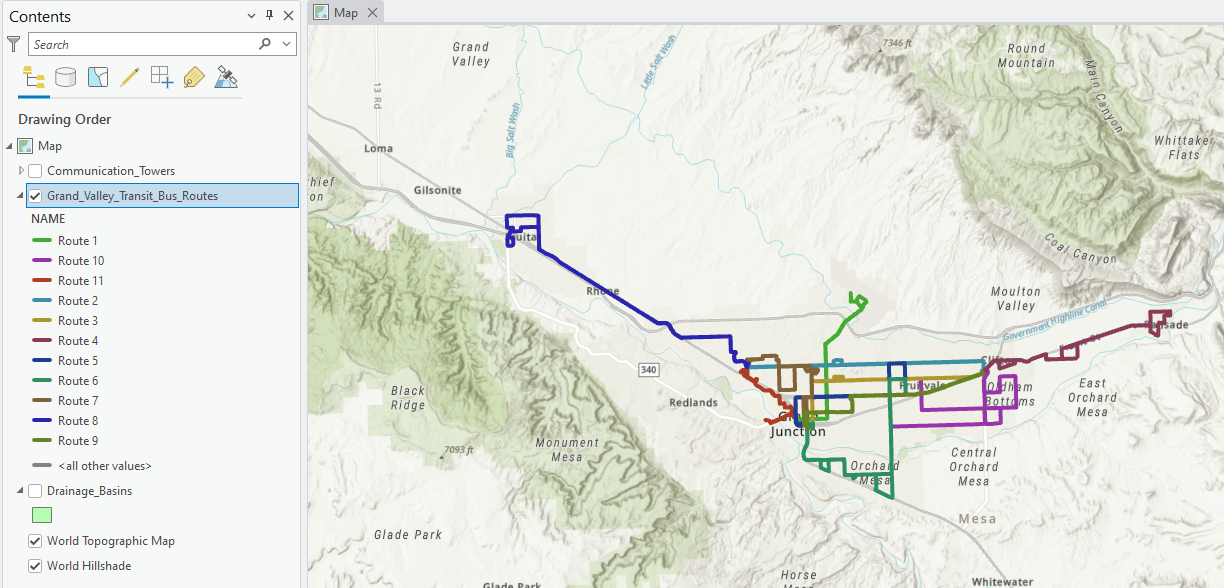
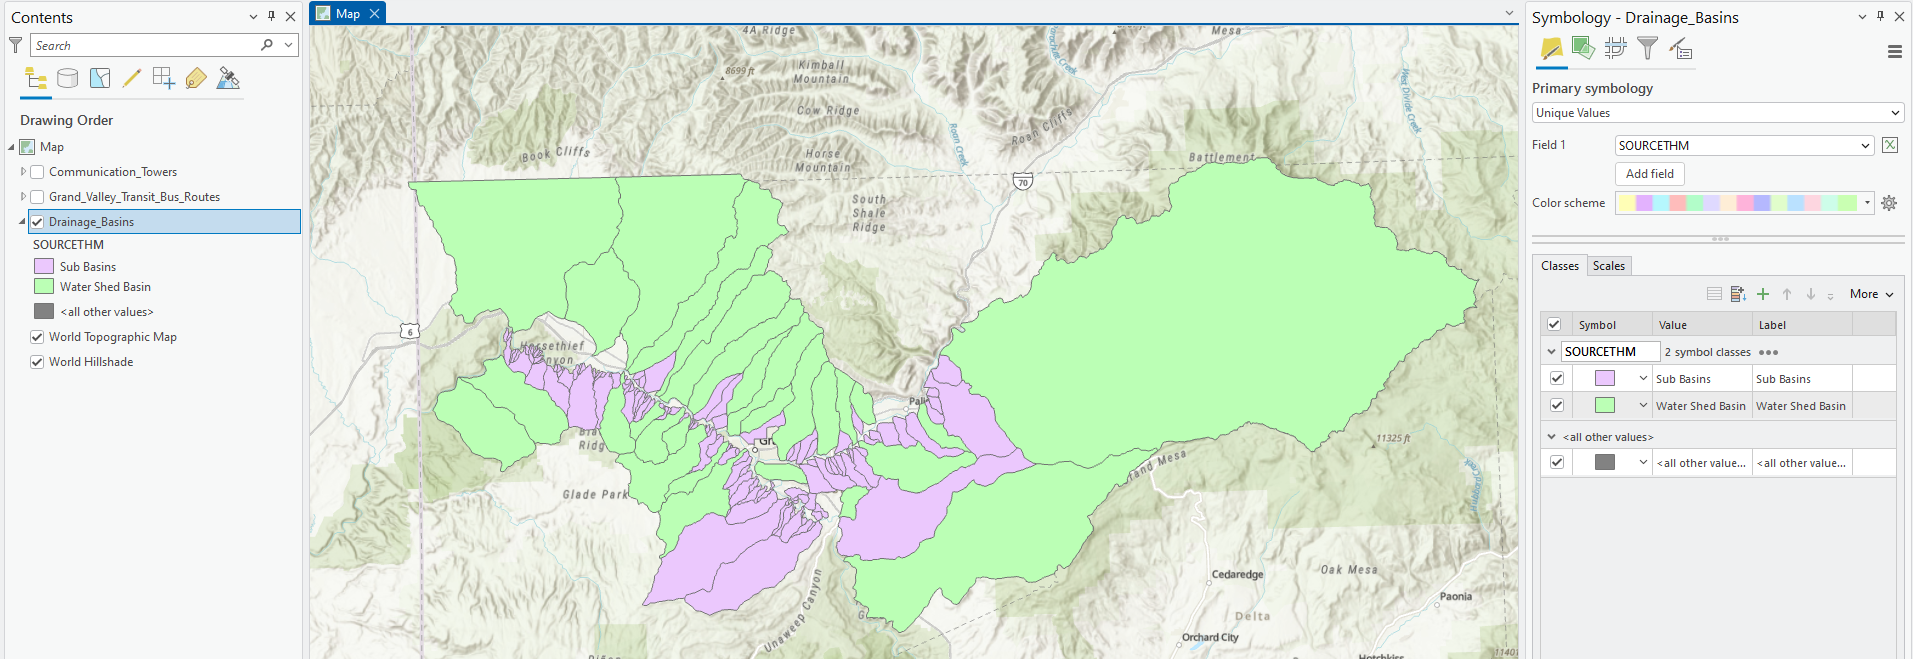
Figure 5.12. The line symbology in Contents and the Map viewerNow change the symbology of the Drainage Basins polygon shapefile without step-by-step instructions. Sample results are shown in Figure 5.13.
This chapter introduced some very basic symbology options for vector data. Many other symbology options are available—for more information, see https://pro.arcgis.com/en/pro-app/help/mapping/map-authoring/symbology-in-vector-tiles.htm.
Chapter 6. Using an .mxd File, next, concludes the chapters on ArcGIS Pro® basics by reviewing how to use an .mxd file (a map created in ArcGIS® Desktop) in ArcGIS Pro®.
