5 Image Processing and Enhancement
When considering image processing options, the purpose or application need associated with your project is the first thing to consider. The application drives the type of product that you need from the imagery. For example, if your project only requires a 2D orthophoto, then the ‘fast orthophoto’ option might be the most appropriate since this option provides the quickest results in terms of processing time. Another excellent application of the ‘fast orthophoto’ option would be to conduct a field test where you find out whether your data collection efforts actually achieved the goals of your project. It is essential to ensure you have collected all the data you need while in the field and before you return to the office! The downside of the ‘fast orthophoto’ option is that you cannot derive other products using this option aside from the orthophoto and a lower-density point cloud. However, after returning to the office, more robust processing options can be conducted once you are confident that your data collection efforts are successful.
It is helpful to go through the image processing options briefly to discuss the advantages and disadvantages of each option. Suppose you want a surface model or a higher-density point cloud? You will need to choose either the Default or High Resolution processing option from the drop-down menu (refer to Figure 12). The High Resolution option generates more mass points than the Default option. The Default option generates a denser point cloud than the ‘Fast Orthophoto’ option. Higher-density point clouds require more processing time.
As discussed previously, the ‘Fast Orthophoto’ option is appropriate if you’re interested in generating an orthophoto. You can still look at the Plant Health indices with this option. A summary of processing options is provided below:
- DSM + DTM will generate a digital terrain model (DTM) in addition to the DSM.
- Forest includes a higher number of points and is of higher quality to represent forests better.
- Point of Interest / Building offers a better mesh representation to deal with man-made structures.
- 3D Model also includes an improved mesh, but it is not clear what the real difference is between this and the previous options.
- Volume Analysis offers an enhanced DTM and DSM for volume calculations.
- Multispectral includes parameters for multispectral images, such as radiometric calibration (warning: advanced topic!).
Viewing and Interpreting the Surface Model for an Image Mosaic
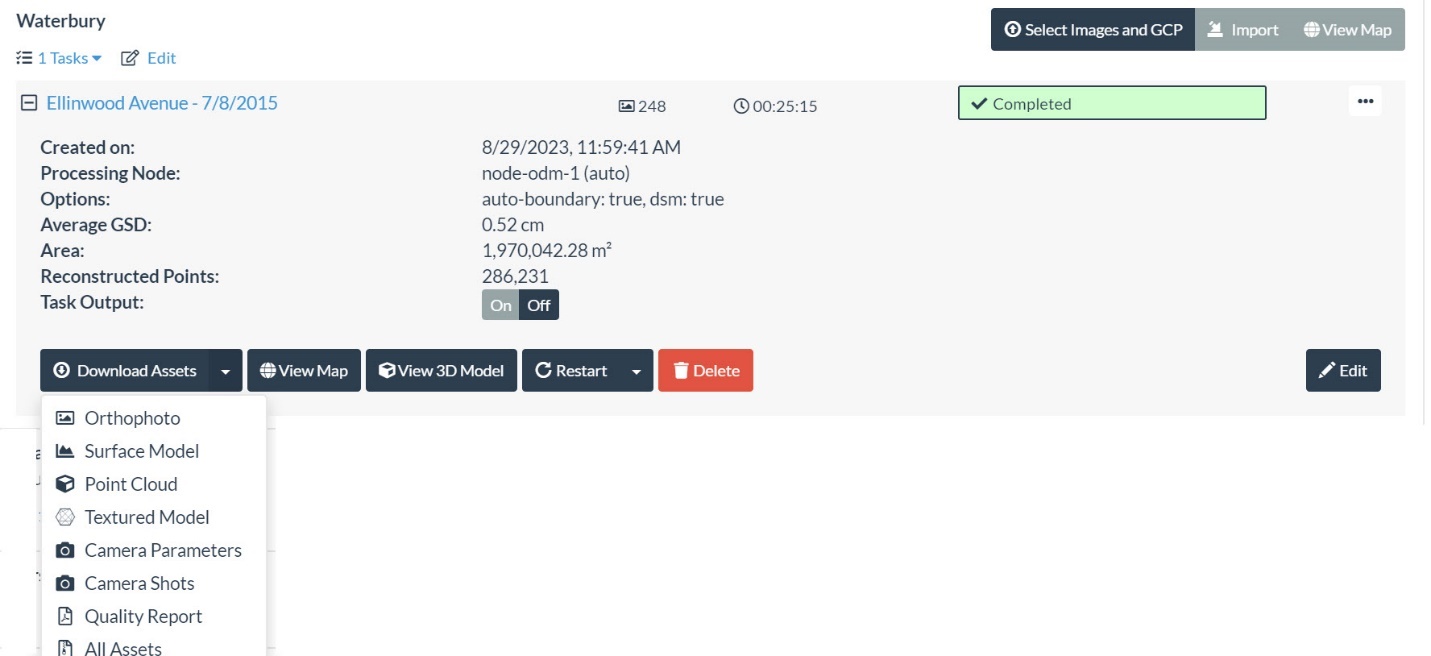
For the following example, we will be using the Waterbury dataset. Download as before from the ODM sample dataset archive (https://www.opendronemap.org/odm/datasets/) to a local folder and unzip the dataset.3 Create a project and select all the Waterbury images as described previously. For this project, choose the ‘Default’ option from the Options drop-down list. The processing time was 25 minutes for 248 images. Your processing time will be different depending on the computer you use. Note that you can always select a subset of these images for processing as long as the images overlap each other. After processing, click on the + to expand the task. The processing result is shown in Figure 29.

Now expand the drop-down box under Download Assets, as shown in Figure 30, and note the products that are available.

Downloadable products include an orthophoto, a surface model, a point cloud, and a textured model.
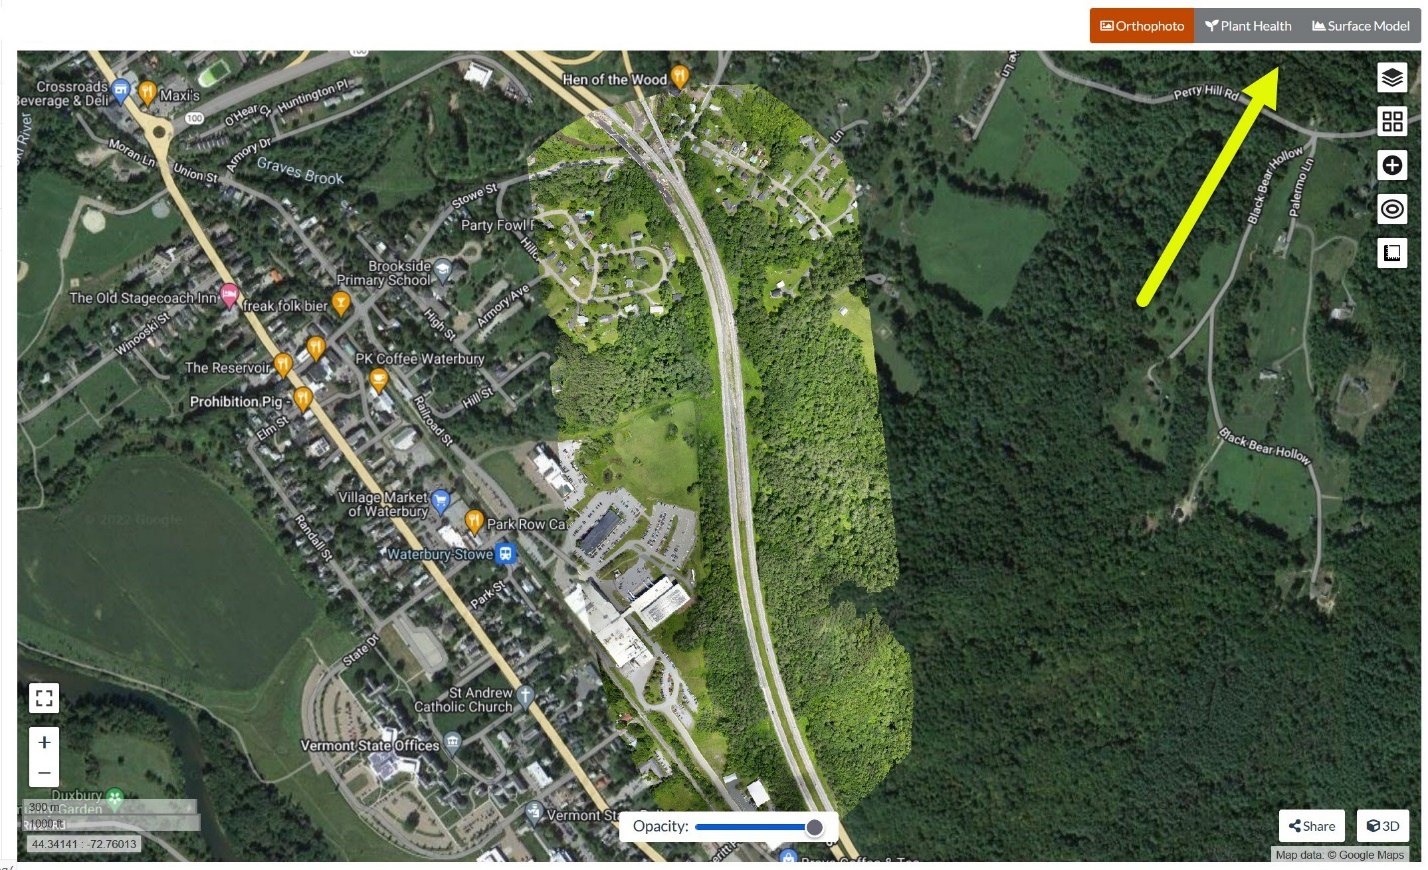
Let’s quickly explore this dataset’s orthophoto (or orthomosaic) by clicking the View Map button. The orthophoto in the Map View is shown below in Figure 31.

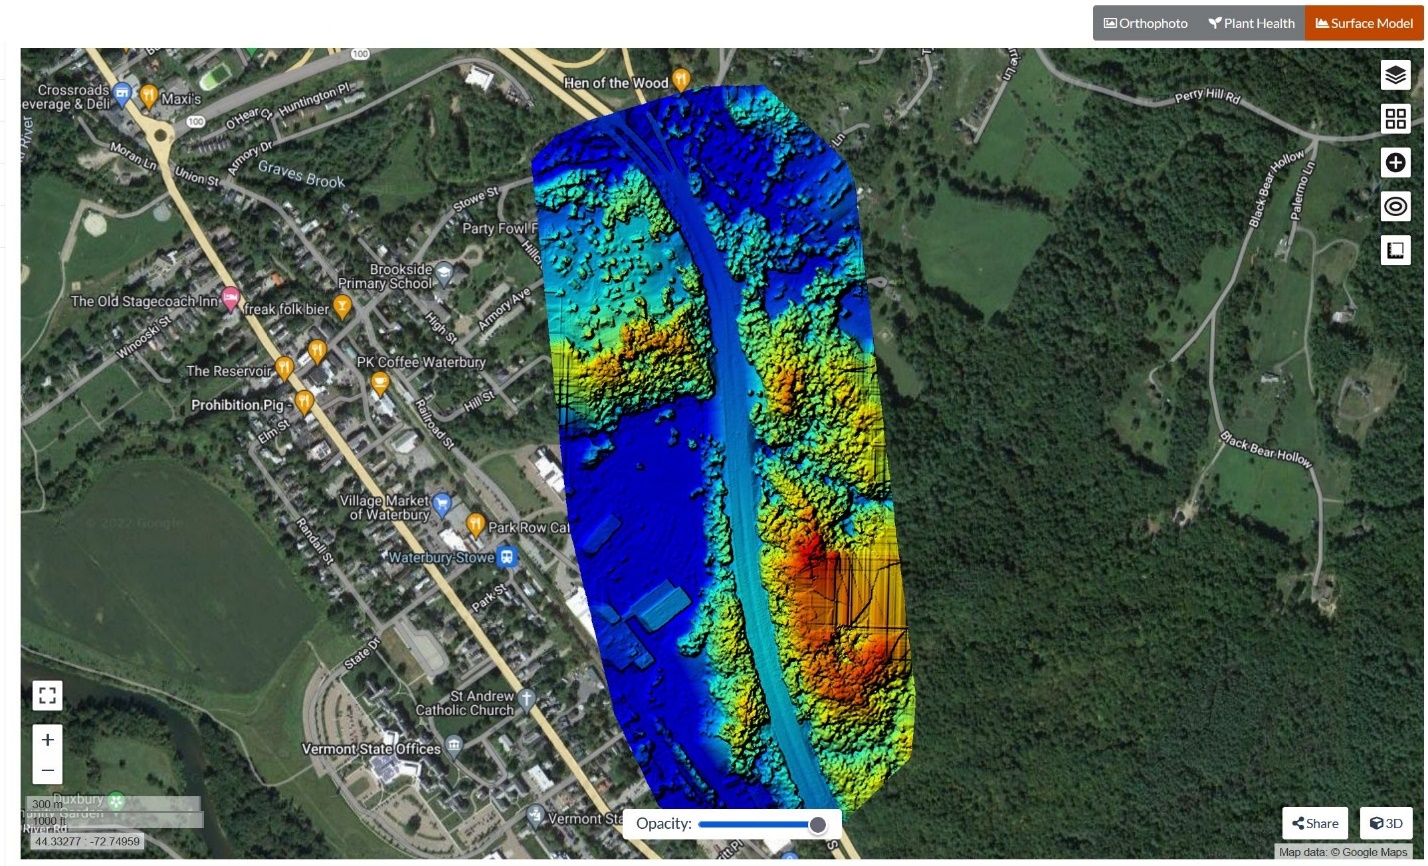
Note that the Orthophoto and Plant Health buttons are still present in the upper right corner of the map view, along with a Surface Model option. Let’s go ahead and click on the Surface Model button. The result is shown in Figure 32.
Compare the Orthophoto and Surface Model images in Figures 31 and 32. It is readily apparent that the yellow and orange features in the Surface Model are high points in the orthophoto (primarily trees), and the dark to light blue areas correspond to lower points in the landscape (fields and roads).

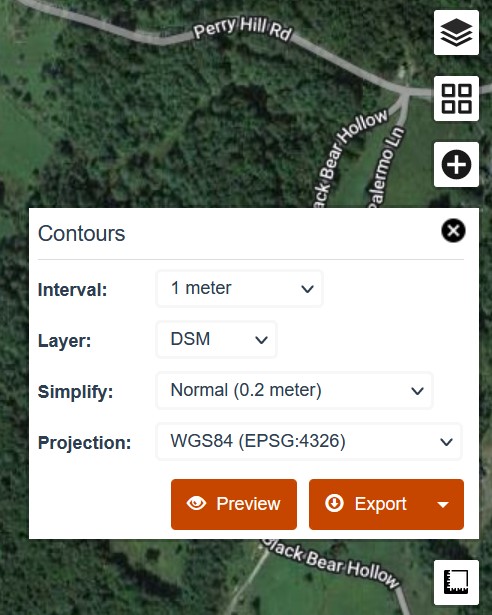
Now click on the Contours tool (refer to Figure 17). This tool will generate a contour lines layer and add the layer to the Surface Model (or the Orthophoto) with specified parameters. The Contours tool will automatically suggest a set of parameters, as seen in Figure 33., but the parameters can be adjusted.

The Contours tool offers several options to explore. The Interval (elevation change) between the contour lines can be adjusted, and the Layer can be exported as a DSM. A Simplify option is available, and the Projection can also be changed (between two standard projections or a customized projection). If you are unsure whether the contour lines would be useful for your project, clicking Preview lets you see the lines before you create and export the layer.
This dataset does not cover an area with significant elevation changes, so the contours will not be demonstrated. Feel free to generate a preview with the default options by clicking Preview and see what happens.
—
3 The Waterbury dataset is also available for download from: https://tinyurl.com/DroneDataT3
