4 Working with WebODM
To work with WebODM, you need access to locally stored images. The best way to obtain these images is to conduct your own flight operations and collect them yourself! Start with a small area—a football field size, small park, etc.). Make sure you adhere to FAA and other federal and local regulations (and don’t forget your check sheets)! You can collect images using manual flight mode or autonomous flight operations. Just keep in mind that you will need to maintain a good image overlap—75% or higher may be necessary for many applications.
Several free autonomous flight planning applications exist if you decide to collect images autonomously. An updated summary list of these apps is available from the “software and apps” section of the VirginiaView website (https://virginiaview.cnre.vt.edu/software-apps/). If you do not have a drone, flying experience, or time to capture your own imagery, you can access archived images through ODM, which maintains a library of projects and images. This project archive is accessible from https://www.opendronemap.org/odm/datasets/. GeoTed-UAS has also provided an sUAS image archive for educators with some local (Virginia-based) datasets here: https://tinyurl.com/DroneDataAllTiers.
Launching WebODM
Start WebODM by opening the WebODM icon on your desktop or by typing WebODM in the Windows Search Bar (Figure 2).
Once you open WebODM, you will be presented with the WebODM Dashboard. The Dashboard is where image processing takes place. You can also access the data view from the Dashboard. Most (if not all) of your time will be spent in the Dashboard section of ODM, and most of this tutorial manual is associated with the Dashboard. The other options are summarized below (Figure 3).
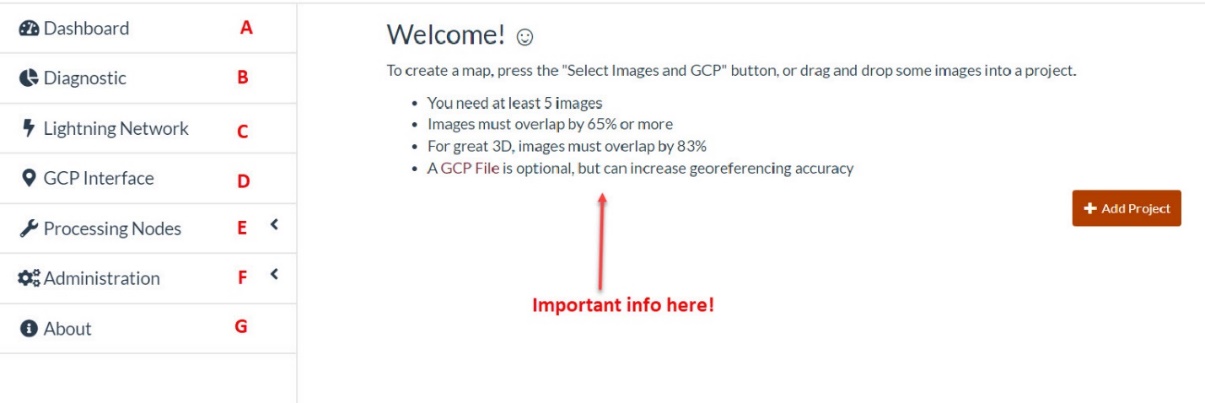
- Dashboard – This is the ‘landing page’ where you can add new projects, edit projects, and initiate processing. We will cover the Dashboard in great detail in this manual.
- Diagnostic – This option provides general information about available storage space, etc.
- Lightning Network – This optional service enables users to process imagery on the WebODM Lightning network (which is in the cloud). This option requires registration and payment.
- GCP Interface – This option lets you establish ground control points to support additional positional accuracy of your data. The GCP Interface is not required when processing images and is beyond the scope of an introduction to image processing tutorial.
- Processing Nodes – if you are not content with processing images on your local computer, you can set up your own processing cluster or server (or cloud-based service, like Amazon Web Services).
- Administration – This option enables you to customize your ODM software instance.
- About – This provides information about your current version of ODM. You can check for updates by selecting the Tools menu (top, pulldown menu) and Check for Updates (recommended).
Creating a Project
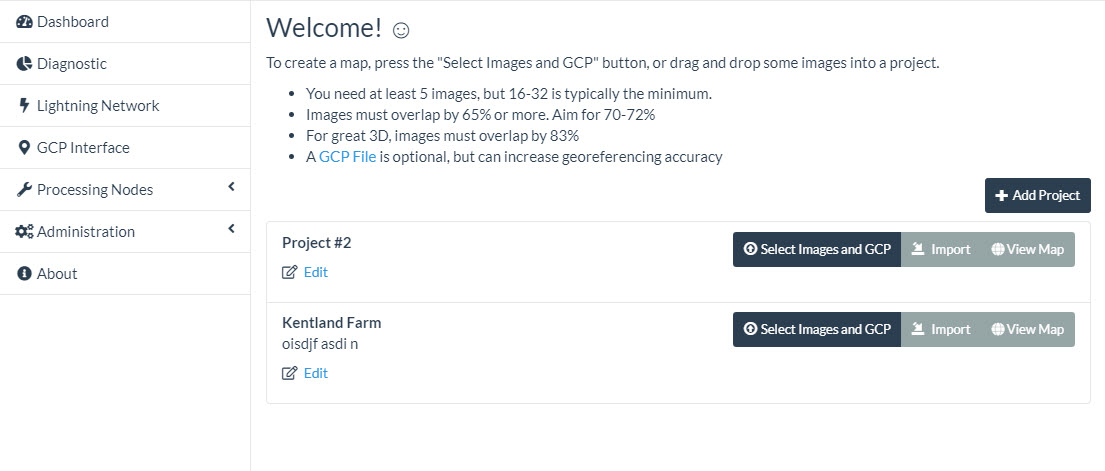
The first step in ODM is to create a new project. The project will serve as a workspace for your collected images, image mosaics, etc. To create a project, select the <add project> button (Figure 4).
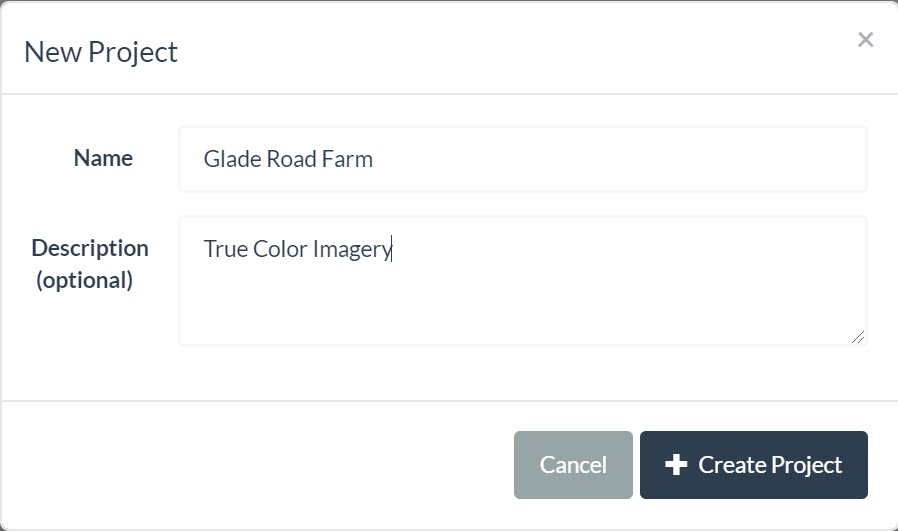
Give your new project a name (and optional description) (Figure 5).
The new project is listed on the Dashboard (Figure 6).
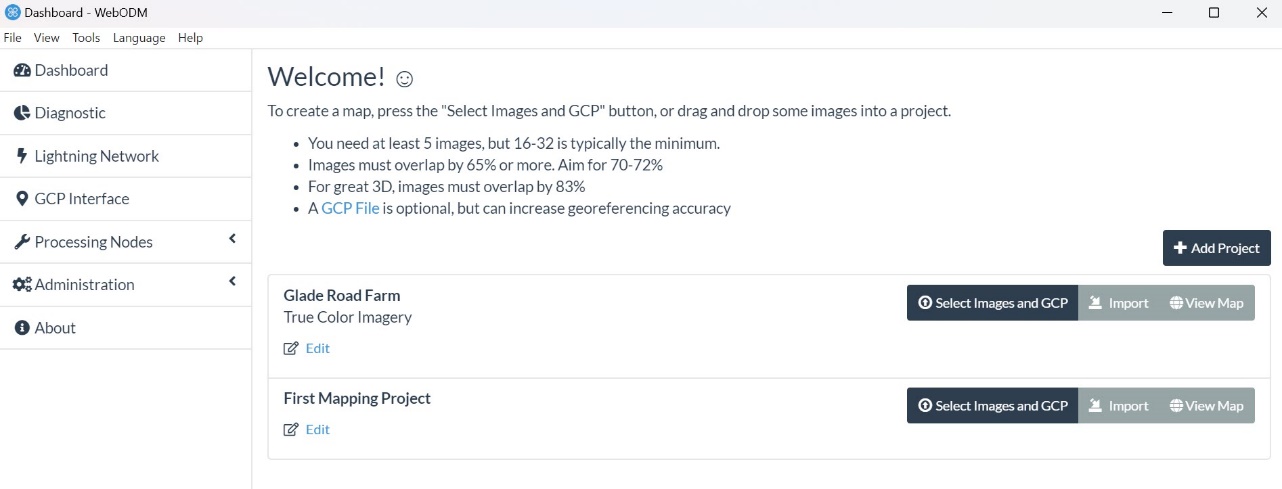
While you have created a new project and added it to the Dashboard, your newly created project is empty. You need to associate data (images) with the project.
Adding Data to Your Project
For the initial example, we will be using the Glad Farm dataset. You can also use your own drone imagery, or you can choose other image datasets from the archive. Just remember that projects with fewer images typically take less time to process!
The Glade Farm dataset is relatively small and is downloadable from the GeoTEd-UAS image archive (https://tinyurl.com/DroneDataT2 ).2 Open the Glade Farm folder to download the imagery and select the Download Zip option (Figure 7).
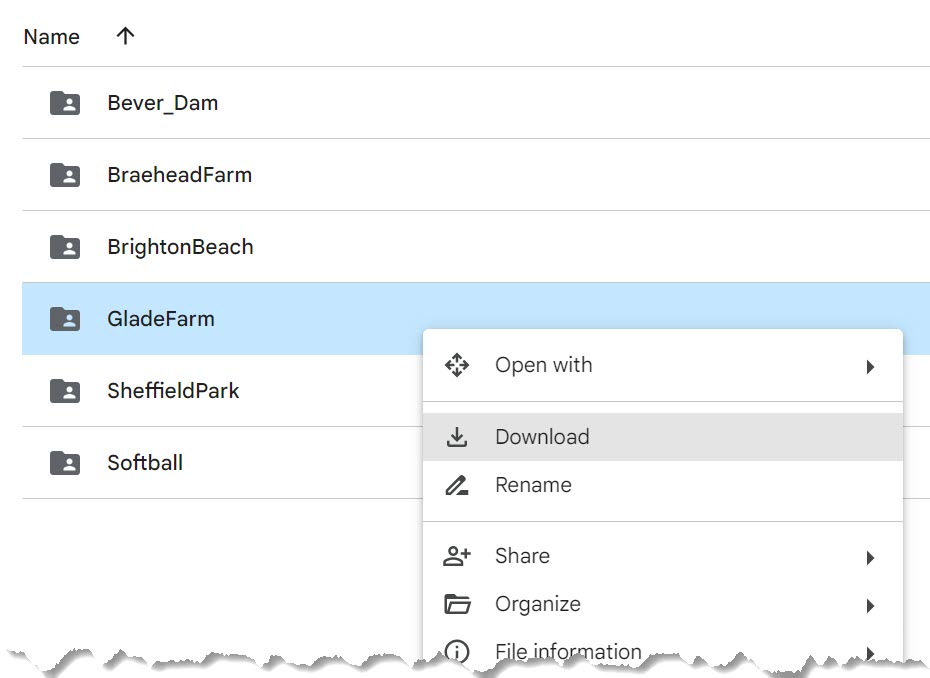
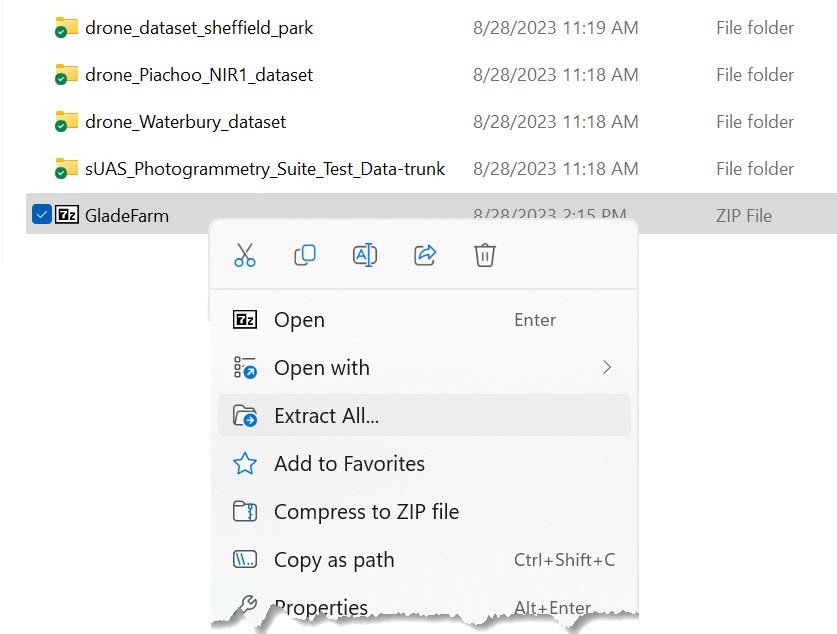
A zipped (compressed) folder will download to your local computer. It is necessary to first extract (i.e., unzip) the folder before working with the data. Extract the folder by navigating to the zipped folder using Windows File Explorer, right-clicking on the zipped folder icon, and selecting Extract All (Figure 8).
Once the files are extracted, you can add images to your project. Choose Select Images and GCP (Figure 9) from the WEBODM Dashboard to add images to your project.

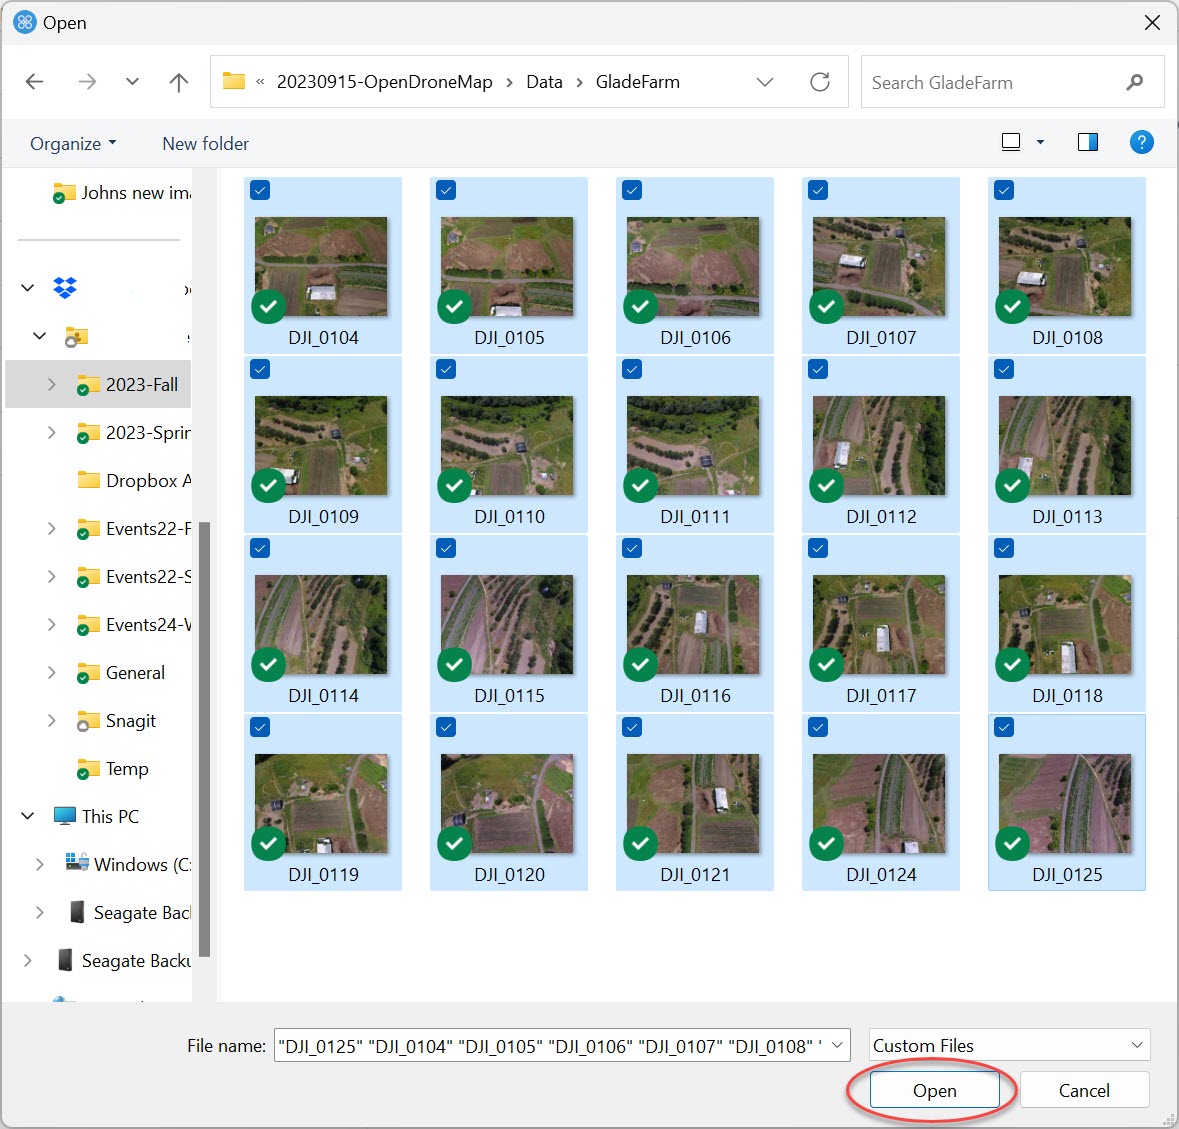
Navigate to the unzipped folder, select all of the images in your project (Ctrl-A), and select Open to add the images to your project (Figure 10).
Teaching Tip: To minimize processing time, you can suggest that students select as few as 15 images. Selected images must overlap each other. To ensure that overlapping images are selected, view the images in ‘Detail‘ mode, sort the images by ‘Date,‘ and select 15 overlapping images.
The box that appears allows you to select additional options associated with the processing of these images (Figure 11).
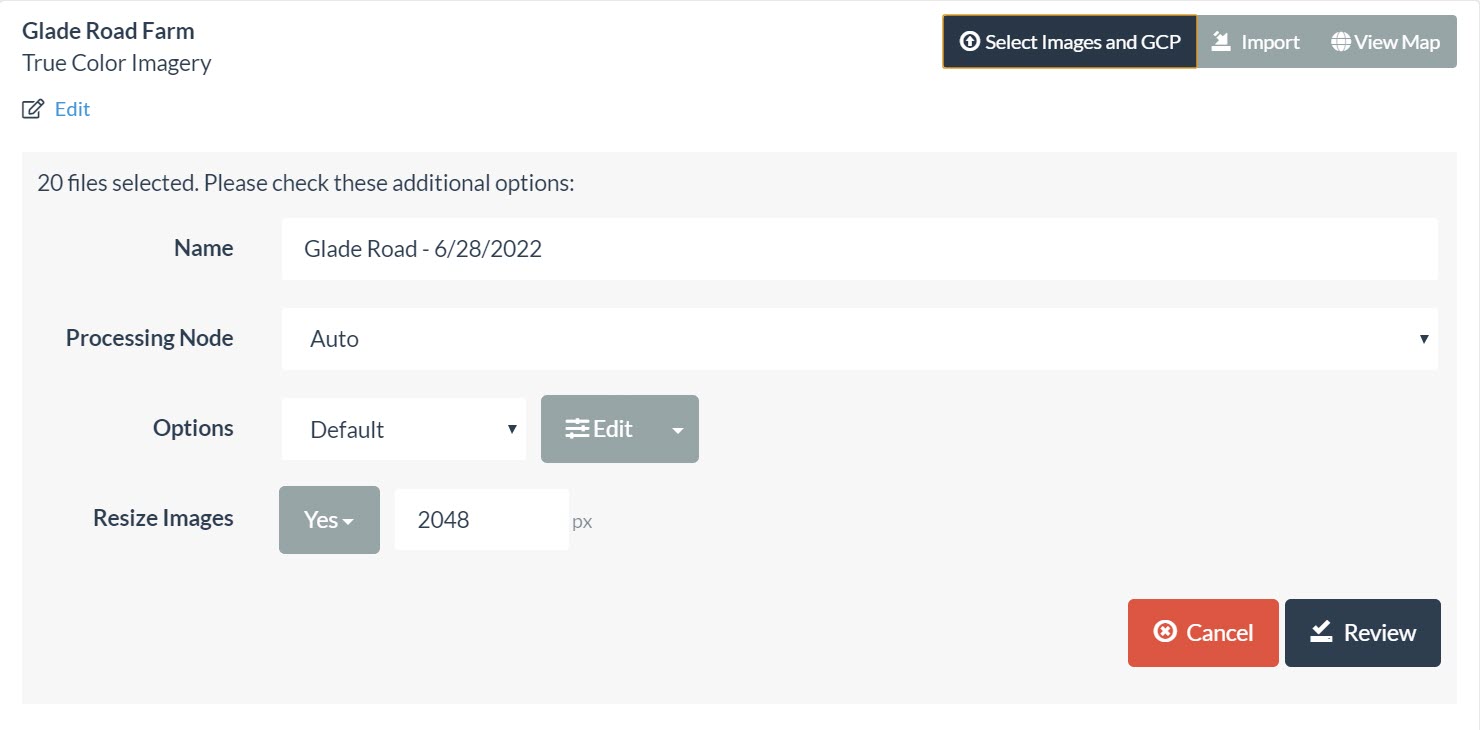
Explore the options under Processing Node. By default, this is set to Auto. For now, let’s stick with Auto.
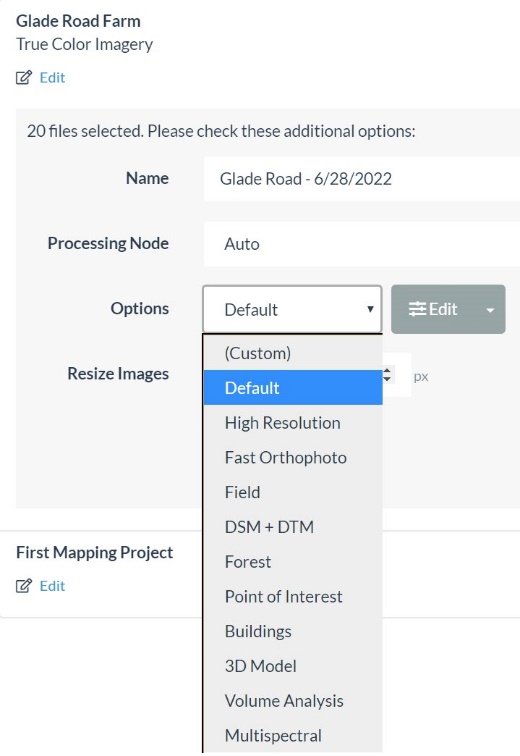
Notice that there is a pulldown list under Options. You can use one of the predefined options listed or create a customized option (using the edit tool). The best way to learn about these is to experiment! For now, you should stick with a predefined option.
High Resolution generates a higher density point clout and typically a higher quality image mosaic. Through this option, you can generate other products, such as point clouds, contours, and DEMs, at a higher quality than the ‘Default’ option. However, the High-Resolution option requires more processing time than the ‘Default’ option.
Another option is the Fast Orthophoto option. The obvious advantage is that the Fast Orthophoto option processes the orthophoto (or orthomosaic) faster than the Default or High Resolution options. The disadvantage of the Fast Orthophoto option is that the process generates fewer mass points (less processing time). The Fast Orthophoto option does not generate a digital surface model. Without a digital surface model, you cannot generate contours (in the View Map window), and you will not be able to make volumetric measurements (both the 2D View Map Window and the 3D View Map window). The Fast Orthophoto option is often used in the field to verify that the collected images are adequate to support more comprehensive processing later.
For now, select the Default option (Figure 12).
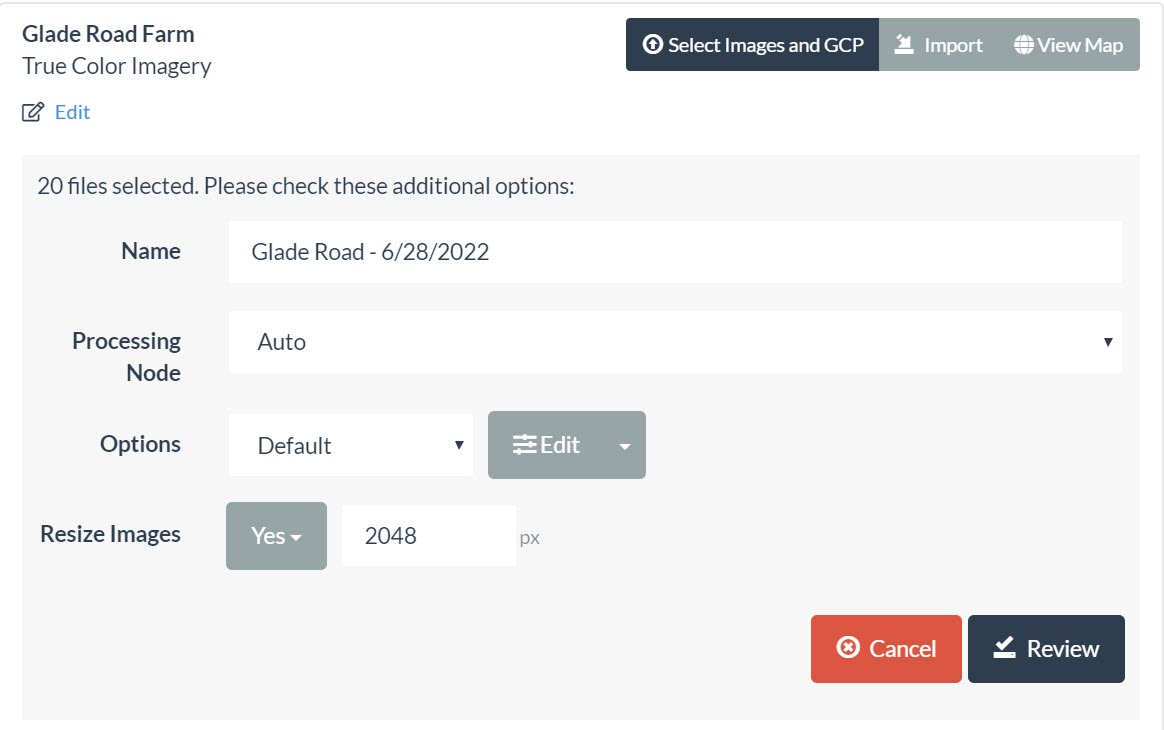
For the Resize Images option, resizing your image can lower processing times and reduce the quality of the final image mosaic. Just stick with the Default option and select Review and Start Processing (replaces the Review button) (Figure 13).
The selected images are loaded and resized before the processing begins. You will notice that each process includes the number of images associated with the process, the processing time, and a status bar that informs you how much is left to process. Note that the status bar does not tend to fill in a linear fashion. The last 70% of the status bar sometimes only takes 15% of the time (Figure 14).

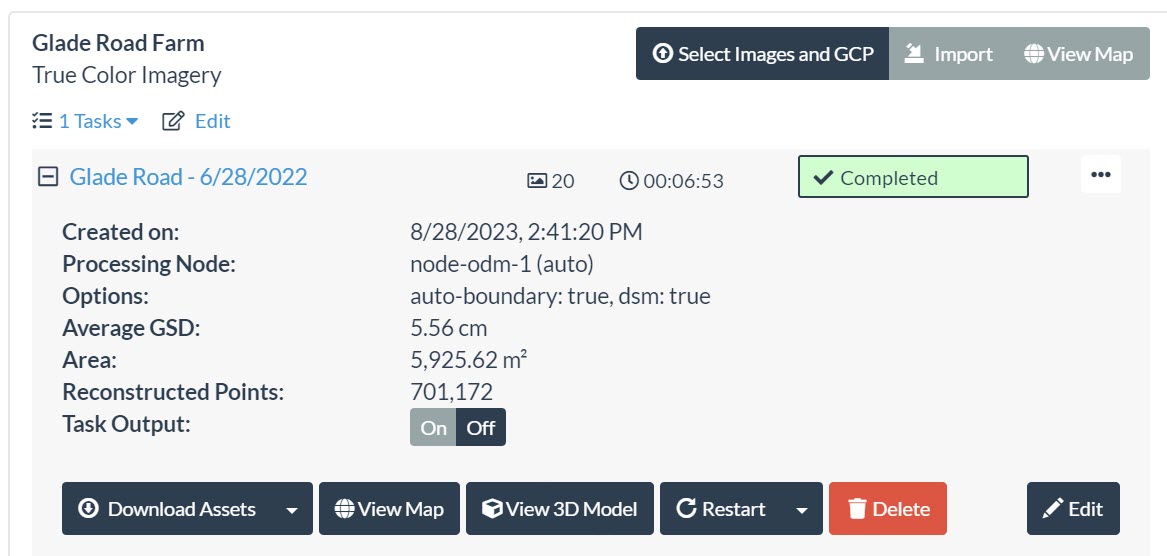
Once the image processing is complete, the status bar will turn green and read Completed. The Glade Farm project has 20 images and took almost 7 minutes to complete (Figure 15). Processing times will vary based on your computer hardware specifications.

Viewing Your Image Mosaic with View Map (2D)
Expand the processing window by clicking on the + symbol beside the project name (Figure 16). This will provide other options.
You can view and explore your image orthophoto in the ODM view or download the orthophoto and other related data products by selecting Download Assets from the expanded Project task window (Figure 16).
You can now view your orthophoto by selecting the View Map option. The View Map window provides several tools to help you further explore and work with your image. The tools associated with View Map are labeled in Figure 17. Explore the tools available to you in the viewer. Their functions are summarized below.
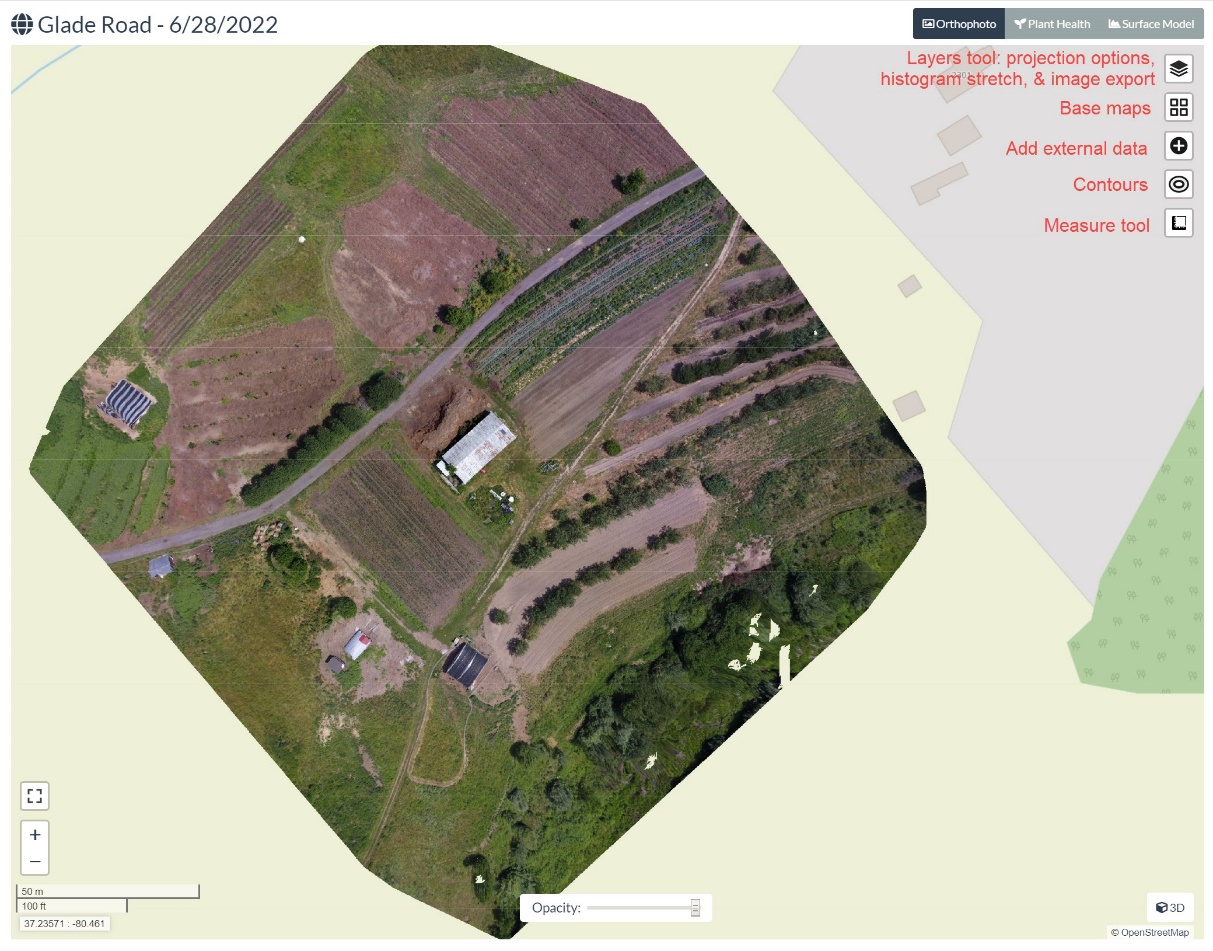
Layers Tool
The layers tool is a suite of tools that modify the image display. These options are identified in Figure 18 and are summarized below.
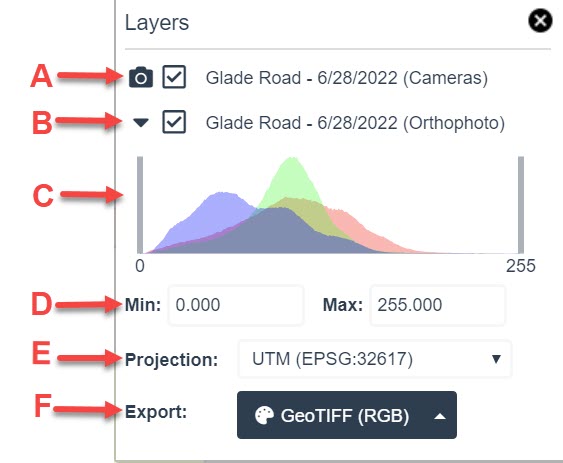
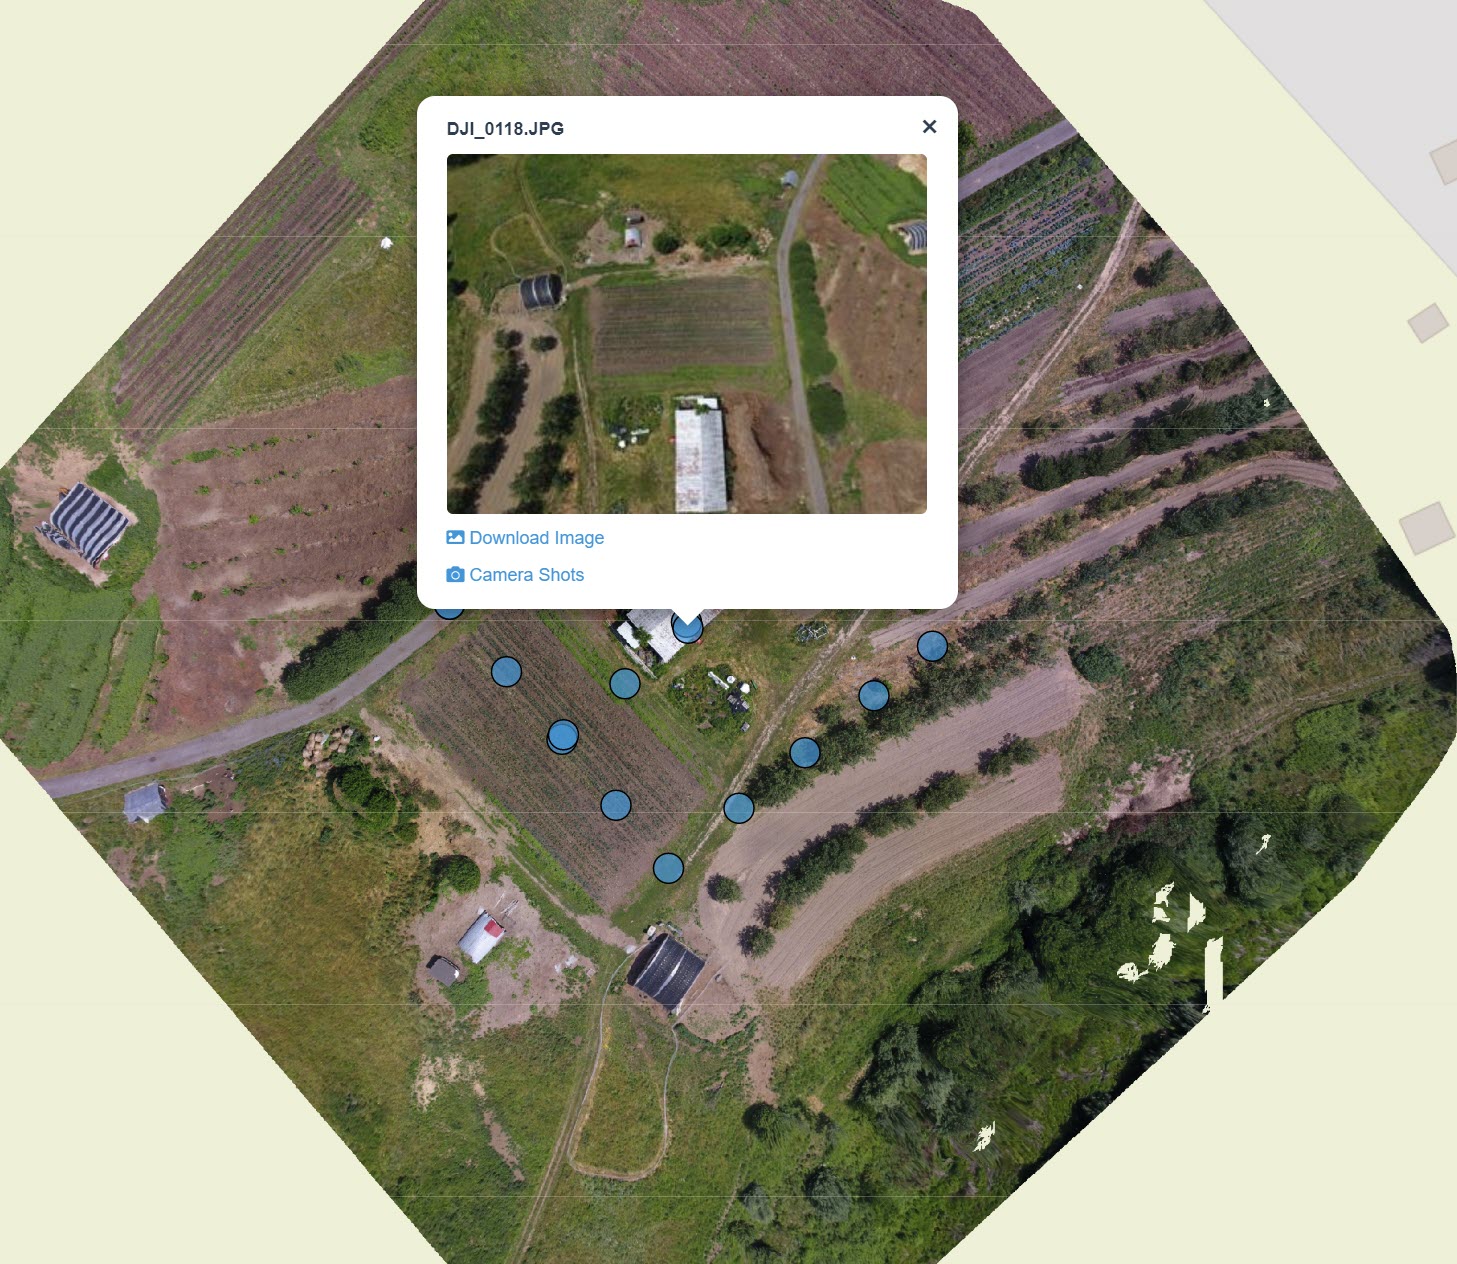
- Camera tool – this option provides a 2D visualization of the general flight path and the image collection points as captured from the drone. You can display the specific image captured at that spot by selecting its collection point (Figure 19).
- Image layer – this option is a toggle that turns your collected image mosaic ‘on and off.’
- Histogram tool – the histogram shows the distribution of the data (reflection values of the pixels) associated with your image. The histogram tool allows you to customize the visualization of your image based on the distribution of these collected data points. This tool is used to enhance the appearance of an image. You can alter the image’s appearance by sliding either of the vertical gray bars (C) back and forth. You can also change the histogram by manually changing the minimum and maximum values.
- Projection – This tool lets you choose a different projection for your image. The modified projection is associated with the image export (not the Image Viewer).
- Export – The export tool provides several format options for exporting your image (JPEG, GeoTIFF, PNG, KMZ, etc.)
Base Maps
A base map is an image that provides a broader spatial context or additional information for your map. Base maps are often referred to as framework data layers and can include hydrography, roads, structures, or imagery. ODM provides several base map image options, including Google Maps, ESRI Satellite, and OpenStreetMap (OSM) Mapnick. The advantage of base maps is that they provide additional context to your image mosaic. The advantage of your drone imagery is that the spatial resolution is probably higher, and your imagery is likely more current than the base map imagery. Drone sensors acquire data on demand. This means you can collect data using a specific sensor at a particular time (specific season, time of day, etc.). Think of this as prescribed and customized data collection!
Add External
This option is used to add external data to your Map View. For example, you can add shapefiles and other data.
Contours
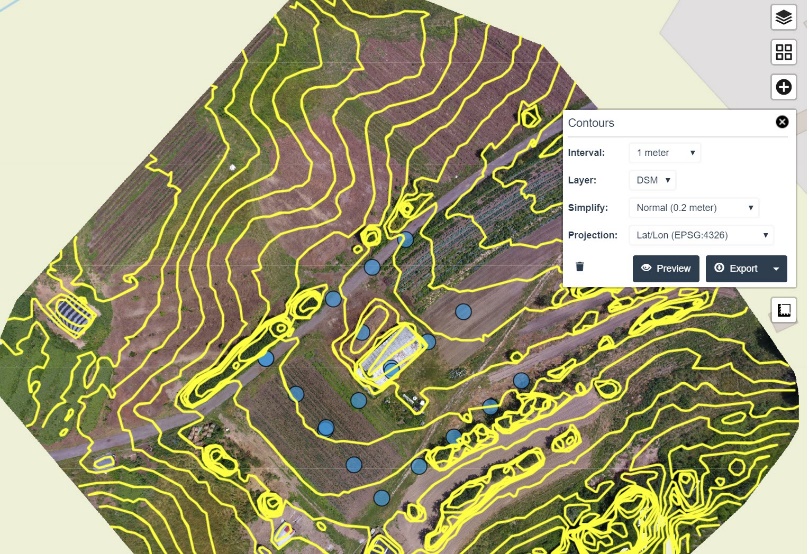
The Contour option enables you to add terrain data layer to your view (note that this tool is not activated when the ‘Fast Orthophoto’ processing option is used). You must select the ‘Default’ or the ‘High Resolution’ processing option to view contours (Figure 20).
Measure tool
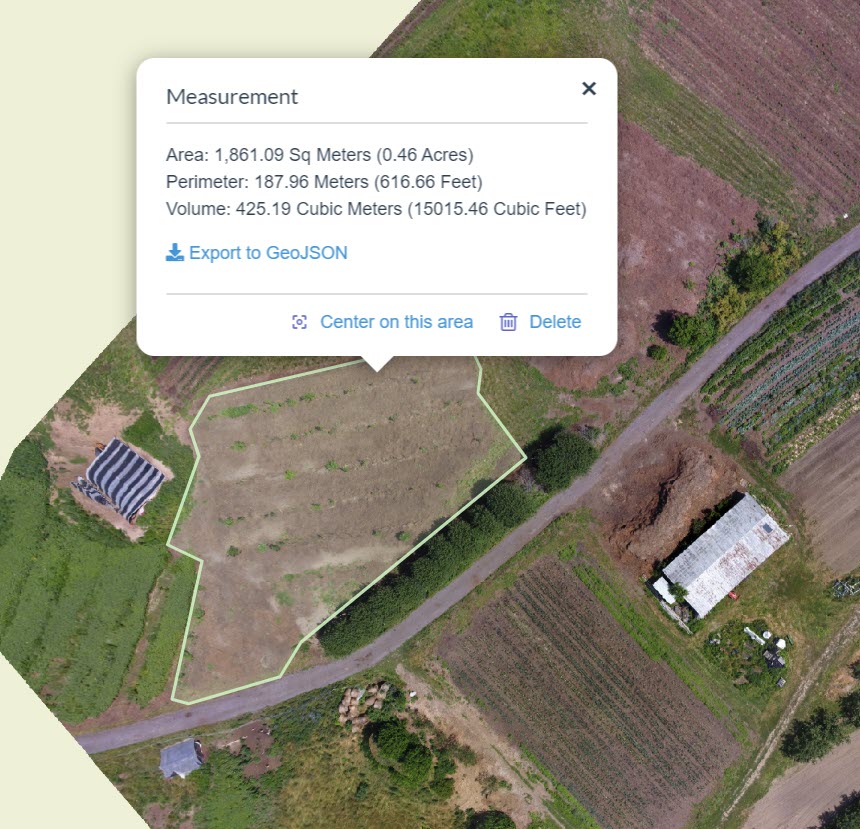
This tool allows you to measure the area and perimeter of a user-defined area of interest on your image mosaic. Volumetric measurements are only possible if a surface model is generated. Note that the Fast Orthophoto option does not generate a surface model. To make volumetric measurements, select the Default or the High Resolution processing option (Figure 21).
Opacity
The opacity slide bar provides a user-defined level of transparency to your image, allowing you to see the base map below.
View Fullscreen
This tool creates a full-screen view of your map.
Zoom in & out
You know the drill! This tool zooms in and out of the center point of the image.
Viewing Your Image Mosaic with View Map (3D)
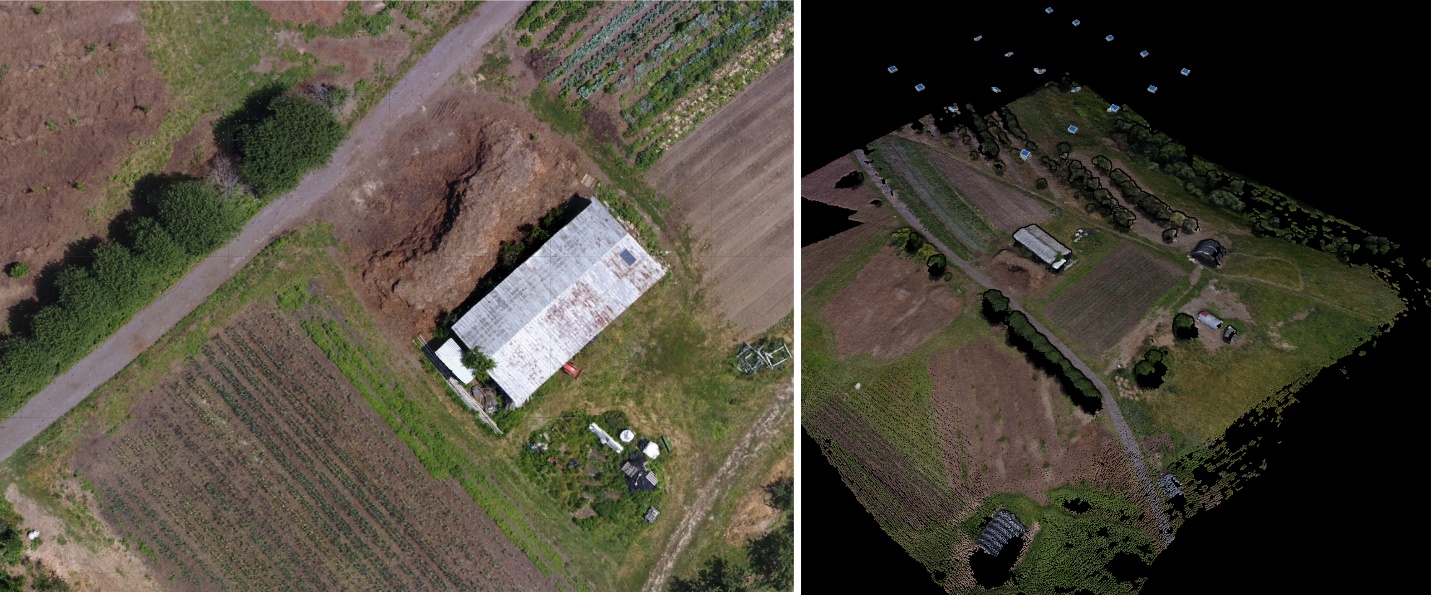
ODM also provides an option to view your imagery in 3D. When using this option, you are using the image’s point cloud (not the image itself) as the image of reference. It is important to note that image mosaics created with the Fast Processing option have a much lower point cloud density. This impacts surface modeling and 3D rendering significantly (as compared to the Default or High Resolution processing options. Remember that while these other processing options provide more complete data models, they also take more time to process. This section will provide an overview of some of the viewing options associated with the 3D Viewer.
The Map Viewer defaults to a nadir view of your project (looking straight down as opposed to an oblique or ‘from the side’ view) (Figure 22). Explore different perspectives of your image using the 3D Map Viewer and some basic navigation options:
- Pan: hold the right button down on your mouse while moving the cursor.
- Zoom in: Use the scroll wheel to zoom in and zoom out.
- Rotate ([tilt], either left to right or oblique): hold the left mouse button down while moving the mouse.
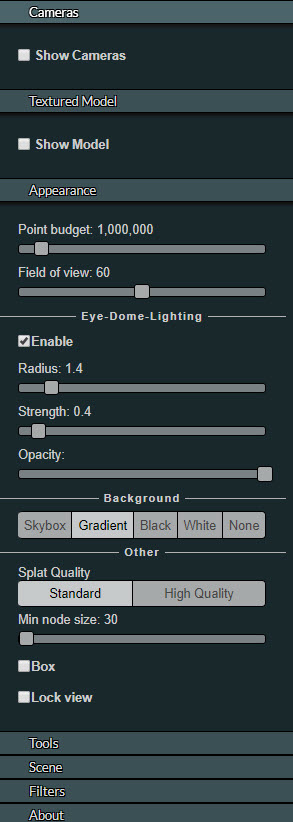
The 3D map viewer menu (Figure 23) provides additional viewing options for exploring your image mosaic. This section provides an overview of the major items on the menu. Selecting the menu item headers will either expand or collapse the options.
Cameras
This option enables you to view locations where the camera captured individual images. From this, you can typically determine the approximate flight path of the drone. You can also visualize the tilt of the aircraft (or, more specifically, the tilt of the sensor on the aircraft) and when the images were captured.
Textured Model
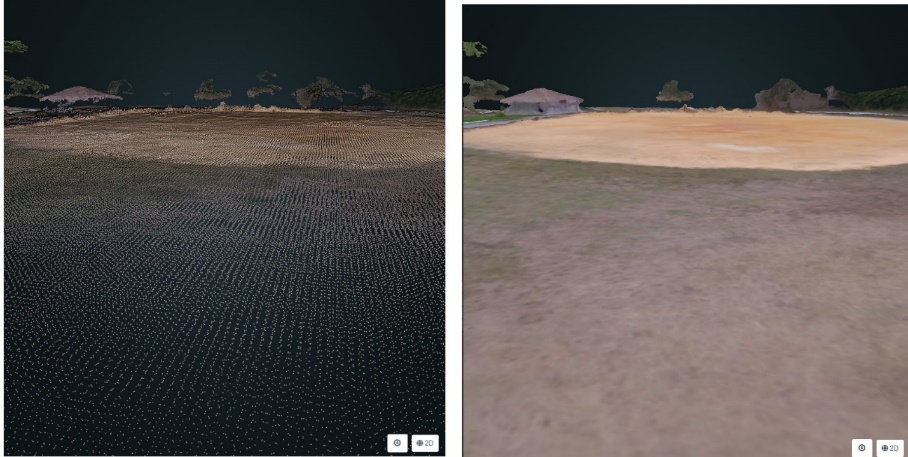
By default, the 3D Map Viewer displays the mass points of the terrain. These points, when viewed while zoomed out, can appear like an image. However, if you zoom into the landscape, you can see that the image is clearly data points, not pixels. The textured model option is created by taking the 2D image, and draping it over the mass points to create the appearance of a 3D image. Figure 24 compares the default view of the mass points and the textured image model.
Appearance
Point Budget: Does your point cloud appear grainy or missing data (Figure 25)? This could be because the software limits the amount of data (the number of points) viewed at any time. Maintaining a low point budget threshold increases drawing performance. Note that you are not ‘erasing’ points by lowering the point budget threshold. You are just limiting how many points will be viewed at that moment (think of it as a drawing ‘filter’).
Eye-Dome Lighting: This is an assortment of illumination tools that can be applied to your image. They are for visualization only and do not change the actual data.
Background: Choose your background color. Black is the default color of the background and typically provides good contrast. However, if you are considering performing a screen capture and printing the image, you may want to choose a less ink-intensive option (white or none).
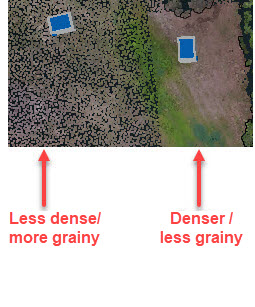
Splat Quality: Surface splatting is a visualization technique often used to enhance the appearance of an image, especially in areas where the density of data points is low (Kovač and Žalik, 2010).
Tools
There is an assortment of tools here, categorized accordingly:
Measurement
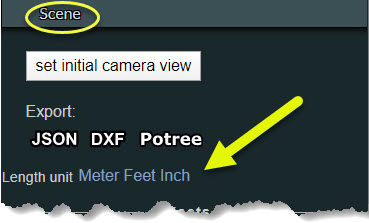
There are tools used to measure angles, distances, heights, points, areas, volumes, and just about anything else that you can imagine. The X tool removes all measurements from the map viewer. By default, all units (length, area, volume) are metric. You can select the length units (metric, feet, inch) under the Scene option by selecting the preferred Length unit (Figure 26).
Measurement options include (some of these options are demonstrated later in this manual):
- Angle
- Distance – used to measure linear distance
- Height – used to measure elevation change
- Circle –The numerical value provided is the radius of a user-defined circle. Software glitch alert! Note that this value always seems to be displayed in meters, even if you change the ‘length unit’ to a non-metric option, as described above.
- Azimuth – measured in degrees (0 = north, 90 = east, 180 = south, and 270 = east).
- Area – Use the right button of the cursor to establish nodes and outline a polygon. Use the left button of the cursor to close the polygon / stop adding vertices (square units).
- Volume for rectangular shapes (structures, etc.) (cubic units).
- Volume for rounded shapes (gravel piles, tree canopy, etc.) (cubic units).
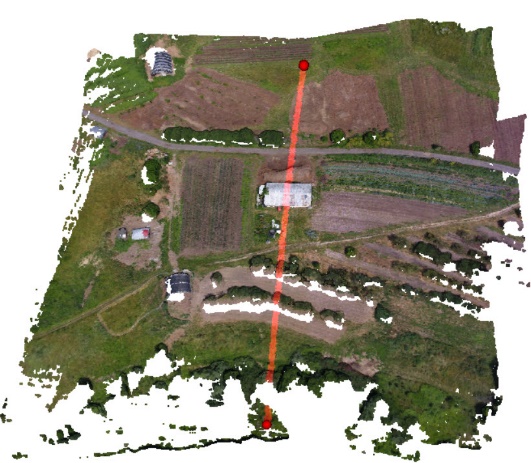
- Height profile – shows a 2D height profile of a user-defined line. Delineate a line by using the left mouse buttons to create vertices (Figure 27). When finished, click on the Show 2D Profile button, which is located under the Scene option (left menu). This will generate a 2D profile (Figure 28). Note that this tool tends to work best with images that have substantial elevation change.

Clipping
The clipping tool enables users to extract specifics associated with an image. You can use this tool to ‘clip away’ any unwanted data or ‘clip and save’ only the data you want to view. Use the X tool to clear (or undo) your clip.
Navigation
These tools provide basic navigational options (panning, zooming, etc.). It is unclear what the difference is between the bird icon and helicopter icon options. It is also unclear what the camera animation option is useful for. The Compass and the full Extent tools are fairly handy, though.
Scene
This option allows you to export measurements in formats such as for Computer Aided Drafting (CAD).
Filters
The filters menu enables users to change the color of the classified point clouds. It also allows users to select a subset of the point cloud returns (by value). By default, all point classifications are shown.
—
