Want to create or adapt books like this? Learn more about how Pressbooks supports open publishing practices.
1 Understanding Science
Learning Objectives
By the end of this chapter, students should be able to:
Contrast objective and subjective observations, as well as quantitative and qualitative observations.
Identify a pseudoscience based on its lack of falsifiability.
Contrast the methods used by Aristotle and Galileo to describe the natural environment.
Explain the scientific method, and apply it to a problem or question.
Describe the foundations of modern geology, such as the principle of uniformitarianism.
Contrast uniformitarianism with catastrophism.
Explain why studying geology is important.
Identify how Earth materials are transformed by rock cycle processes.
Describe the steps involved in a reputable scientific study.
Explain rhetorical arguments used by science deniers.
1.1 What Is Science?
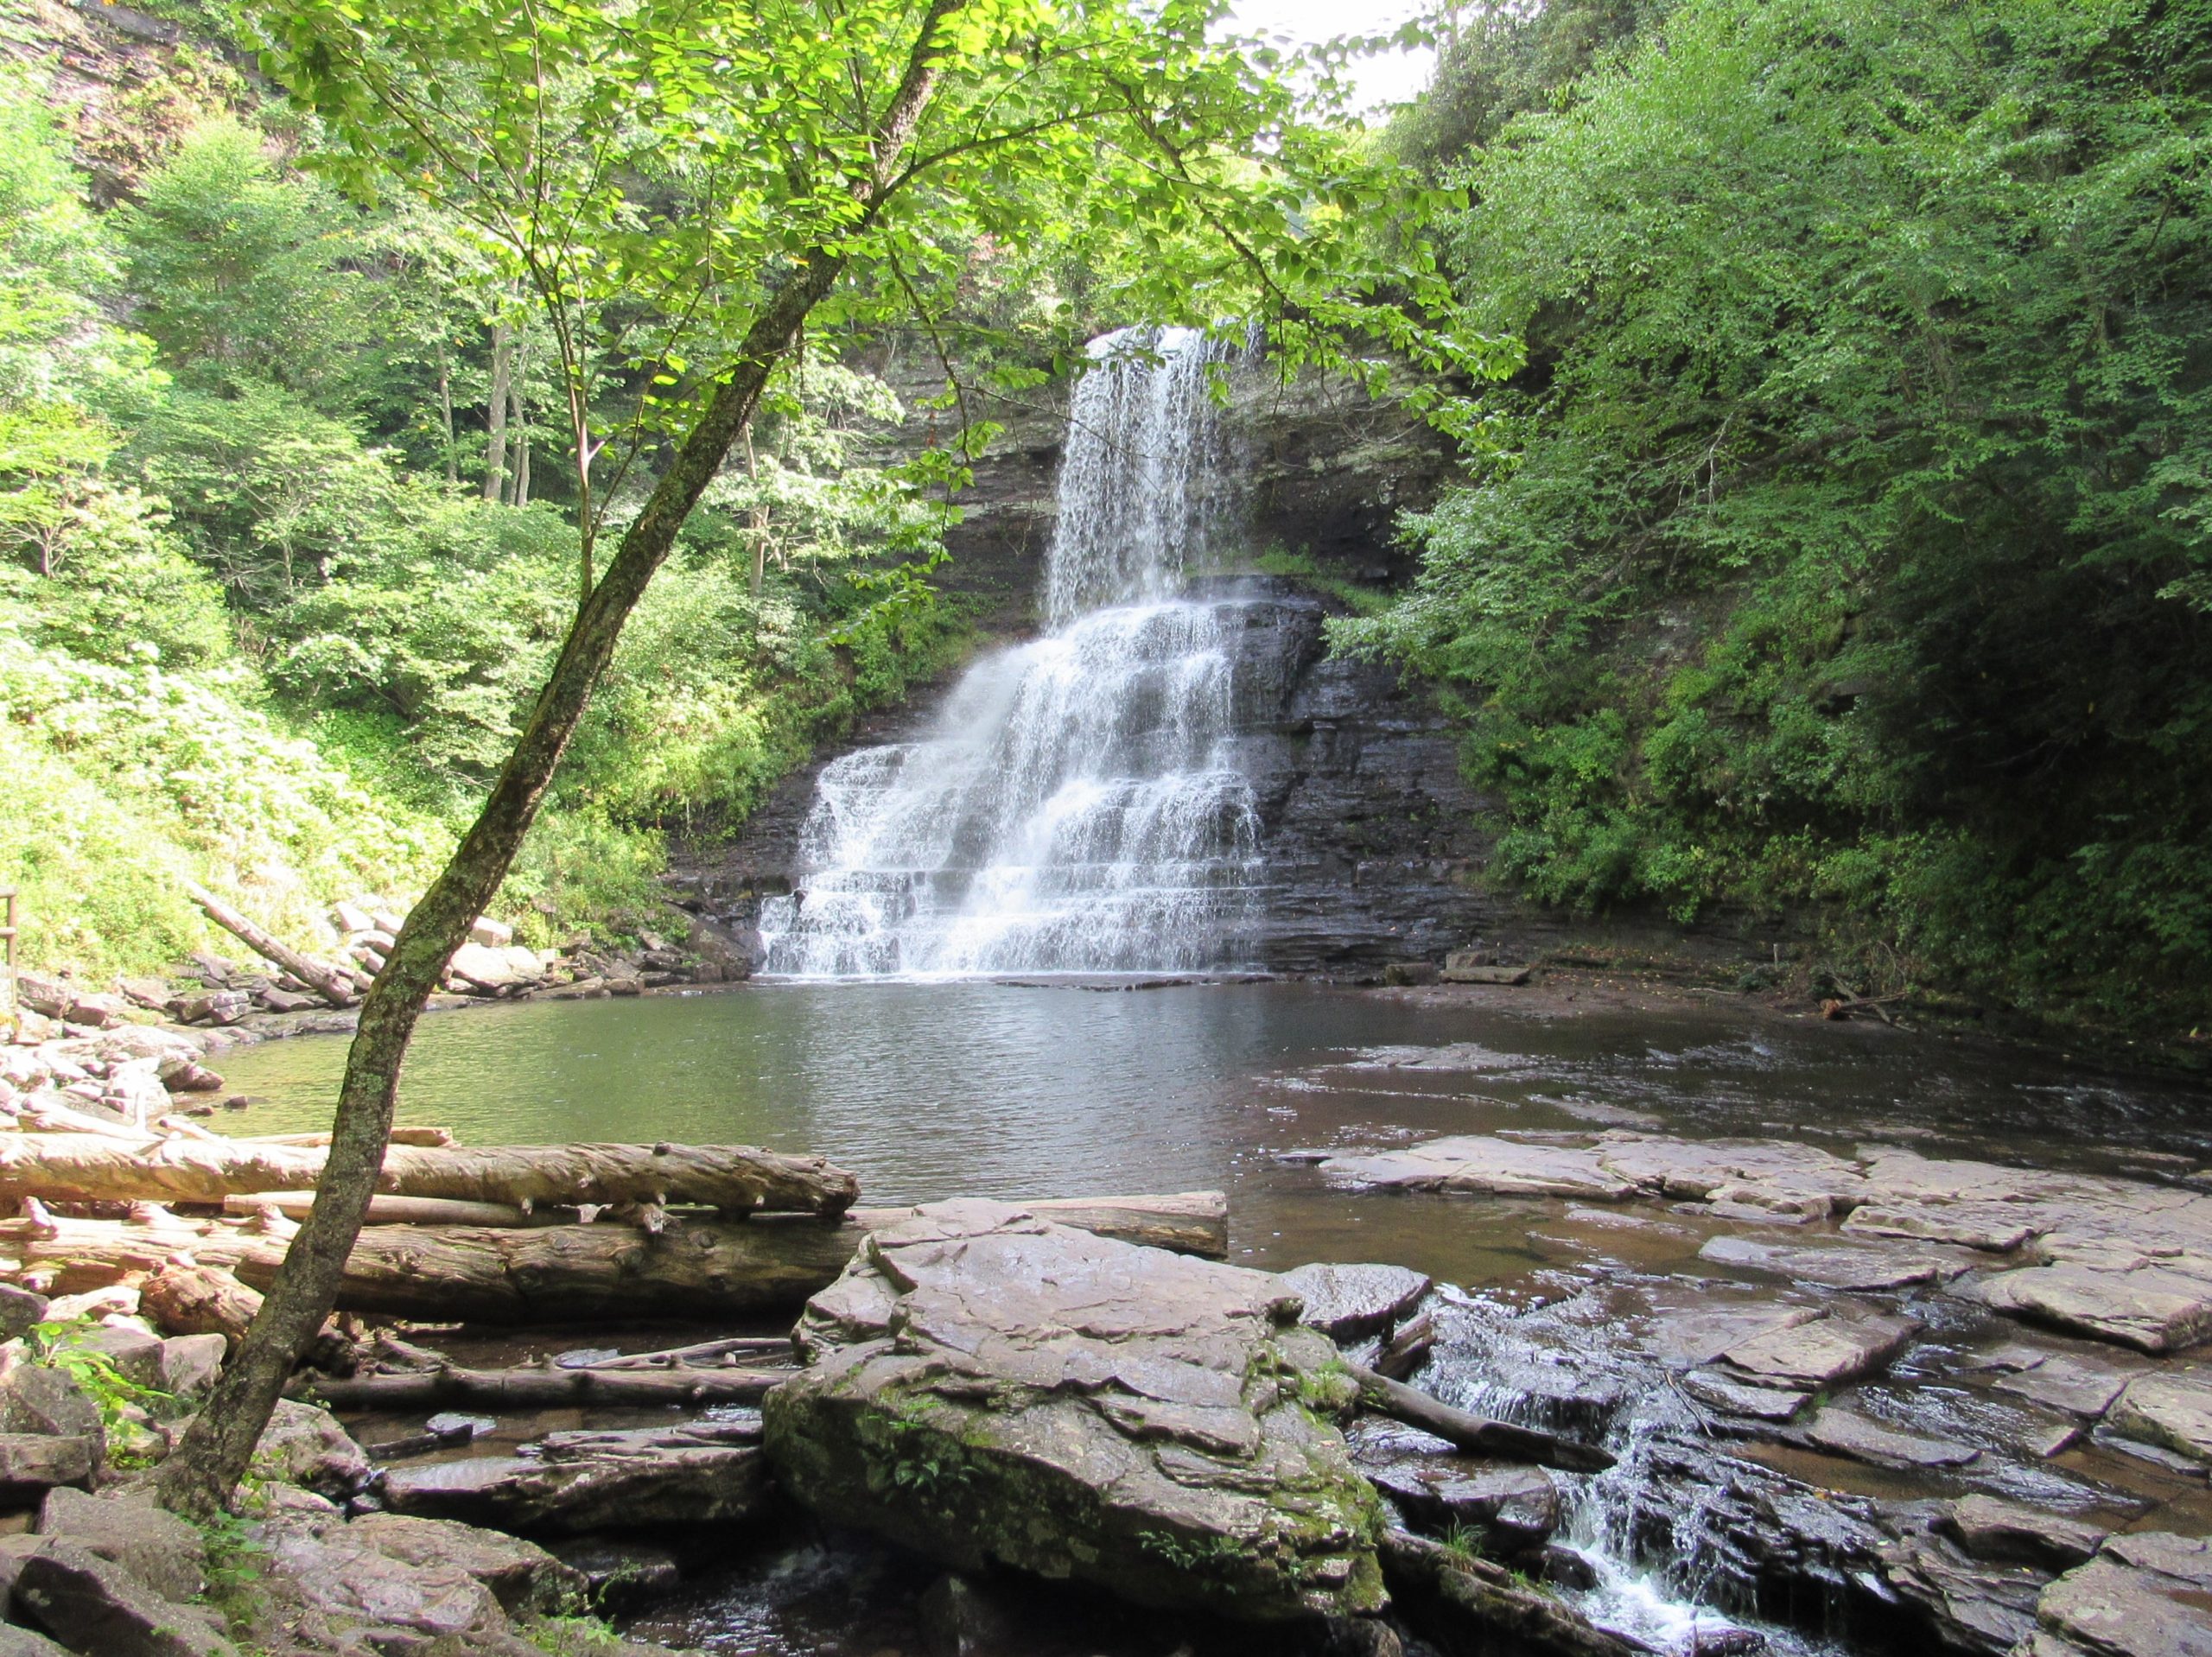
Figure 1.1: This is Cascade Falls in Pembroke, Virginia. An objective statement about this would be: “The picture is of a waterfall.” A subjective statement would be: “The setting is beautiful,” or “The waterfall is there because of erosion.” Figure description available at the end of the chapter.
Scientists seek to understand the fundamental principles that explain natural patterns and processes. Science is more than just a body of knowledge; science provides a means to evaluate and create new knowledge without bias. Scientists use objective evidence over subjective evidence to reach sound and logical conclusions.
An objectiveobservation is made without personal bias and will be the same for all individuals. Humans are biased by nature, so they cannot be completely objective; the goal is to be as unbiased as possible. A subjective observation is based on a person’s feelings and beliefs and is unique to that individual.
Another way scientists avoid bias is by using quantitative over qualitative measurements whenever possible. A quantitative measurement is expressed with a specific numerical value. Qualitative observations are general or relative descriptions. For example, describing a rock as red or heavy is a qualitative observation. Determining a rock’s color by measuring wavelengths of reflected light or the proportions of minerals it contains is quantitative. Numerical values are more precise than general descriptions, and they can be analyzed using statistical calculations. This is why quantitative measurements are much more useful to scientists than qualitative observations.
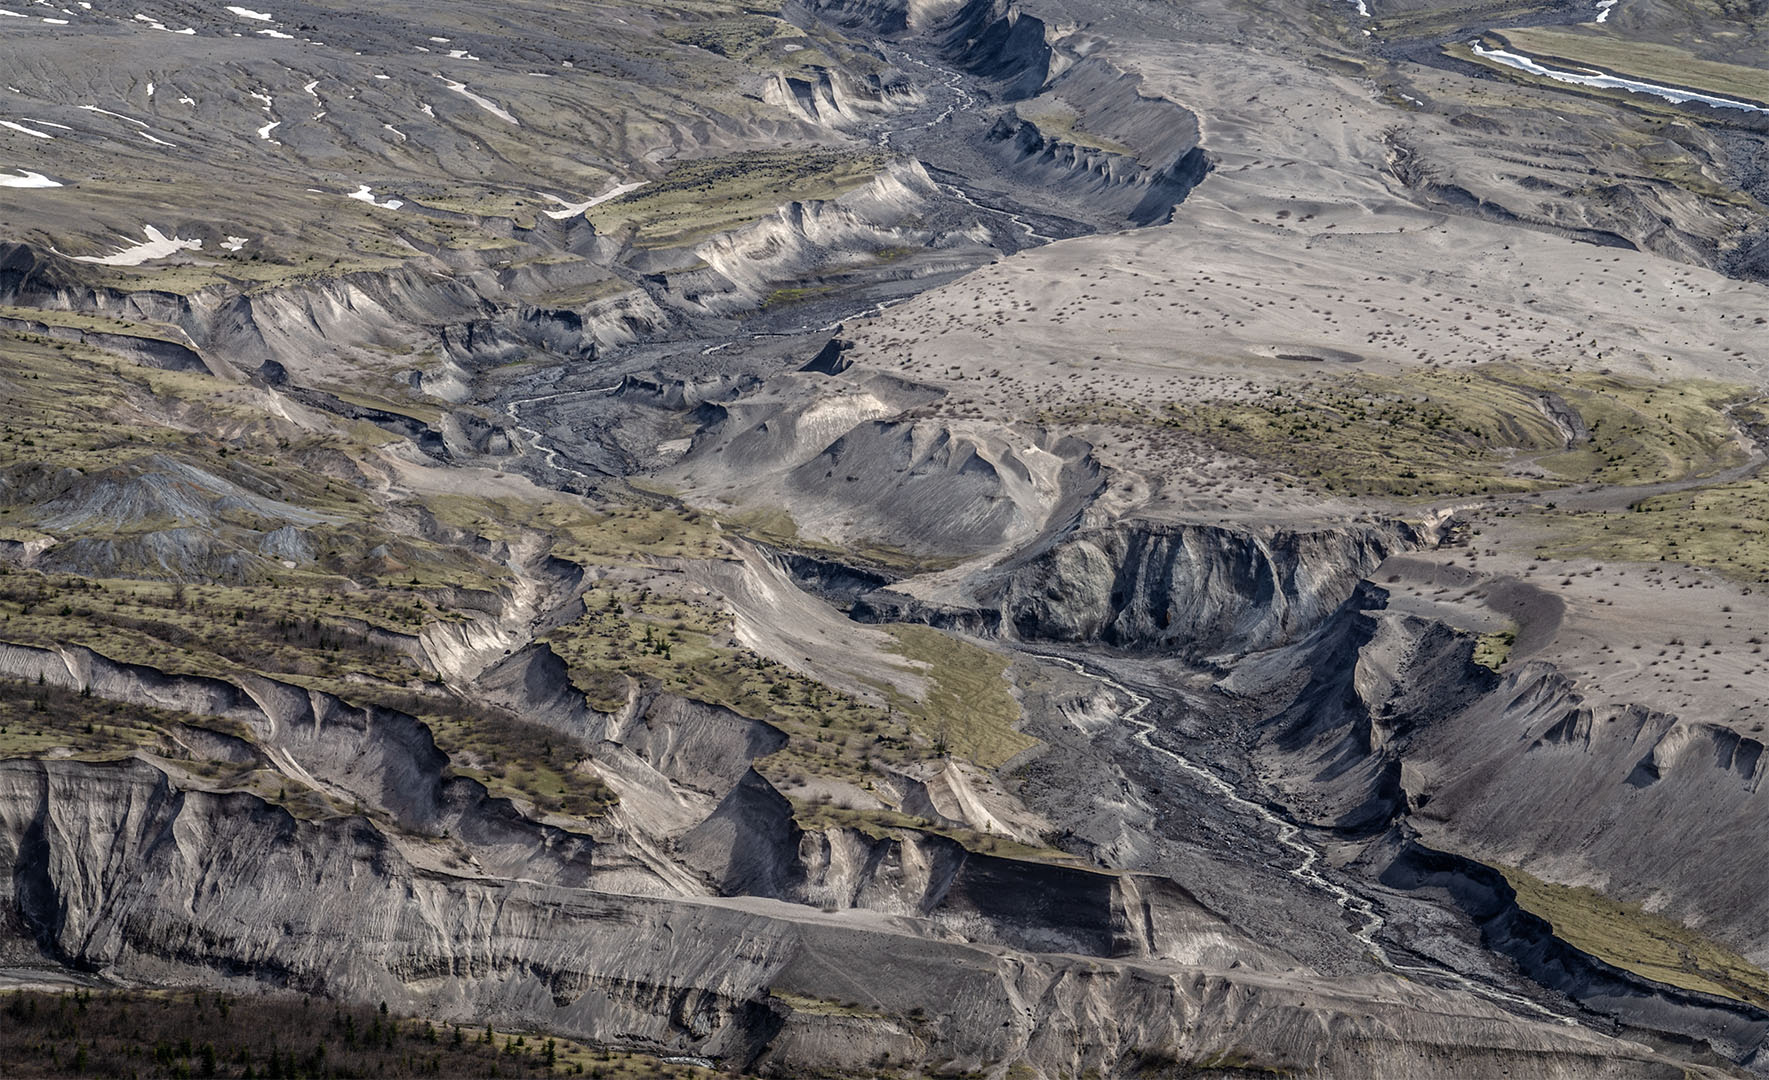
Figure 1.2: Canyons like this, carved in the deposit left by the May 18th, 1980, eruption of Mount St. Helens, are sometimes used by purveyors of pseudoscience as evidence for the Earth being very young. In reality, the unconsolidated and unlithified volcanic deposit is carved much more easily than other canyons like the Grand Canyon. Figure description available at the end of the chapter.
Establishing truth in science is difficult because all scientific claims are falsifiable, which means any initial hypothesis may be tested and proven false. A hypothesis can only become regarded as a reliable scientific theory after exhaustively eliminating false results, competing ideas, and possible variations. This meticulous scrutiny reveals weaknesses or flaws in a hypothesis and is the source of the strength that supports all scientific ideas and procedures. In fact, proving current ideas are wrong has been the driving force behind many scientific careers.
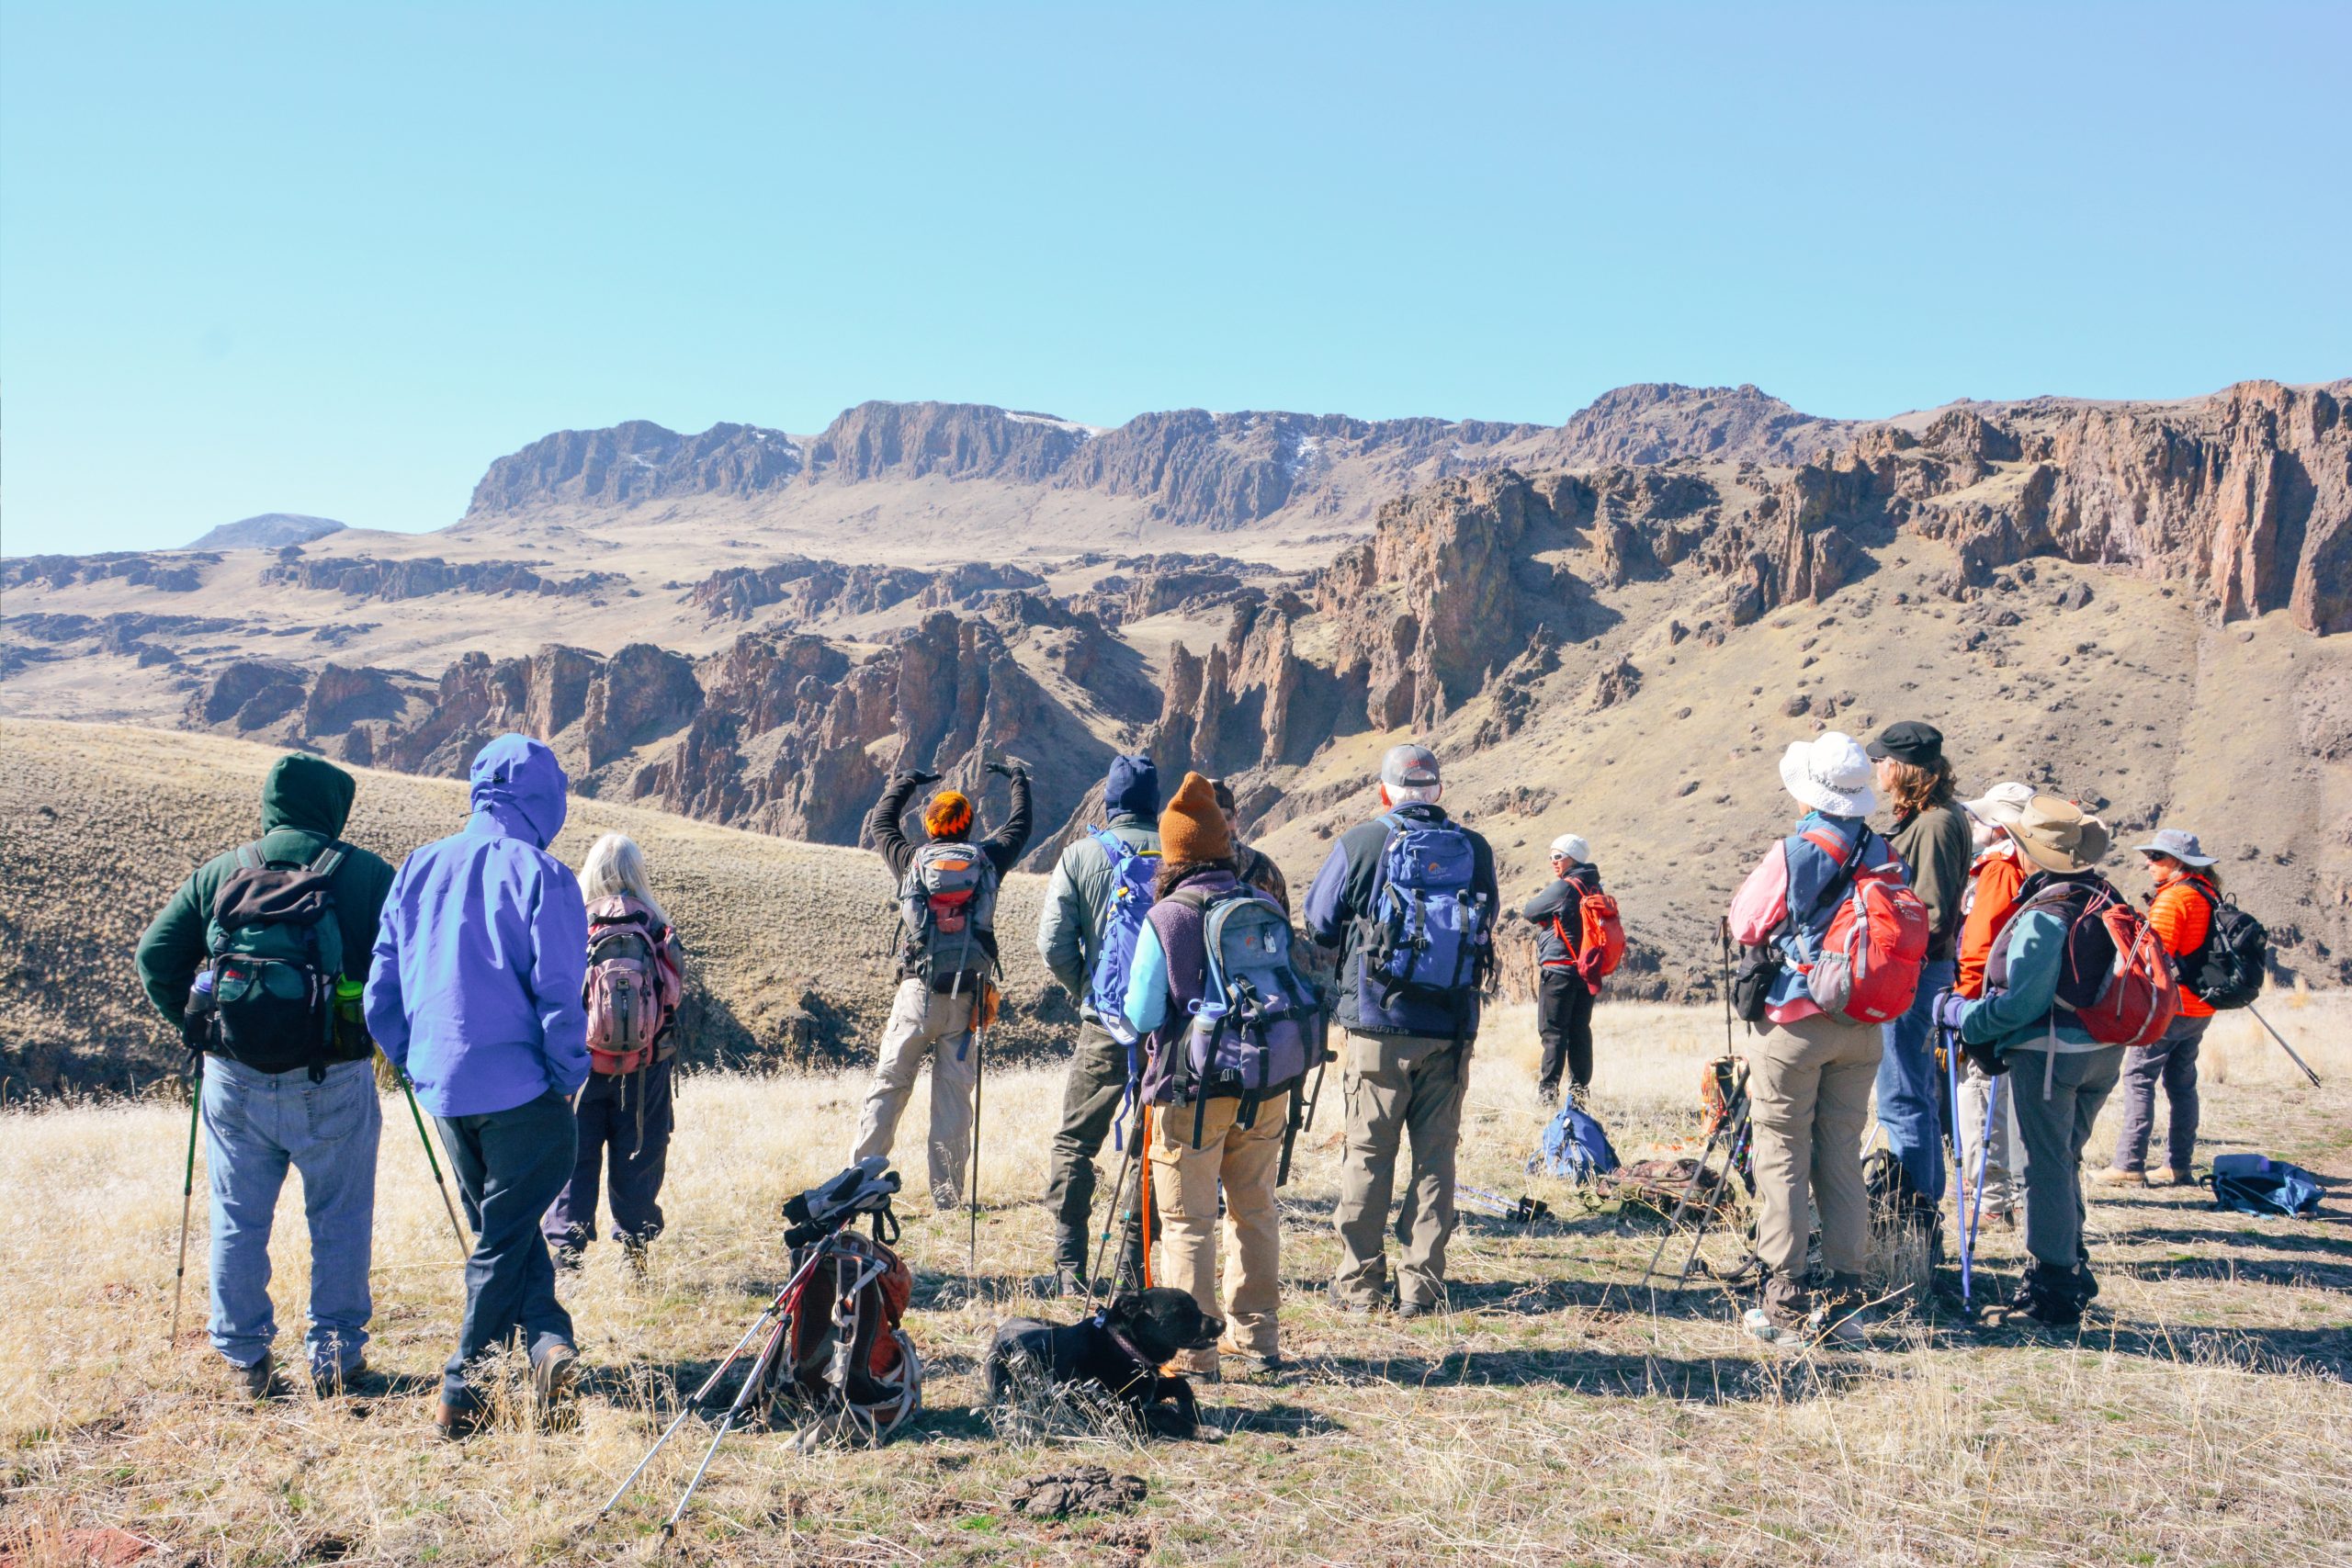
Figure 1.3: Geologists share information by publishing, attending conferences, and even going on field trips, such as this trip to the Lake Owyhee Volcanic Field in Oregon by the Bureau of Land Management in 2019. Figure description available at the end of the chapter.
Falsifiability separates science from pseudoscience. Scientists are wary of explanations of natural phenomena that discourage or avoid falsifiability. An explanation that cannot be tested or does not meet scientific standards is not considered science, but pseudoscience. Pseudoscience is a collection of ideas that may appear scientific but does not use the scientific method. Astrology is an example of pseudoscience. It is a belief system that attributes human behaviors to the movement of celestial bodies. Astrologers rely on celestial observations, but their conclusions are not based on experimental evidence and their statements are not falsifiable. Astrology should not be confused with astronomy, which is the scientific study of celestial bodies and the cosmos.
Science is also a social process. Scientists share their ideas with peers at conferences, seeking guidance and feedback. Research papers and data submitted for publication are rigorously reviewed by qualified peers, scientists who are experts in the same field. The scientific review process aims to weed out misinformation, invalid research results, and wild speculation. Thus, the process is slow, cautious, and conservative. Scientists tend to wait until a hypothesis is supported by an overwhelming amount of evidence from many independent researchers before accepting it as scientific theory.
Take this quiz to check your comprehension of this section.
If you are using an offline version of this text, access the quiz for Section 1.1 via the QR code.
1.2 The Scientific Method
Modern science is based on the scientific method, a procedure that follows these steps:
Formulate a question or observe a problem.
Apply objective experimentation and observation.
Analyze collected data and interpret results.
Devise an evidence-based theory.
Submit findings to peer review and/or publication.
This process has a long history in human thought but was first fully formed by Ibn al-Haytham over 1,000 years ago. At the forefront of the scientific method are conclusions based on objective evidence, not opinion or hearsay.
Step One: Observation, Problem, or Research Question
The procedure begins with identifying a problem or research question about, for instance, a geological phenomenon that is not well explained in the scientific community’s collective knowledge. This step usually involves reviewing the scientific literature to understand previous studies that may be related to the question.
Step Two: Hypothesis
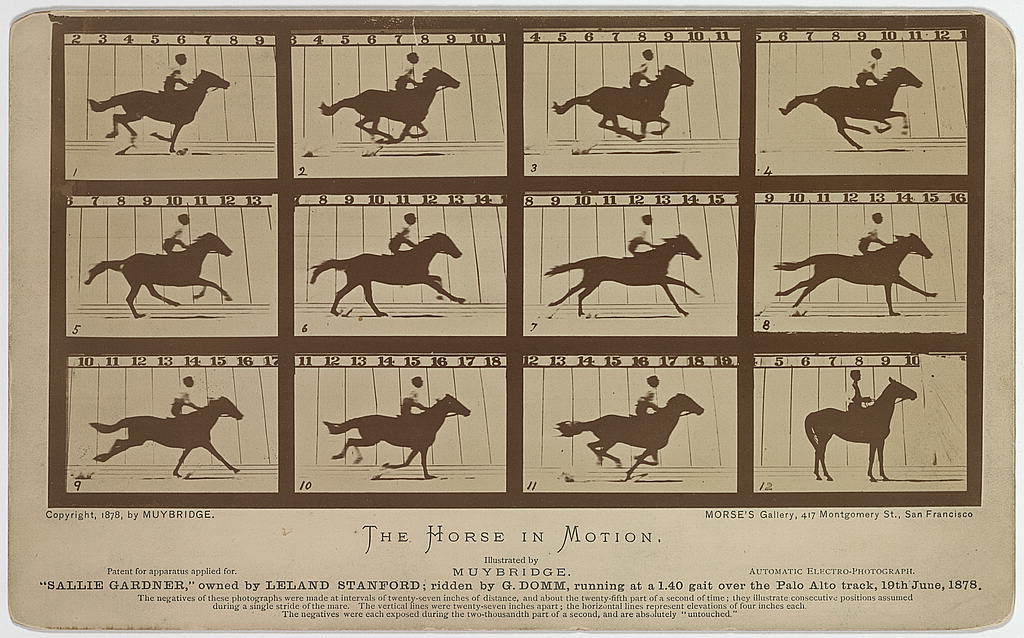
Figure 1.5: A famous hypothesis. Leland Stanford wanted to know if a horse lifted all four legs off the ground during a gallop, since the legs are too fast for the human eye to perceive. This series of photographs by Eadweard Muybridge proved the horse does, in fact, lift all four legs off the ground during the gallop. Figure description available at the end of the chapter.
Once the problem or question is well defined, the scientist proposes a possible answer, a hypothesis, before conducting an experiment or field work. This hypothesis must be specific and falsifiable, and should be based on other scientific work. Geologists often develop multiple working hypotheses because they usually cannot impose strict experimental controls or have limited opportunities to visit a field location.
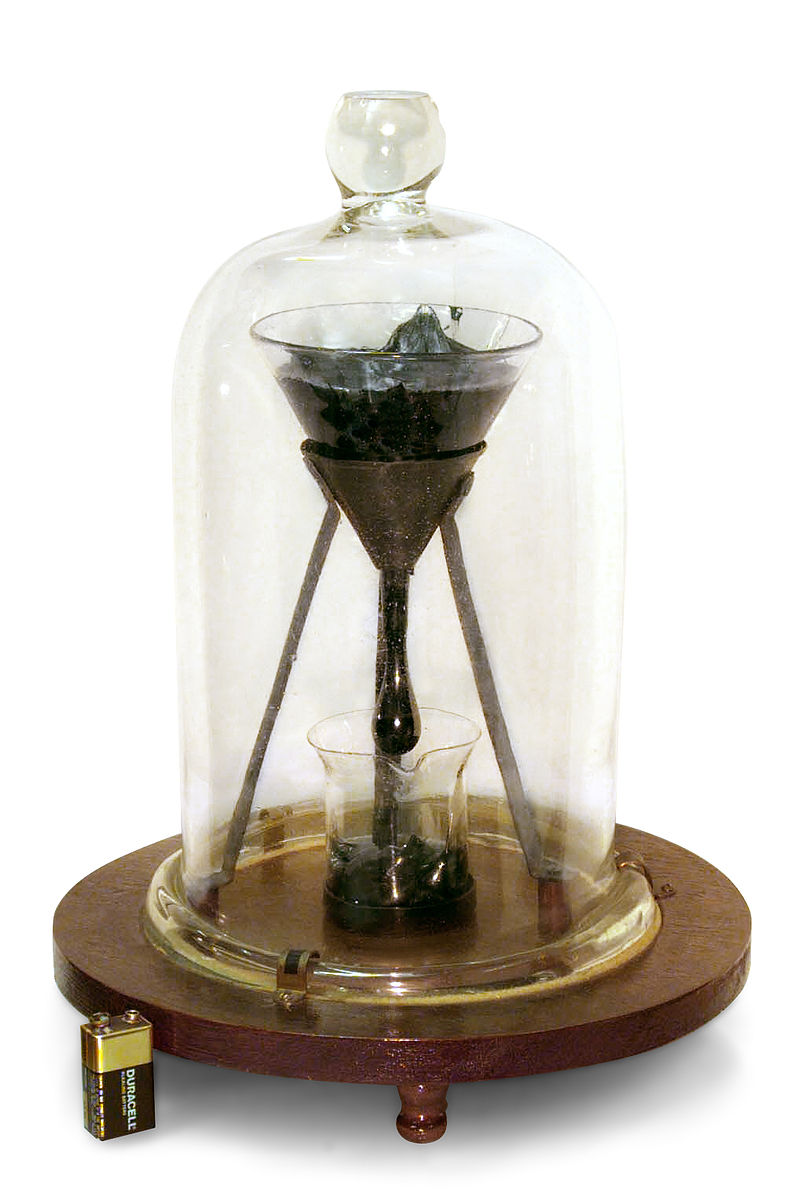
Figure 1.6: An experiment at the University of Queensland has been ongoing since 1927. A petroleum product called pitch, which is highly viscous, drips out of a funnel about once per decade. Figure description available at the end of the chapter.
Step Three: Experiment and Hypothesis Revision
The next step is developing an experiment that either supports or refutes the hypothesis. Many people mistakenly think experiments are only done in labs; however, an experiment can simply involve observing natural processes in the field. Regardless of what form an experiment takes, it always includes the systematic gathering of objective data. This data is interpreted to determine whether it contradicts or supports the hypothesis, which may be revised and tested again. When a hypothesis holds up under experimentation, it is ready to be shared with other experts in the field.
Step Four: Peer Review, Publication, and Replication
Scientists share the results of their research by publishing articles in scientific journals, such as Science and Nature. Reputable journals and publishing houses will not publish an experimental study until they have determined its methods are scientifically rigorous and the conclusions are supported by evidence. Before an article is published, it undergoes a rigorous peer review by scientific experts who scrutinize the methods, results, and discussion. Once an article is published, other scientists may attempt to replicate the results. This replication is necessary to confirm the reliability of the study’s reported results. A hypothesis that seemed compelling in one study might be proven false in studies conducted by other scientists. New technology can be applied to published studies, which can aid in confirming or rejecting once-accepted ideas and/or hypotheses.
In casual conversation, the word theory implies guesswork or speculation. In the language of science, an explanation or conclusion made in a theory carries much more weight because it is supported by experimental verification and widely accepted by the scientific community. After a hypothesis has been repeatedly tested for falsifiability through documented and independent studies, it eventually becomes accepted as a scientific theory.
While a hypothesis provides a tentative explanation before an experiment, a theory is the best explanation after confirmation from multiple independent experiments. Confirmation of a theory may take years or even longer. For example, the continental drift hypothesis first proposed by Alfred Wegener in 1912 was initially dismissed; after decades of additional evidence collection by other scientists using more advanced technology, Wegener’s hypothesis was accepted and revised as the theory of plate tectonics.
The theory of evolution by natural selection is another example. Originating from the work of Charles Darwin in the mid-nineteenth century, the theory of evolution has withstood generations of scientific testing for falsifiability. While it has been updated and revised to accommodate knowledge gained by using modern technologies, the theory of evolution continues to be supported by the latest evidence.
Take this quiz to check your comprehension of this section.
If you are using an offline version of this text, access the quiz for Section 1.2 via the QR code.
Western scientific thought began in the ancient city of Athens, Greece. Athens was governed as a democracy, which encouraged individuals to think independently at a time when most civilizations were ruled by monarchies or military conquerors. Foremost among the early philosopher-scientists to use empirical thinking was Aristotle, born in 384 BCE. Empiricism emphasizes the value of evidence gained from experimentation and observation. Aristotle studied under Plato and tutored Alexander the Great. Alexander would later conquer the Persian Empire and, in the process, spread Greek culture as far east as India.
Aristotle applied an empirical method of analysis called deductive reasoning, which applies known principles of thought to establish new ideas or predict new outcomes. Deductive reasoning starts with generalized principles and logically extends them to new ideas or specific conclusions. If the initial principle is valid, then it is highly likely the conclusion is also valid. An example of deductive reasoning is “if A = B and B = C, then A = C”. Another example is “if all birds have feathers and a sparrow is a bird, then a sparrow must also have feathers.” The problem with deductive reasoning is, if the initial principle is flawed, the conclusion will inherit that flaw. Here is an example of a flawed initial principle leading to the wrong conclusion: if all animals that fly are birds and bats also fly, then bats must also be birds.
This type of empirical thinking contrasts with inductive reasoning, which begins from new observations and attempts to discern underlying generalized principles. A conclusion made through inductive reasoning comes from analyzing measurable evidence rather making a logical connection. For example, to determine whether bats are birds, a scientist might list various characteristics observed in birds (i.e., the presence of feathers, a toothless beak, hollow bones, lack of forelegs, and externally laid eggs); next, the scientist would check whether bats share the same characteristics and, if they do not, draw the conclusion that bats are not birds.
Both types of reasoning are important in science because they emphasize the two most important aspects of science: observation and inference. Scientists test existing principles to see if they accurately infer or predict their observations. They also analyze new observations to determine if the inferred underlying principles still support them.
Greek culture was spread by Alexander and then absorbed by the Romans, who further extended Greek knowledge into Europe through their vast infrastructure of roads, bridges, and aqueducts. After the fall of the Roman Empire in 476 CE, scientific progress in Europe stalled. Scientific thinkers of the medieval period that followed had such high regard for Aristotle’s wisdom and knowledge that they faithfully followed his logical approach to understanding nature for centuries. By contrast, science in the Middle East progressed and flourished between 800 and 1450 CE, along with culture and the arts.
Near the end of the medieval period, empirical experimentation became more common in Europe. During the Renaissance, which lasted from the fourteenth through seventeenth centuries, artistic and scientific thought experienced a great awakening. European scholars began to criticize the traditional Aristotelian approach, and by the end of the Renaissance period, empiricism was poised to become a key component of the Scientific Revolution that would arise in the seventeenth century.
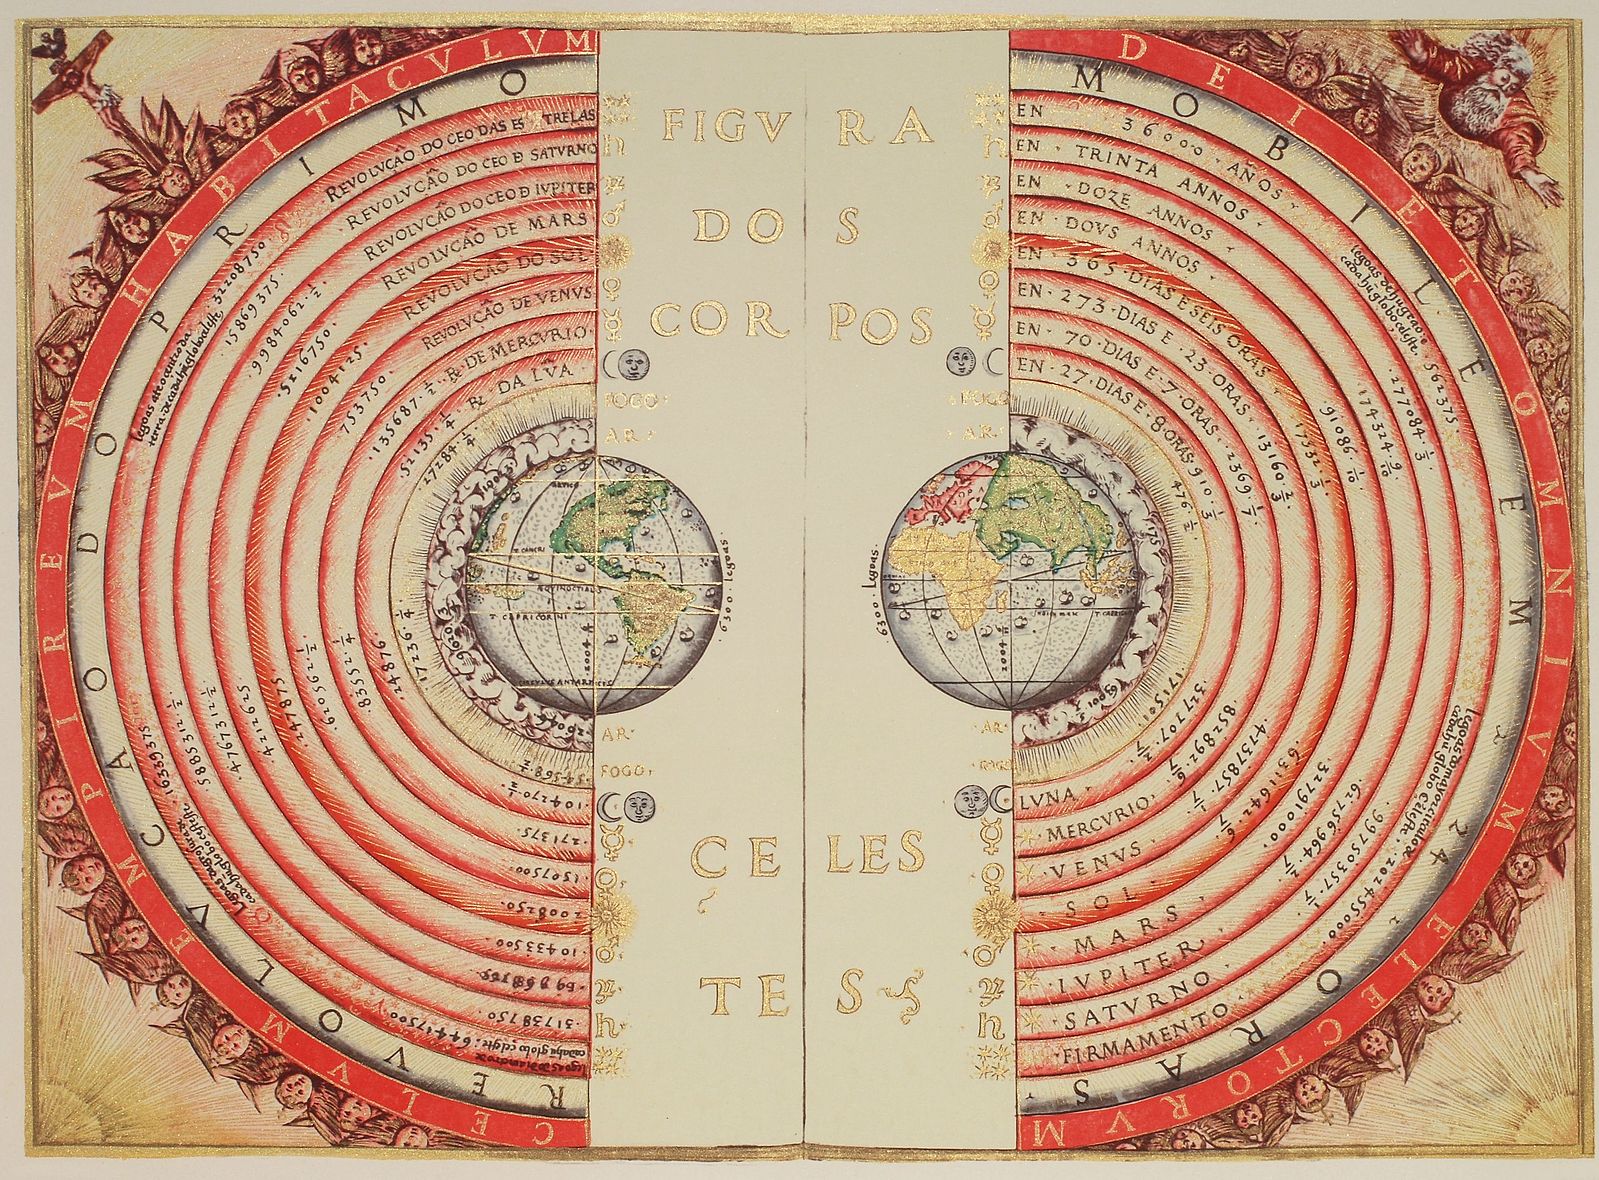
An early example of how Renaissance scientists began to apply a modern empirical approach is their study of the Solar System. In the second century, the Greek astronomer Claudius Ptolemy observed the Sun, Moon, and stars moving across the sky. Applying Aristotelian logic to his astronomical calculations, he deductively reasoned all celestial bodies orbited around the Earth, which was thought to be located at the center of the universe. Ptolemy was a highly regarded mathematician, and his mathematical calculations were widely accepted by the scientific community. The view of the cosmos with Earth at its center is called the geocentric model. This geocentric model persisted until the Renaissance period, when some revolutionary thinkers challenged the centuries-old hypothesis.
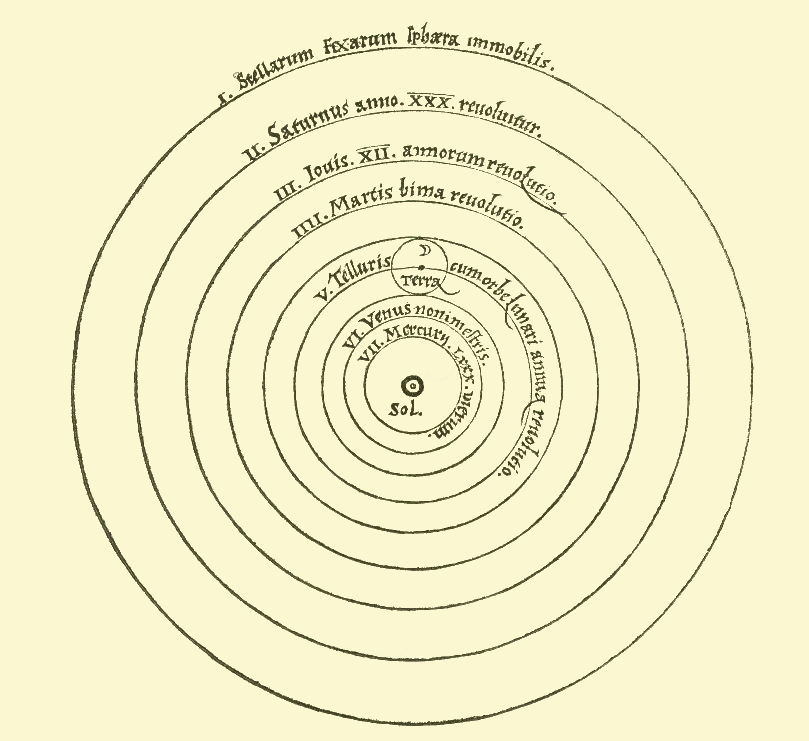
By contrast, early Renaissance scholars such as astronomer Nicolaus Copernicus (1473-1543) proposed an alternative explanation for the perceived movement of the Sun, Moon, and stars. Sometime between 1507 and 1515, he provided credible mathematical proof for a radically new model of the cosmos, one in which the Earth and other planets orbited around a centrally located Sun. After the invention of the telescope in 1608, scientists used their enhanced astronomical observations to support this heliocentric, Sun-centered model.
Two scientists, Johannes Kepler and Galileo Galilei, are credited with jump-starting the scientific revolution. They accomplished this by building on Copernicus’s work and challenging long-established ideas about nature and science.
Johannes Kepler (1571–1630) was a German mathematician and astronomer who expanded on the heliocentric model, improving Copernicus’s original calculations and describing planetary motion as elliptical paths. Galileo Galilei (1564–1642) was an Italian astronomer who used the newly developed telescope to observe the four largest moons of Jupiter. This was the first piece of direct evidence to contradict the geocentric model, since moons orbiting Jupiter could not also be orbiting Earth.
Galileo strongly supported the heliocentric model and attacked the geocentric model, arguing for a more scientific approach to determine the credibility of ideas. Because of this, he found himself at odds with prevailing scientific views and the Catholic Church. In 1633, he was found guilty of heresy and placed under house arrest, where he would remain until his death in 1642.
Galileo is regarded as the first modern scientist because he conducted experiments that would prove or disprove falsifiable ideas and based his conclusions on mathematical analysis of quantifiable evidence—a radical departure from the deductive thinking of Greek philosophers such as Aristotle. His methods marked the beginning of a major shift in how scientists studied the natural world, with an increasing number relying on evidence and experimentation to form their hypotheses. It was during this revolutionary time that geologists such as James Hutton and Nicolas Steno also made great advances in their scientific fields of study.
Take this quiz to check your comprehension of this section.
If you are using an offline version of this text, access the quiz for Section 1.3 via the QR code.
As part of the Scientific Revolution in Europe, modern geologic principles developed in the 17th and 18th centuries. One major contributor was Nicolaus Steno (1638–1686), a Danish priest who studied anatomy and geology. Steno was the first to propose that Earth’s surface could change over time. He suggested sedimentary rocks, such as sandstone and shale, originally formed in horizontal layers with the oldest on the bottom and progressively younger layers on top.
In the eighteenth century, Scottish naturalist James Hutton (1726–1797) studied rivers and coastlines and compared the sediments they left behind to exposed sedimentary rock strata. He hypothesized the ancient rocks must have been formed by processes like those producing the features in oceans and streams. Hutton also proposed the Earth was much older than previously thought. Modern geologic processes operate slowly; Hutton realized that, if these processes formed rocks, then the Earth must be very old, possibly hundreds of millions of years old.
Hutton’s idea is called the principle of uniformitarianism and states that natural processes operate the same now as in the past, i.e., the laws of nature are uniform across space and time. Geologist often state “the present is the key to the past,” meaning they can understand ancient rocks by studying modern geologic processes.
Prior to the acceptance of uniformitarianism, scientists such as German geologist Abraham Gottlob Werner (1750–1817) and French anatomist Georges Cuvier (1769–1832) thought rocks and landforms were formed by great catastrophic events. Cuvier championed this view, known as catastrophism, and stated, “The thread of operation is broken; nature has changed course, and none of the agents she employs today would have been sufficient to produce her former works.” He meant processes that operate today did not operate in the past. Known as the father of vertebrate paleontology, Cuvier made significant contributions to the study of ancient life and taught at Paris’s Museum of Natural History. Based on his study of large vertebrate fossils, he was the first to suggest species could go extinct. However, he thought new species were introduced by special creation after catastrophic floods.
Hutton’s ideas about uniformitarianism and Earth’s age were not well received by the scientific community of his time. His ideas were falling into obscurity when Charles Lyell, a British lawyer and geologist (1797–1875), wrote Principles of Geology in the early 1830s and later, Elements of Geology. Lyell’s books promoted Hutton’s principle of uniformitarianism, his studies of rocks and the processes that formed them, and the idea that Earth was possibly over 300 million years old. Lyell and his three-volume Principles of Geology had a lasting influence on the geologic community and public at large, who eventually accepted uniformitarianism and Earth being millions of years old. The principle of uniformitarianism became so widely accepted that geologists regarded catastrophic change as heresy. This made it harder for ideas like the sudden demise of the dinosaurs by asteroid impact to gain traction.
A contemporary of Lyell, Charles Darwin (1809–1882) took Principles of Geology on his five-year trip on the HMS Beagle. Darwin used uniformitarianism and deep geologic time to develop his initial ideas about evolution. Lyell was one of the first to publish a reference to Darwin’s idea of evolution.
The next big advancement, and perhaps the largest in the history of geology, is the theory of plate tectonics and continental drift. Dogmatic acceptance of uniformitarianism inhibited the progress of this idea, mainly because of the permanency placed on the continents and their positions. Ironically, slow and steady movement of plates would fit well into a uniformitarianist model. However, much time passed and a great deal of scientific resistance had to be overcome before the idea took hold. This delay happened for several reasons. Firstly, the movement was so slow, it was overlooked. Secondly, the best evidence was hidden under the ocean. Finally, the accepted theories were anchored by a large amount of inertia. Instead of being bias-free, scientists resisted and ridiculed the emerging idea of plate tectonics. This example of dogmatic thinking remains, to this day, a tarnish on the geoscience community.
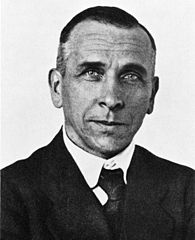
Plate tectonics is most commonly attributed to Alfred Wegener, the first scientist to compile a large data set supporting the idea of continents shifting places over time. He was mostly ignored and ridiculed for his ideas, but later contributors like Marie Tharp, Bruce Heezen, Harry Hess, Laurence Morley, Frederick Vine, Drummond Matthews, Kiyoo Wadati, Hugo Benioff, Robert Coats, and J. Tuzo Wilson benefited from advances in subsea technologies. They discovered, described, and analyzed new features like the mid-ocean ridge, alignment of earthquakes, and magnetic striping. Gradually, these scientists introduced a paradigm shift that revolutionized geology into the science we know today.
Take this quiz to check your comprehension of this section.
If you are using an offline version of this text, access the quiz for Section 1.4 via the QR code.
Geologists apply the scientific method to learn about Earth’s materials and processes. Geology plays an important role in society, as its principles are essential to locating, extracting, and managing natural resources; evaluating environmental impacts of using or extracting these resources; as well as understanding and mitigating the effects of natural hazards.
Geology often applies information from physics and chemistry to understand parts of the natural world, like the physical forces in a landslide or the chemical interaction between water and rocks. The term comes from the Greek word geo, meaning Earth, and logos, meaning to think or reckon with.
1.5.1 Why Study Geology?
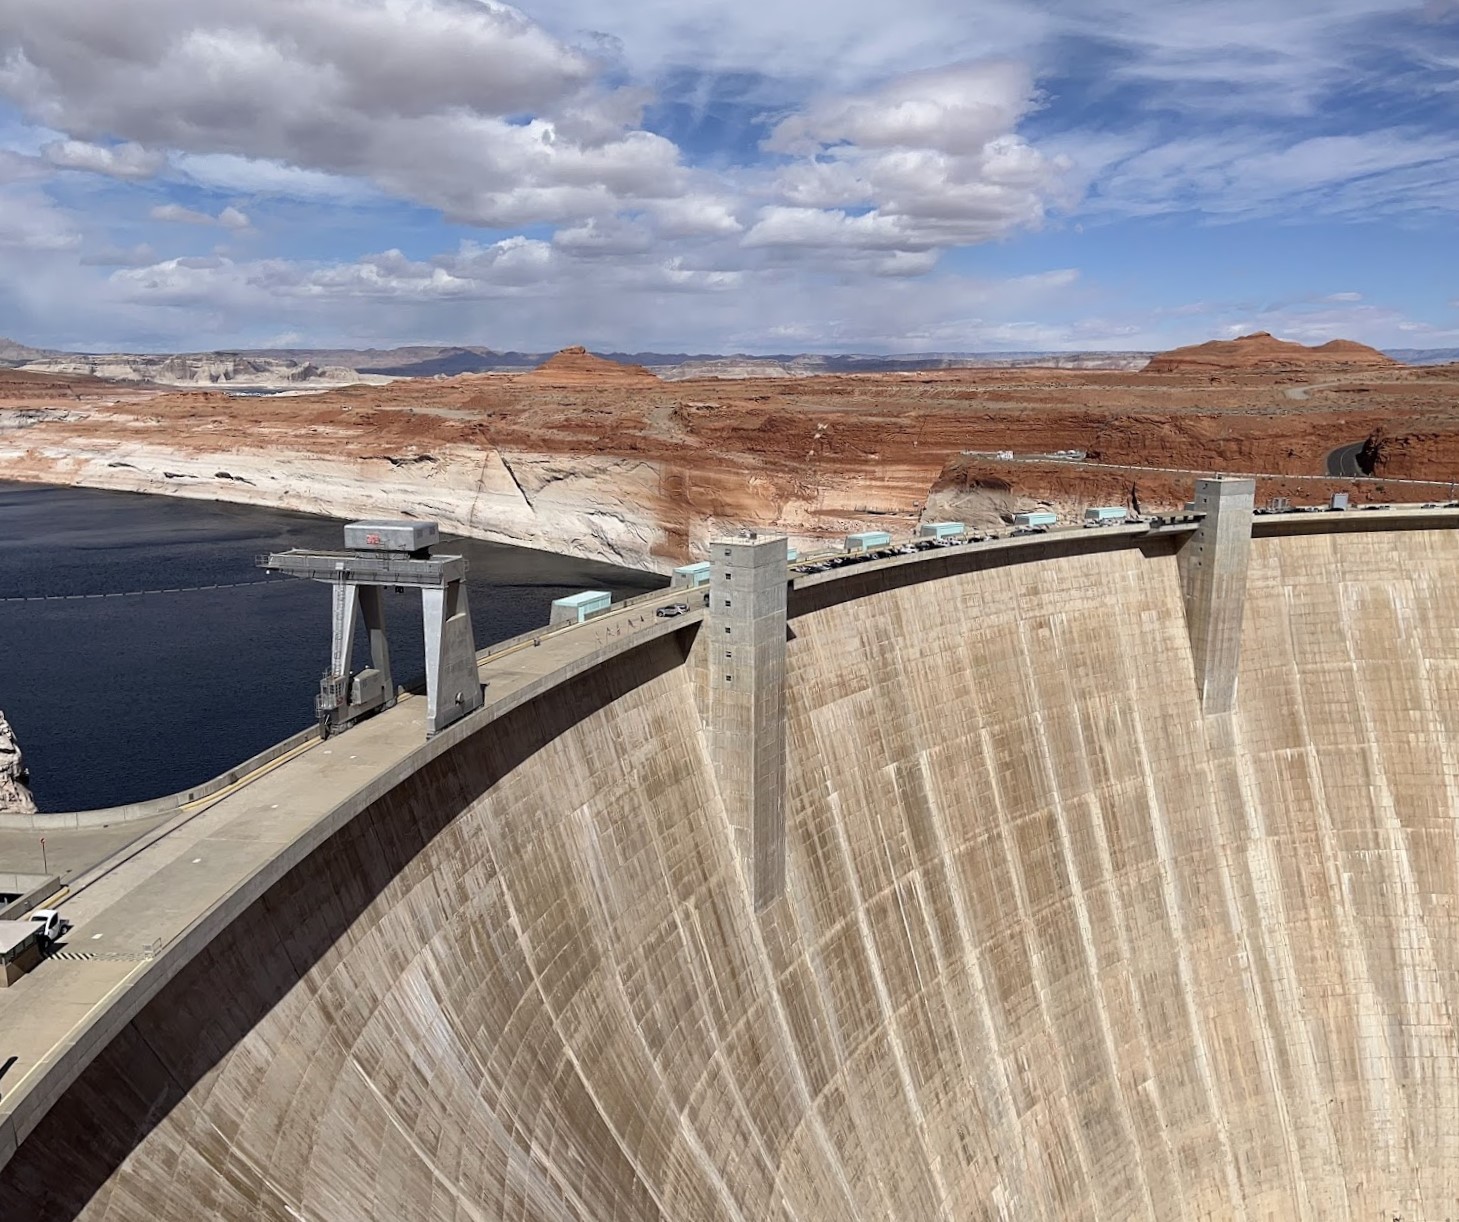
Figure 1.18: Glen Canyon Dam in the Southwestern United States forms Lake Powell, a reservoir on the Colorado River in Utah and Arizona. The dam also provides hydroelectric energy. Figure description available at the end of the chapter.
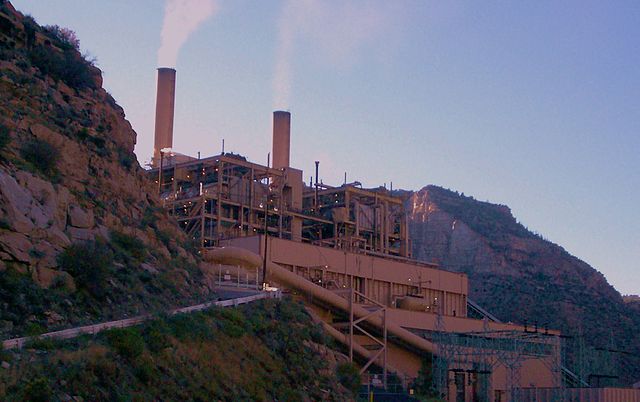
Geology plays a key role in how we use natural resources—any naturally occurring material that can be extracted from the Earth for economic gain. Our developed modern society, like all societies before it, is dependent on geologic resources. Geologists are involved in extracting fossil fuels, such as coal and petroleum; metals, such as copper, aluminum, and iron; and water resources in streams and underground reservoirs inside soil and rocks. They can help conserve our planet’s finite supply of nonrenewable resources, like petroleum, which are fixed in quantity and depleted by consumption. Geologists can also help manage renewable resources that can be replaced or regenerated, such as solar energy, wind energy, and timber.
Resource extraction and usage impacts our environment, which can negatively affect human health. For example, burning fossil fuels releases chemicals into the air that are unhealthy for humans, especially children. Mining activities can release toxic heavy metals, such as lead and mercury, into the soil and waterways. Our choices will have an effect on Earth’s environment for the foreseeable future. Understanding the remaining quantity, extractability, and renewability of geologic resources will help us manage those resources more sustainably.
Geologists also study natural hazards created by geologic processes. Natural hazards are phenomena that are potentially dangerous to human life or property. No place on Earth is completely free of natural hazards, so one of the best ways people can protect themselves is by understanding geology. Geology can teach people about the natural hazards in an area and how to prepare for them. Geologic hazards include landslides, earthquakes, tsunamis, floods, volcanic eruptions, and sea-level rise.
Finally, geology is where other scientific disciplines intersect in the concept known as Earth system science. In science, a system is a group of interactive objects and processes. Earth system science views the entire planet as a combination of systems that interact with each other via complex relationships. This geology textbook provides an introduction to science in general and will often reference other scientific disciplines.
Earth system science includes five basic systems (or spheres): the geosphere (the solid body of the Earth), the atmosphere (the gas envelope surrounding the Earth), the hydrosphere (water in all its forms at and near the surface of the Earth), the cryosphere (the frozen water part of Earth), and the biosphere (life on Earth in all its forms and interactions, including humankind).
Rather than viewing geology as an isolated system, Earth system scientists study how geologic processes shape not only the world but all the spheres it contains. They study how these multidisciplinary spheres relate, interact, and change in response to natural cycles and human-driven forces. They use elements from physics, chemistry, biology, meteorology, environmental science, zoology, hydrology, and many other sciences.
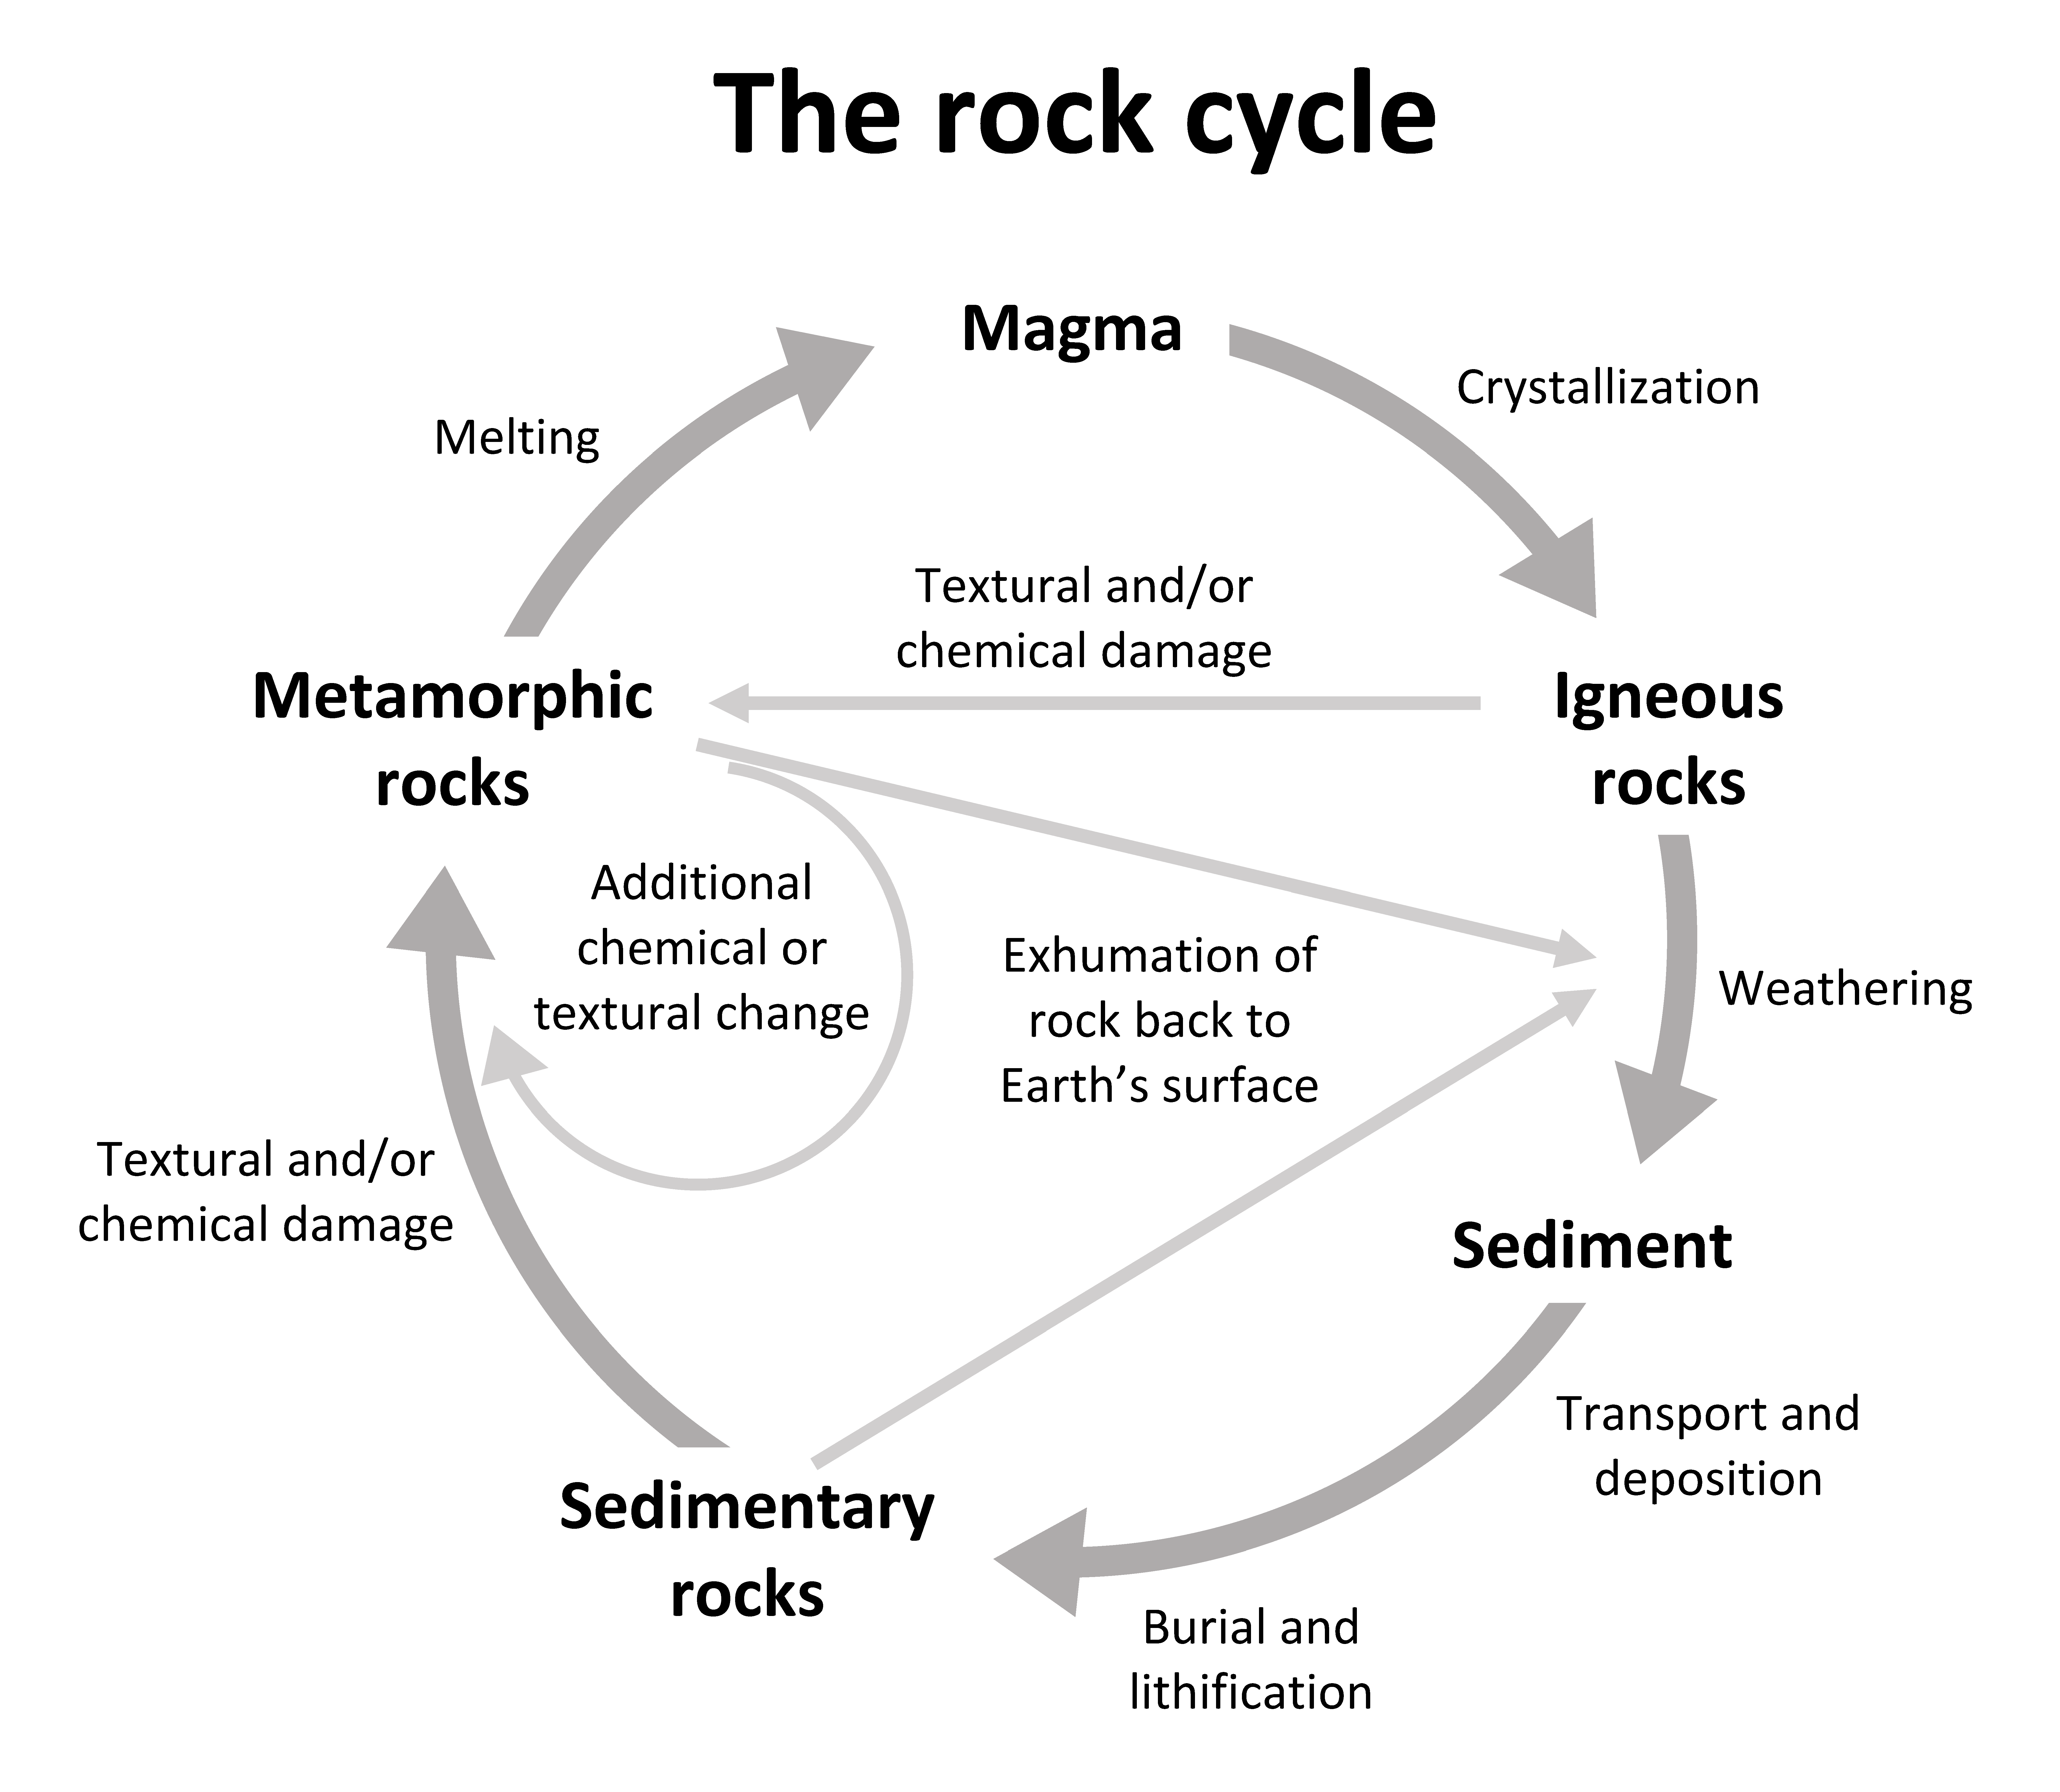
The most fundamental view of Earth materials is the rock cycle, which describes the major materials that comprise the Earth, the processes that form them, and how they relate to each other. It usually begins with hot molten liquid rock called magma or lava. Magma forms under the Earth’s surface in the crust or mantle. Lava is molten rock that erupts onto the Earth’s surface. When magma or lava cools, it solidifies by a process called crystallization in which minerals grow within the magma or lava. The resulting rocks are igneous rocks (ignis is Latin for “fire”).
Igneous rocks, as well as other types of rocks, on Earth’s surface are exposed to weathering and erosion, which produce sediments. Weathering is the physical and chemical breakdown of rocks into smaller fragments. Erosion is the removal of those fragments from their original location. The broken-down and transported fragments and grains are considered sediments, which include gravel, sand, silt, and clay. These sediments may be transported by streams and rivers, ocean currents, glaciers, and wind.
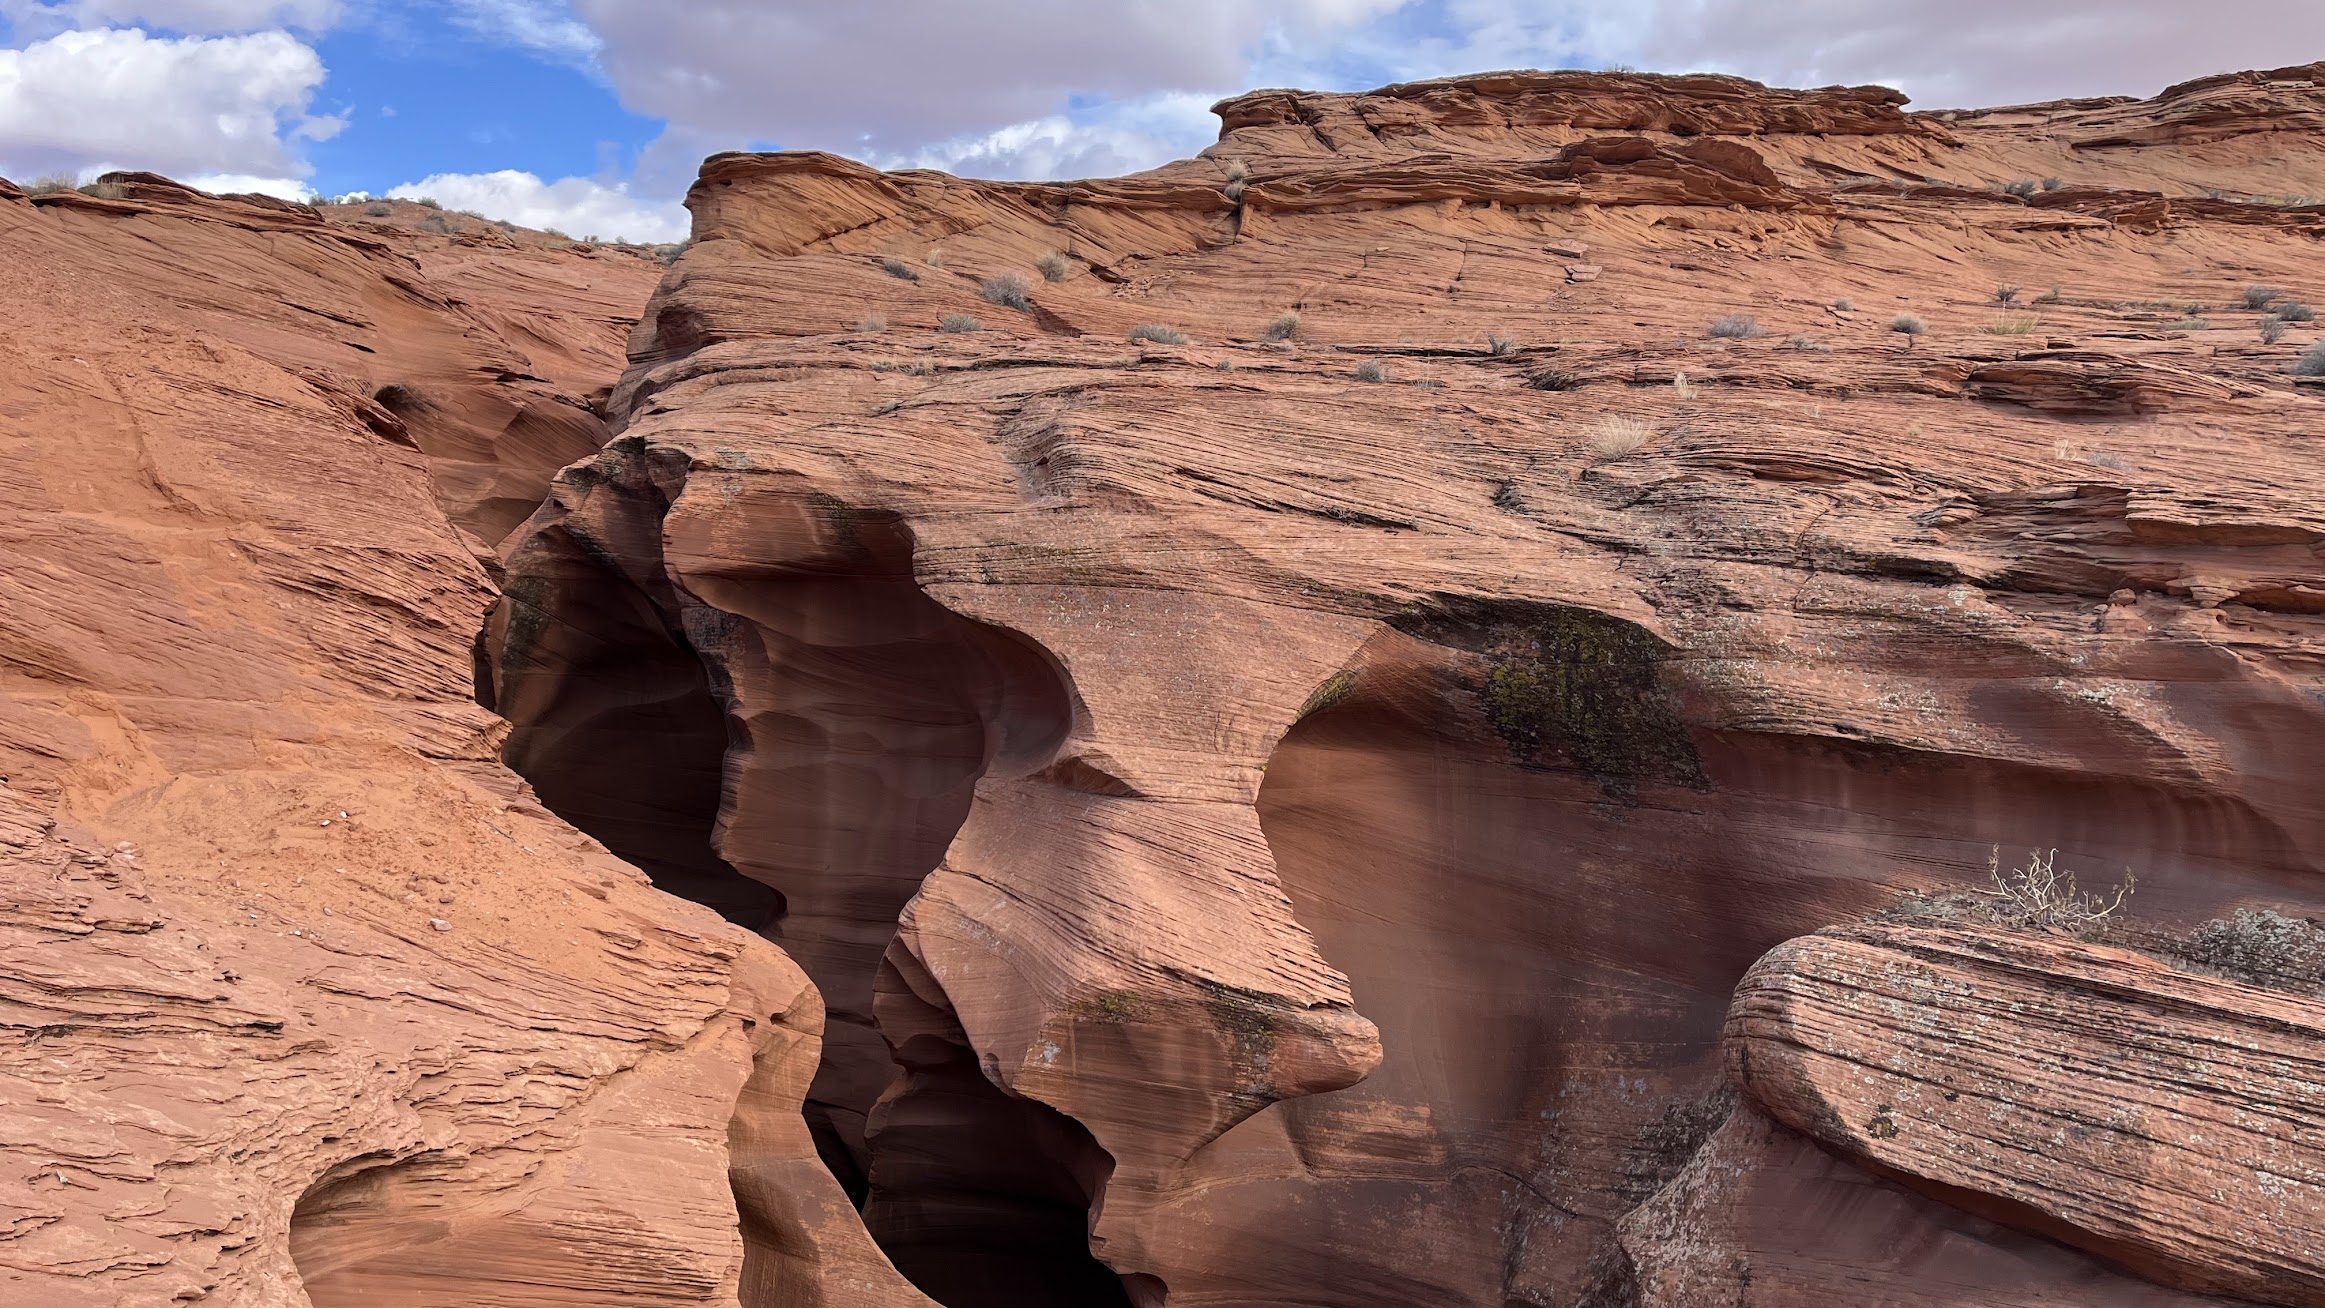
Figure 1.23: Jurassic-aged sandstone makes up the walls of Antelope Canyon in the American Southwest. The slot canyon itself is estimated to have been naturally carved out over the last 5–6 million years. Figure description available at the end of the chapter.
Sediments come to rest in a process known as deposition. As the deposited sediments accumulate—often under water, such as in a shallow marine environment—the older sediments get buried by the new deposits. The deposits are compacted by the weight of the overlying sediments, and individual grains are cemented together by minerals in groundwater. These processes of compaction and cementation are called lithification. Lithified sediments are considered a sedimentary rock, such as sandstone and shale. Other sedimentary rocks are made by direct chemical precipitation of minerals rather than eroded sediments and are known as chemical sedimentary rocks.
Preexisting rocks may be transformed into metamorphic rocks (meta- means “change” and -morphos means “form” or “shape”). When rocks are subjected to extreme increases in temperature or pressure, the mineral crystals are enlarged or altered into entirely new minerals with similar chemical makeups. High temperatures and pressures occur in rocks that are buried deep within the Earth’s crust or that come into contact with hot magma or lava. If the temperature and pressure conditions melt the rocks to create magma and lava, the rock cycle begins anew with the creation of new rocks.
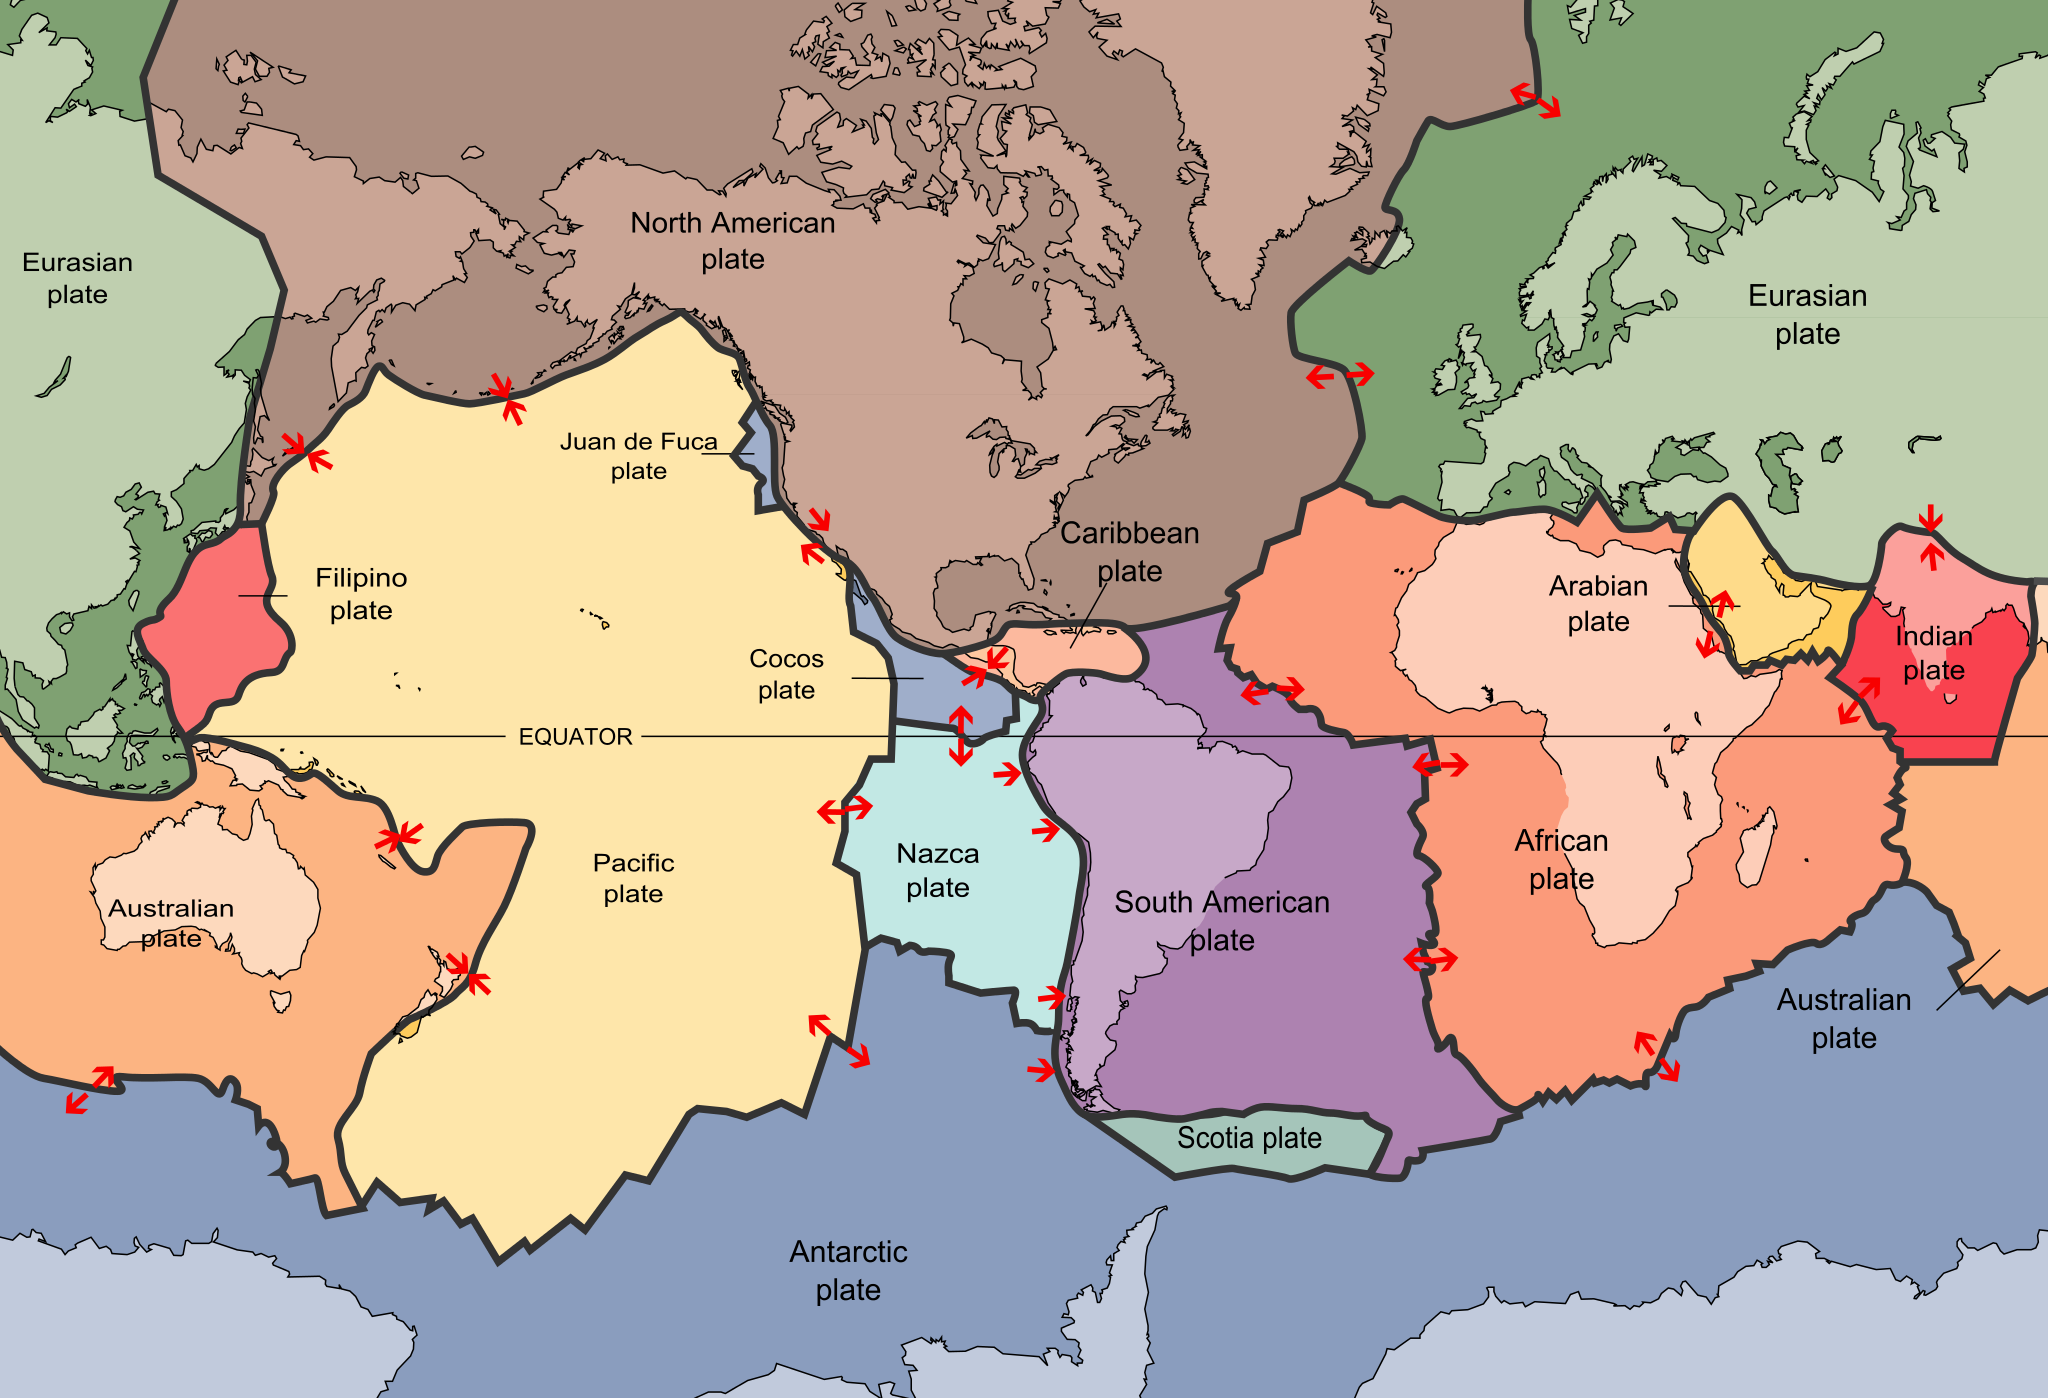
The theory of plate tectonics is the fundamental unifying principle of geology and the rock cycle. Plate tectonics describes how Earth’s layers move relative to each other, focusing on the tectonic or lithospheric plates of the outer layer. Tectonic plates float, collide, slide past each other, and split apart on an underlying mobile layer called the asthenosphere. Major landforms are created at the plate boundaries, and rocks within the tectonic plates move through the rock cycle. Plate tectonics is discussed in more detail in Chapter 2.
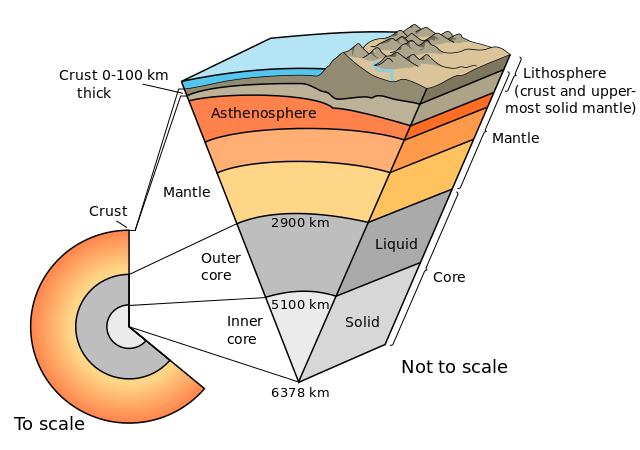
Earth’s three main geological layers can be categorized by chemical composition or the chemical makeup: crust, mantle, and core. The crust is the outermost layer and is composed of mostly silicon, oxygen, aluminum, iron, and magnesium. There are two types, continental crust and oceanic crust. Continental crust is about 50 km (30 mi) thick and is composed of low-density igneous and sedimentary rocks. Oceanic crust is approximately 10 km (6 mi) thick and made of high-density igneous basalt-type rocks. Oceanic crust makes up most of the ocean floor, covering about 70% of the planet. Tectonic plates are made of crust and a portion the upper mantle, forming a rigid physical layer called the lithosphere.
The mantle, the largest chemical layer by volume, lies below the crust and extends down to about 2,900 km (1,800 mi) below the Earth’s surface. The mostly solid mantle is made of peridotite, a high-density rock composed of silica, iron, and magnesium. The upper part of mantel is very hot and flexible, which allows the overlying tectonic plates to float and move about on it. Under the mantle is the Earth’s core, which is 3,500 km (2,200 mi) thick and made of iron and nickel. The core consists of two parts, a liquid outer core and solid inner core. Rotations within the solid and liquid metallic core generate Earth’s magnetic field (see Figure 1.27).
1.5.4 Geologic (Deep) Time
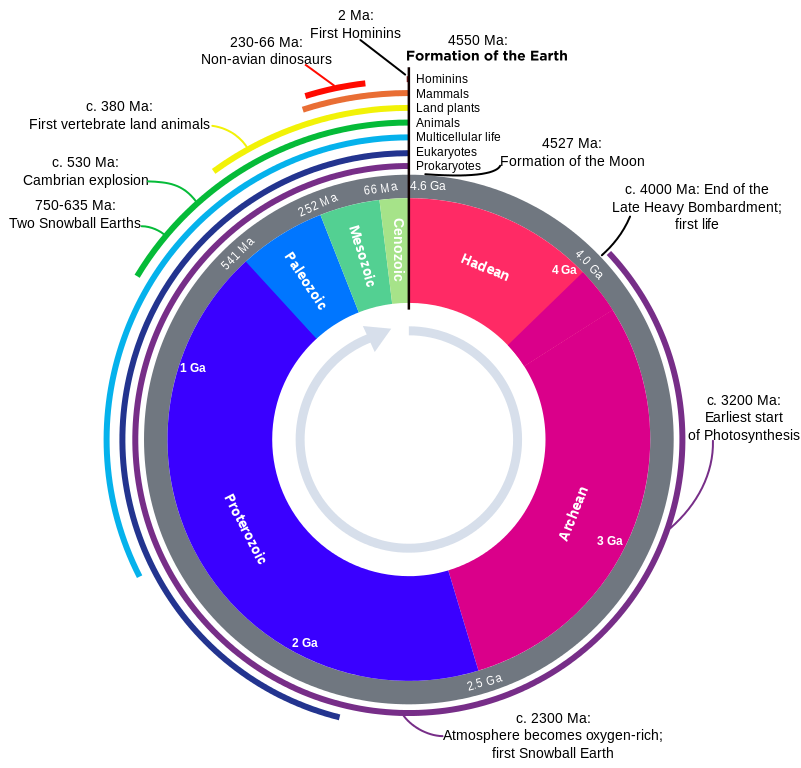
Figure 1.28: Geologic time on Earth, represented circularly, showing the individual time divisions and important events. Ga = billion years ago, Ma = million years ago. Figure description available at the end of the chapter.
“The result, therefore, of our present enquiry is that we find no vestige of a beginning, no prospect of an end.” (James Hutton, 1788)
One of the early pioneers of geology, James Hutton, wrote this about the age of the Earth after many years of geological study. Although he wasn’t exactly correct—there is a beginning and will be an end to planet Earth—Hutton was expressing the difficulty humans have in perceiving the vastness of geological time. Hutton did not assign an age to the Earth, although he was the first to suggest the planet was very old.
Today, we know Earth is approximately 4.54 ± 0.05 billion years old. This age was first calculated by Caltech professor Clair Patterson in 1956, who measured the half-lives of lead isotopes to radiometrically date a meteorite recovered in Arizona. Studying geologic time, also known as deep time, can help us move past a limited perspective of Earth based on our short lifetimes. Compared to the geologic scale, the human lifespan is very short, resulting in our struggle to comprehend the depth of geologic time and slowness of geologic processes. For example, the study of earthquakes only goes back about 100 years; however, there is geologic evidence of large earthquakes occurring thousands of years ago, with scientific evidence indicating that earthquakes will continue for many centuries into the future.
Eons are the largest divisions of time and are named, from oldest to youngest, Hadean, Archean, Proterozoic, and Phanerozoic. The three oldest eons are sometimes collectively referred to as Precambrian time.
Life first appeared more than 3,800 million years ago (Ma). From 3,500 Ma to 542 Ma, or 88% of geologic time, the predominant life forms were single-celled organisms such as bacteria. More complex organisms appeared only more recently during the current Phanerozoic Eon, which includes the last 542 million years, or 12% of geologic time.
The name Phanerozoic comes from phaneros, which means “visible,” and zoic, meaning “life.” This eon marks the proliferation of multicellular animals with hard body parts, such as shells, which are preserved in the geological record as fossils. Land-dwelling animals have existed for 360 million years, or 8% of geologic time. The demise of the dinosaurs and subsequent rise of mammals occurred around 65 Ma, spanning 1.5% of geologic time. Our human ancestors belonging to the genus Homo have existed for approximately 2.2 million years—0.05% of geological time, or just 1/2,000th the total age of Earth.
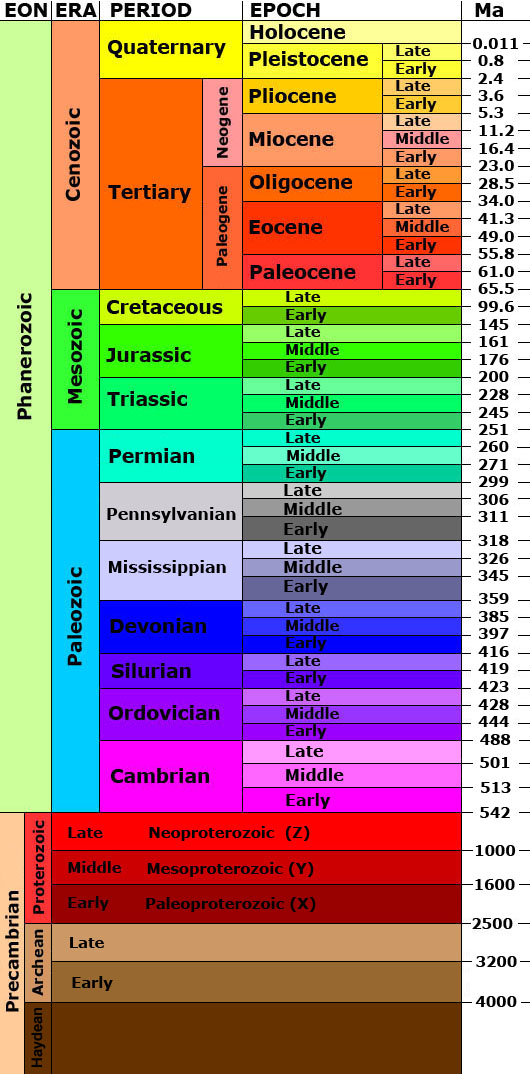
The Phanerozoic Eon is divided into three eras: Paleozoic, Mesozoic, and Cenozoic. Paleozoic means “ancient life,” and organisms of this era include invertebrate animals, fish, amphibians, and reptiles. The Mesozoic (“middle life”) is popularly known as the Age of Reptiles and is characterized by the abundance of dinosaurs, many of which evolved into birds. The mass extinction of the dinosaurs and other apex predator reptiles marked the end of the Mesozoic and beginning of the Cenozoic. Cenozoic means “new life” and is also called the Age of Mammals, during which mammals evolved to become the predominant land-dwelling animals. Fossils of early humans, or hominids, appear in the rock record only during the last few million years of the Cenozoic. The geologic timescale, geologic time, and geologic history are discussed in more detail in Chapters 7 and 8.
A geologist’s tool can be as simple as a rock hammer used for sampling a fresh surface of a rock. A basic toolset for fieldwork might also include:
Magnifying lens for looking at mineralogical details
Compass for measuring the orientation of geologic features
Map for documenting the local distribution of rocks and minerals
Magnet for identifying magnetic minerals like magnetite
Dilute solution of hydrochloric acid to identify carbonate-containing minerals like calcite or limestone.
In the laboratory, geologists use optical microscopes to closely examine rocks and soil for mineral composition and grain size. Laser and mass spectrometers precisely measure the chemical composition and geological age of minerals. Seismographs record and locate earthquake activity or, when used in conjunction with ground penetrating radar, locate objects buried beneath the surface of the earth. Scientists apply computer simulations to turn their collected data into testable, theoretical models. Hydrogeologists drill wells to sample and analyze underground water quality and availability. Geochemists use scanning electron microscopes to analyze minerals at the atomic level via x-rays. Other geologists use gas chromatography to analyze liquids and gases trapped in glacial ice or rocks.
Technology provides new tools for scientific observation, which leads to new evidence that helps scientists revise and even refute old ideas. Because the ultimate technology will never be discovered, the ultimate observation will never be made. And this is the beauty of science—it is always advancing through new discoveries.
Take this quiz to check your comprehension of this section.
If you are using an offline version of this text, access the quiz for Section 1.5 via the QR code.
1.6 Science Denial and Evaluating Sources
Video 1.1: Science in America
If you are using an offline version of this text, access this YouTube video via the QR code.
Introductory science courses usually deal with accepted scientific theory and do not include opposing ideas, even though these alternate ideas may be credible. This makes it easier for students to understand the complex material. Advanced students will encounter more controversies as they continue to study their discipline.
Various groups argue that some established scientific theories are wrong—an assertion that is not based on their scientific merit but rather on the ideology of the group. This section focuses on how to identify evidence based information and differentiate it from pseudoscience.
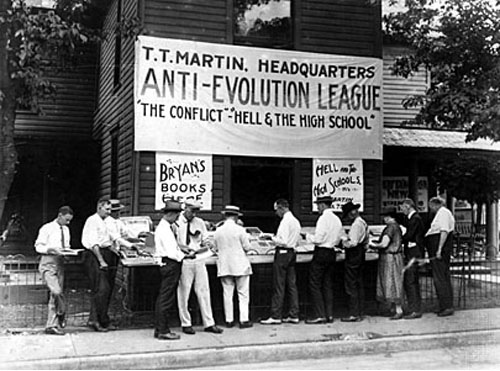
Science denial involves arguing that established scientific theories are wrong based on subjective ideology—such as social, political, or economic reasons. Organizations and people use science denial as a rhetorical argument against issues or ideas they oppose. Three examples of science denial can be seen in controversies surrounding: 1) teaching evolution in public schools, 2) linking tobacco smoke to cancer, and 3) linking human activity to climate change. Among these, denial of climate change is strongly connected with geology. A climate denier specifically denies or doubts the objective conclusions of geologists and climate scientists.
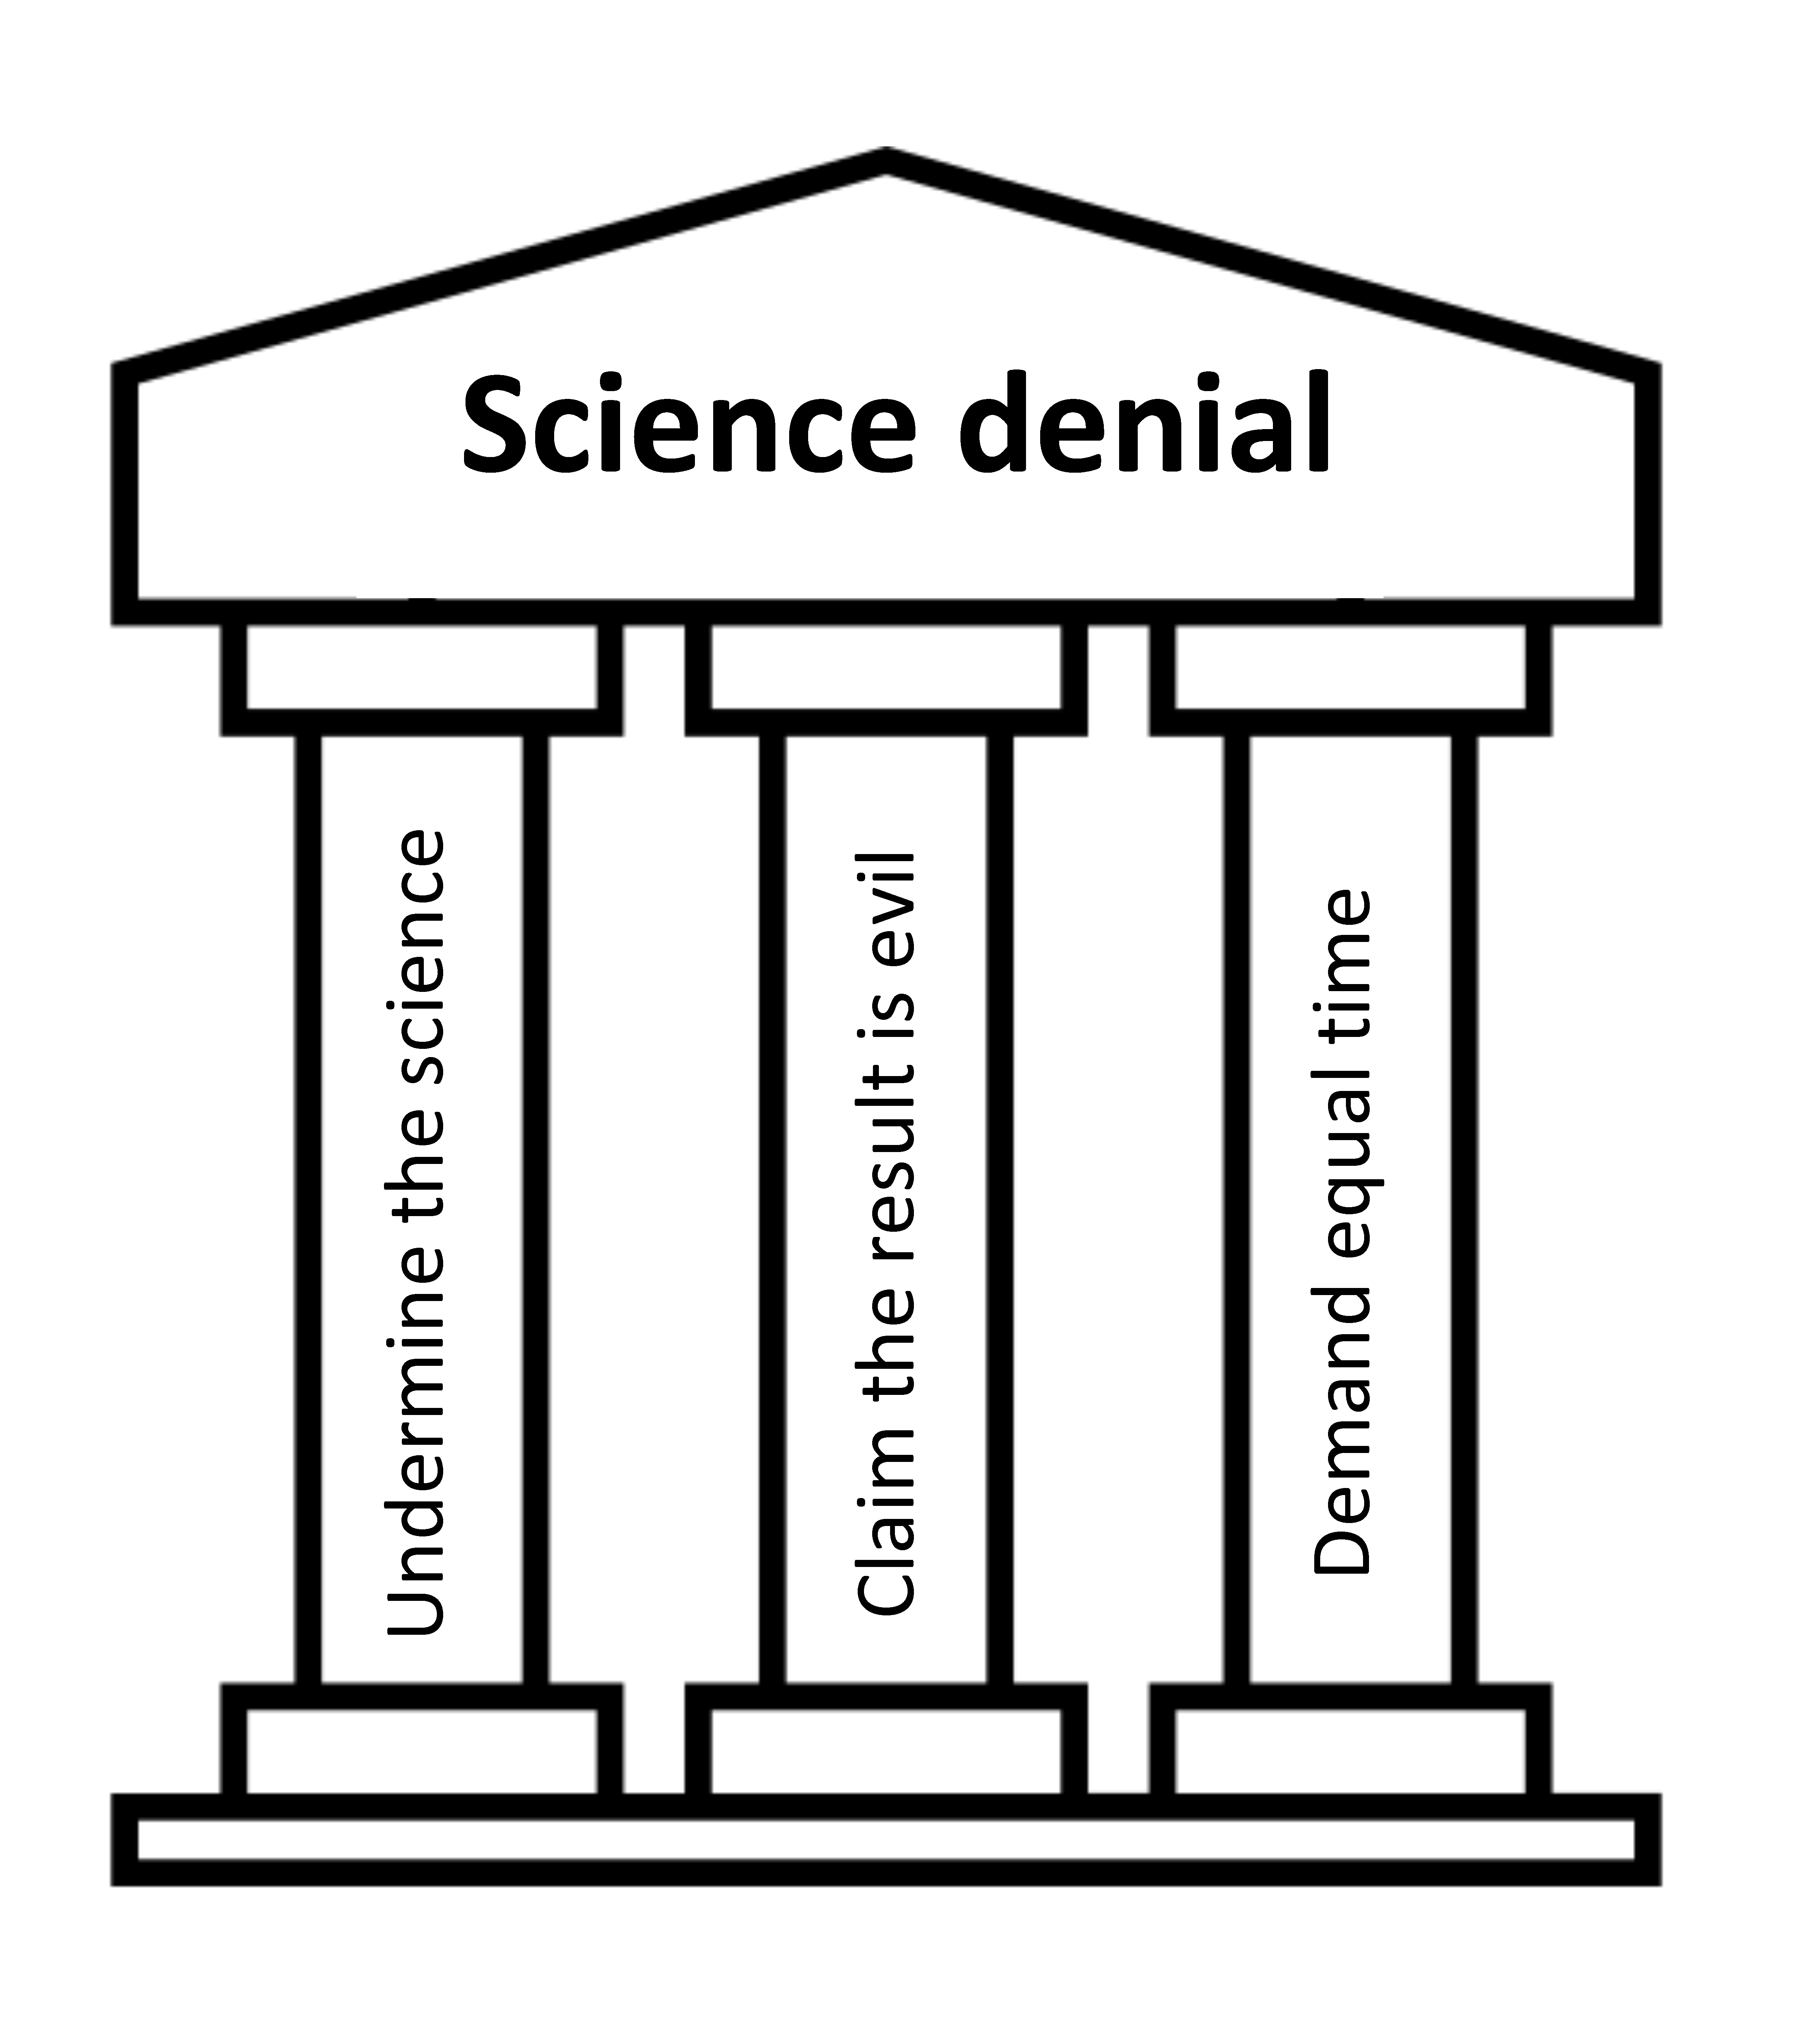
Science denial generally uses three false arguments. The first argument tries to undermine the credibility of a scientific conclusion by claiming the research methods are flawed or the theory is not universally accepted—the science is unsettled. The notion that scientific ideas are not absolute creates doubt for nonscientists; however, a lack of universal truths should not be confused with scientific uncertainty. Since science is based on falsifiability, scientists avoid claiming universal truths and use language that conveys uncertainty. This allows scientific ideas to change and evolve as more evidence is uncovered.
The second argument claims the researchers are not objective and are motivated by an ideology or economic agenda. This is an ad hominem argument in which a person’s character is attacked instead of the merit of their argument. They claim results have been manipulated so researchers can justify asking for more funding. They claim that, because the researchers are funded by federal grants, they are using their results to lobby for expanded government regulation.
The third argument is to demand a balanced view, with equal time in media coverage and educational curricula, to engender the false illusion of two equally valid arguments. Science deniers frequently demand equal coverage of their proposals, even when there is little scientific evidence supporting their ideology. For example, science deniers might demand that religious explanations be taught as an alternative to the well-established theory of evolution or that all possible causes of climate change be discussed as equally probable, regardless of the body of evidence. Conclusions derived using the scientific method should not be confused with those based on ideologies.
Furthermore, conclusions about nature derived from ideologies have no place in science research and education. For example, it would be inappropriate to teach the flat Earth model in a modern geology course because this idea has been disproved by the scientific method. The formation of new conclusions based on the scientific method is the only way to change scientific conclusions. The fact that scientists avoid universal truths and change their ideas as more evidence is uncovered shouldn’t be seen as an indication that the science is unsettled. Unfortunately, widespread scientific illiteracy allows these arguments to be used to suppress scientific knowledge and spread misinformation.
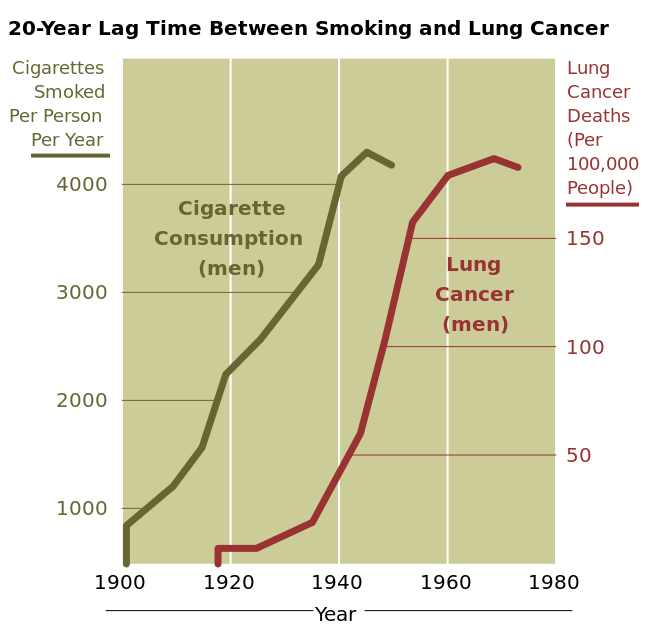
In a classic case of science denial, beginning in the 1960s and for the next three decades, the tobacco industry and their scientists used rhetorical arguments to deny a connection between tobacco usage and cancer. Once it became clear that scientific studies overwhelmingly found that using tobacco dramatically increased a person’s likelihood of getting cancer, their next strategy was to create a sense of doubt around the science. The tobacco industry suggested the results were not yet fully understood and more study was needed. They used this doubt to lobby for delaying legislative action that would warn consumers of the potential health hazards. This same tactic is currently being employed by those who deny the significance of human involvement in climate change.
In the age of the internet, information is plentiful. Geologists, scientists, or anyone exploring scientific inquiry must discern valid sources of information from pseudoscience and misinformation. This evaluation is especially important in scientific research because scientific knowledge is respected for its reliability. Textbooks such as this one can aid in this complex and crucial task. At its roots, quality information comes from the scientific method, beginning with the empirical thinking of Aristotle. The application of the scientific method helps produce unbiased results. A valid inference or interpretation is based on objective evidence or data. Credible data and inferences are clearly labeled, separated, and differentiated. Anyone looking over the data can understand how the author’s conclusion was derived or can come to an alternative conclusion. Scientific procedures are clearly defined to ensure that the investigation can be replicated to confirm the original results or expanded further to produce new results. These measures make a scientific inquiry valid and its use as a source reputable. Of course, substandard work occasionally slips through and retractions are published from time to time. An infamous article linking the MMR vaccine to autism appeared in the highly reputable journal Lancet in 1998. Journalists discovered the author had multiple conflicts of interest and fabricated data, and the article was retracted in 2010.
In addition to methodology, data, and results, the authors of a study should be investigated when looking into any research. An author’s credibility is based on multiple factors, such as having a degree in a relevant topic or being funded by an unbiased source.
The same rigor should be applied to evaluating the publisher, ensuring that the results reported come from an unbiased process. The publisher should be easy to discover. Good publishers will include the latest papers in the journal and make their contact information and identification clear. Reputable journals show their peer review style. Some journals are predatory, requiring unexplained and unnecessary fees to submit and access journals. Reputable journals also have recognizable editorial boards. Often, a reliable journal will associate with a trade, association, or recognized open source initiative.
One of the hallmarks of scientific research is peer review. Research should be transparent to peer review. This allows the scientific community to reproduce experimental results, correct and retract errors, and validate theories.
Citation is not just important because it avoids plagiarism; it also allows readers to investigate an author’s line of thought and conclusions. When reading scientific works, it is important to confirm the citations are from reputable scientific research. Most often, scientific citations are used to reference instances of paraphrasing rather than direct quotes. The number of times a work is cited is said to be a measure of the influence an investigation has within the scientific community, although this technique is inherently biased.
Take this quiz to check your comprehension of this section.
If you are using an offline version of this text, access the quiz for Section 1.6 via the QR code.
Summary
Science is a process with no beginning and no end. Science is never finished because a full truth can never be known. However, science and the scientific method are the best way to understand the universe in which we live. Scientists draw conclusions based on objective evidence; they then consolidate these conclusions into unifying models. Geologists likewise understand that studying the Earth is an ongoing process, beginning with James Hutton who declared the Earth has “no vestige of a beginning, no prospect of an end.” Geologists explore the 4.5 billion-year history of Earth, its resources, and its many hazards. From a larger viewpoint, geology can teach people how to develop credible conclusions, as well as identify and stop misinformation.
Take this quiz to check your comprehension of this chapter.
If you are using an offline version of this text, access the quiz for Chapter 1 via the QR code.
Text References
Adams, F.D. (1954). The birth and development of the geological sciences.
Alfè, D., Gillan, M.J., and Price, G.D. (2002). Composition and temperature of the Earth’s core constrained by combining ab initio calculations and seismic data. Earth Planet. Sci. Lett., 195(1), 91–98.
Beckwith, C. (2013). How western Europe developed a full scientific method: Berfrois.
Birch, F. (1952). Elasticity and constitution of the Earth’s interior. J. Geophys. Res., 57(2), 227–286. doi: 10.1029/JZ057i002p00227.
Bocking, S. (2004). Nature’s experts: Science, politics, and the environment: Rutgers University Press.
Chamberlin, T.C. (1890). The method of multiple working hypotheses. Science, 15(366), 92–96.
Cohen, H.F. (2010). How modern science came into the world: Four civilizations, one 17th-century breakthrough: Amsterdam University Press.
Darwin, C. (1846). Geological observations on South America: Being the third part of the geology of the voyage of the Beagle, under the command of Capt. Fitzroy, R.N., during the years 1832 to 1836: Smith, Elder and Company.
Drake, S. (1990) Galileo: Pioneer Scientist: University of Toronto Press.
Engdahl, E.R., Flynn, E.A., and Masse, R.P. (1974), Differential PkiKP travel times and the radius of the core. Geophysical J. Royal Astro. Soc., 40, 457–463.
Everitt, A. (2016). The rise of Athens: The story of the world’s greatest civilization: Random House.
Goldstein, B.R. (2002). Copernicus and the origin of his heliocentric system. Journal for the History of Astronomy, 33, 219–235.
Goldsworthy, A.K. (2011). The complete Roman army: Thames & Hudson.
Hans Wedepohl, K. (1995). The composition of the continental crust. Geochim. Cosmochim. Acta, 59(7), 1217–1232.
Heilbron, J.L. (2012) Galileo: Oxford University Press.
Hogendijk, J.P., and Sabra, A.I. (2003) The enterprise of science in Islam: New perspectives: MIT Press.
Jakosky, B.M., Grebowsky, J.M., Luhmann, J.G., Connerney, J., Eparvier, F., Ergun, R., Halekas, J., Larson, D., Mahaffy, P., McFadden, J., Mitchell, D.F., Schneider, N., Zurek, R., Bougher, S., et al. (2015). MAVEN observations of the response of Mars to an interplanetary coronal mass ejection. Science, 350(6261), aad0210.
Kerferd, G.B. (1959). The biography of Aristotle – Ingemar Düring: Aristotle in the ancient biographical tradition. (Studia Graeca et Latina Gothoburgensia v.) Pp. 490; 1 plate. Gothenburg: Institute of Classical Studies, 1957. Paper, Kr. 32: Classical Rev., 9(2), 128–130.
Kolbert, E. (2014). The sixth extinction: An unnatural history: Henry Holt and Co.
Krimsky, S. (2013). Do financial conflicts of interest bias research? An inquiry into the “funding effect” hypothesis. Sci. Technol. Human Values, 38(4), 566–587.
Lehmann, I. (1936). P’, Bur. Centr. Seism. Internat. A(14), 87–115.
Marshall, J. (2010). A short history of Greek philosophy: Andrews UK Limited.
Martin, C. (2014). Subverting Aristotle: Religion, history, and philosophy in early modern science: Johns Hopkins University Press.
Mayr, E. (1942). Systematics and the origin of species, from the viewpoint of a zoologist: Harvard University Press.
Montgomery, K. (2003). Siccar Point and teaching the history of geology. J. Geosci. Educ.
Mooney, W.D., Laske, G., and Masters, T.G. (1998). CRUST 5.1: A global crustal model. J. Geophys. Res. [Solid Earth], 103(B1), 727–747.
Moustafa, K. (2016) Aberration of the citation. Account. Res., 23(4), 230–244.
National Center for Science Education (2016). Climate change denial. Online, https://ncse.ngo/climate-change-denial, accessed April 2016.
Oreskes, N., Conway, E., and Cain, S. (2010). Merchants of doubt: How a handful of scientists obscured the truth on issues from tobacco smoke to global warming: Bloomsbury Press.
Paradowski, R.J. (2012). Nicolas Steno: Danish anatomist and geologist, in Great lives from history: Scientists & science, 830–832.
Patterson, C. (1956). Age of meteorites and the earth. Geochim. Cosmochim. Acta, 10(4), 230–237.
Popper, K. (2002). Conjectures and refutations: The Growth of scientific knowledge: Routledge.
Porter, R. (1976). Charles Lyell and the principles of the history of geology. Br. J. Hist. Sci., 9(2), 91–103.
Railsback, B.L. (1990). T. C. Chamberlin’s “method of multiple working hypotheses”: An encapsulation for modern students. Online, http://www.gly.uga.edu/railsback/railsback_chamberlin.html, accessed December 2016.
Railsback, B.L. (2004). T. C. Chamberlin’s “method of multiple working hypotheses”: An encapsulation for modern students. Houston Geological Society Bulletin, 47(2), 68–69.
Rappaport, R. (1994). James Hutton and the history of geology. Dennis R. Dean. Isis, 85(3), 524–525.
Repcheck, J. (2007). Copernicus’ secret: How the scientific revolution began: Simon and Schuster.
Repcheck, J. (2009). The man who found time: James Hutton and the discovery of the Earth’s antiquity: Basic Books.
Sabra, A.I. et al. (1989). The optics of Ibn al-Haytham: Books I-III: On direct vision: Warburg Institute, University of London.
Saliba, G. (2007). Islamic science and the making of the European renaissance: MIT Press.
Shermer, M. (2011). What Is Pseudoscience? Scientific American.
Snow, C.E. (Ed.). (2016). Science literacy: Concepts, contexts, and consequences: National Academies Press (US).
Spier, R. (2002). The history of the peer-review process. Trends Biotechnol., 20(8), 357–358.
Van Reybrouck, D. (2012). From primitives to primates: A history of ethnographic and primatological analogies in the study of prehistory: Sidestone Press.
Waters, C.N., Zalasiewicz, J., Summerhayes, C., Barnosky, A.D., Poirier, C., Galuszka, A., Cearreta, A., Edgeworth, M., Ellis, E.C., Ellis, M., Jeandel, C., Leinfelder, R., McNeill, J.R., Richter, D.D., et al. (2016). The Anthropocene is functionally and stratigraphically distinct from the Holocene. Science, 351(6269), aad2622.
de Wijs, G.A., Kresse, G., Vočadlo, L., Dobson, D., Alfè, D., Gillan, M.J., and Price, G.D. (1998). The viscosity of liquid iron at the physical conditions of the Earth’s core. Nature, 392(6678), 805–807., doi: 10.1038/33905.
Wyhe, J.V. (2008). Darwin: Andre Deutsch.
Wyllie, P.J. (1970). Ultramafic rocks and the upper mantle, in Morgan, B.A. (ed.), Fiftieth anniversary symposia: Mineralogy and petrology of the Upper Mantle; Sulfides; Mineralogy and geochemistry of non-marine evaporites: Mineralogical Society of America, 3–32.
Zalasiewicz, J., Williams, M., Smith, A., Barry, T.L., Coe, A.L., Bown, P.R., Brenchley, P., Cantrill, D., Gale, A., Gibbard, P., et al. (2008). Are we now living in the Anthropocene? GSA Today, 18(2), 4.
Figure References
Figure 1.1: This is Cascade Falls in Pembroke, Virginia. Laura Neser. September 8, 2021. CC BY-NC.
Figure 1.2: Canyons like this, carved in the deposit left by the May 18th, 1980, eruption of Mount St. Helens, are sometimes used by purveyors of pseudoscience as evidence for the Earth being very young. Richard Droker. 2011. CC BY-NC-ND 2.0. https://flic.kr/p/2cNFV8D
Figure 1.3: Geologists share information by publishing, attending conferences, and even going on field trips, such as this trip to the Lake Owyhee Volcanic Field in Oregon by the Bureau of Land Management in 2019. Bureau of Land Management Oregon and Washington. 2019. CC BY 2.0. https://flic.kr/p/RCtkjX
Figure 1.18: Glen Canyon Dam in the southwestern United States forms Lake Powell, a reservoir on the Colorado River in Utah and Arizona. Laura Neser. March 9, 2022. CC BY-NC.
Figure 1.22: Rock cycle showing the five materials (such as igneous rocks and sediment) and the processes by which one changes into another (such as weathering). Kindred Grey. 2022. CC BY 4.0.
Figure 1.23: Jurassic-aged sandstone makes up the walls of Antelope Canyon in the American Southwest. Laura Neser. September 8, 2021. CC BY-NC.
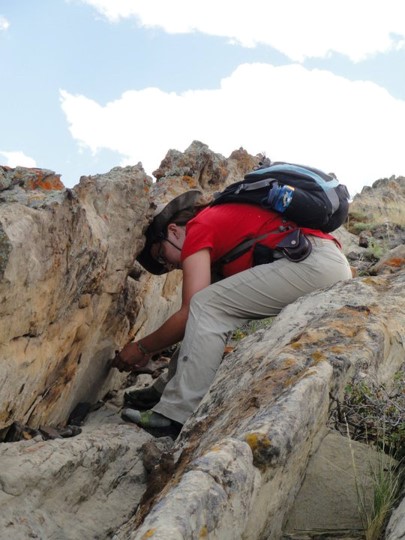
Figure 1.30: Dr. Laura Neser using a Brunton compass to measure the orientation of tilted sedimentary rocks in northwestern Wyoming. Laura Neser. 2011. CC BY-NC.
Figure 1.33: Three false rhetorical arguments of science denial. Kindred Grey. 2022. CC BY 4.0. Includes columns by Med MB from Noun Project (Noun Project license).
Figure 1.1: A waterfall flowing into a pool of water. There are green trees on either side of the falls and tan to brown flat rocks in the foreground.
Figure 1.2: Aerial view of modern canyons carved through dark gray unconsolidated volcanic deposits with sparse vegetation in the area.
Figure 1.3: 15 people at a field trip looking at large rock outcrops in the distance.
Figure 1.4: Diagram showing the steps of the scientific method in a circular pattern that repeats itself. Clockwise starting from the top. Make observations (What do I see in nature? This can be from one’s own experiences, thoughts, or reading.). Think of interesting questions (Why does that pattern occur?). Formulate hypotheses (What are the general causes of the phenomenon I am wondering about?). Develop testable predictions (If my hypothesis is correct, then I expect a, b, c…). Gather data to test predictions (Relevant data can come from the literature, new observations, or formal experiments. Thorough testing requires replication to verify results.). Refine, alter, expand, or reject hypotheses. Develop general theories (General theories must be consistent with most or all available data and with other current theories.).
Figure 1.5: A grid of 12 images showing a horse throughout stages of galloping, some of which show that the horse lifted all 4 legs off the ground during the gallop.
Figure 1.6: A highly viscous black petroleum fluid that drips out of a funnel into a beaker extremely slowly, about once a decade.
Figure 1.7: Headshot of Alfred Wegener, a white man, in a suit.
Figure 1.8: Mural painting of Plato and Aristotle walking together while dressed in Greek robes.
Figure 1.9: Modern depiction of a man. He is wearing a turban, dressed in robes, writing a letter, sitting on the ground.
Figure 1.10: Illustration of the Ptolemaic geocentric conception of the Universe. The left-hand side of the diagram shows the distances of the bodies to the center of the Earth and the right-hand side shows each body’s time of revolution, in years. The text is in Portuguese.
Figure 1.11: Page with Italian text that includes four drawings of Jupiter with multiple moons on either side of it which change position in each drawing.
Figure 1.12: Series of concentric circles representing each planet’s orbit from Mercury to Saturn (the only known planets at the time) with the Sun in the center.
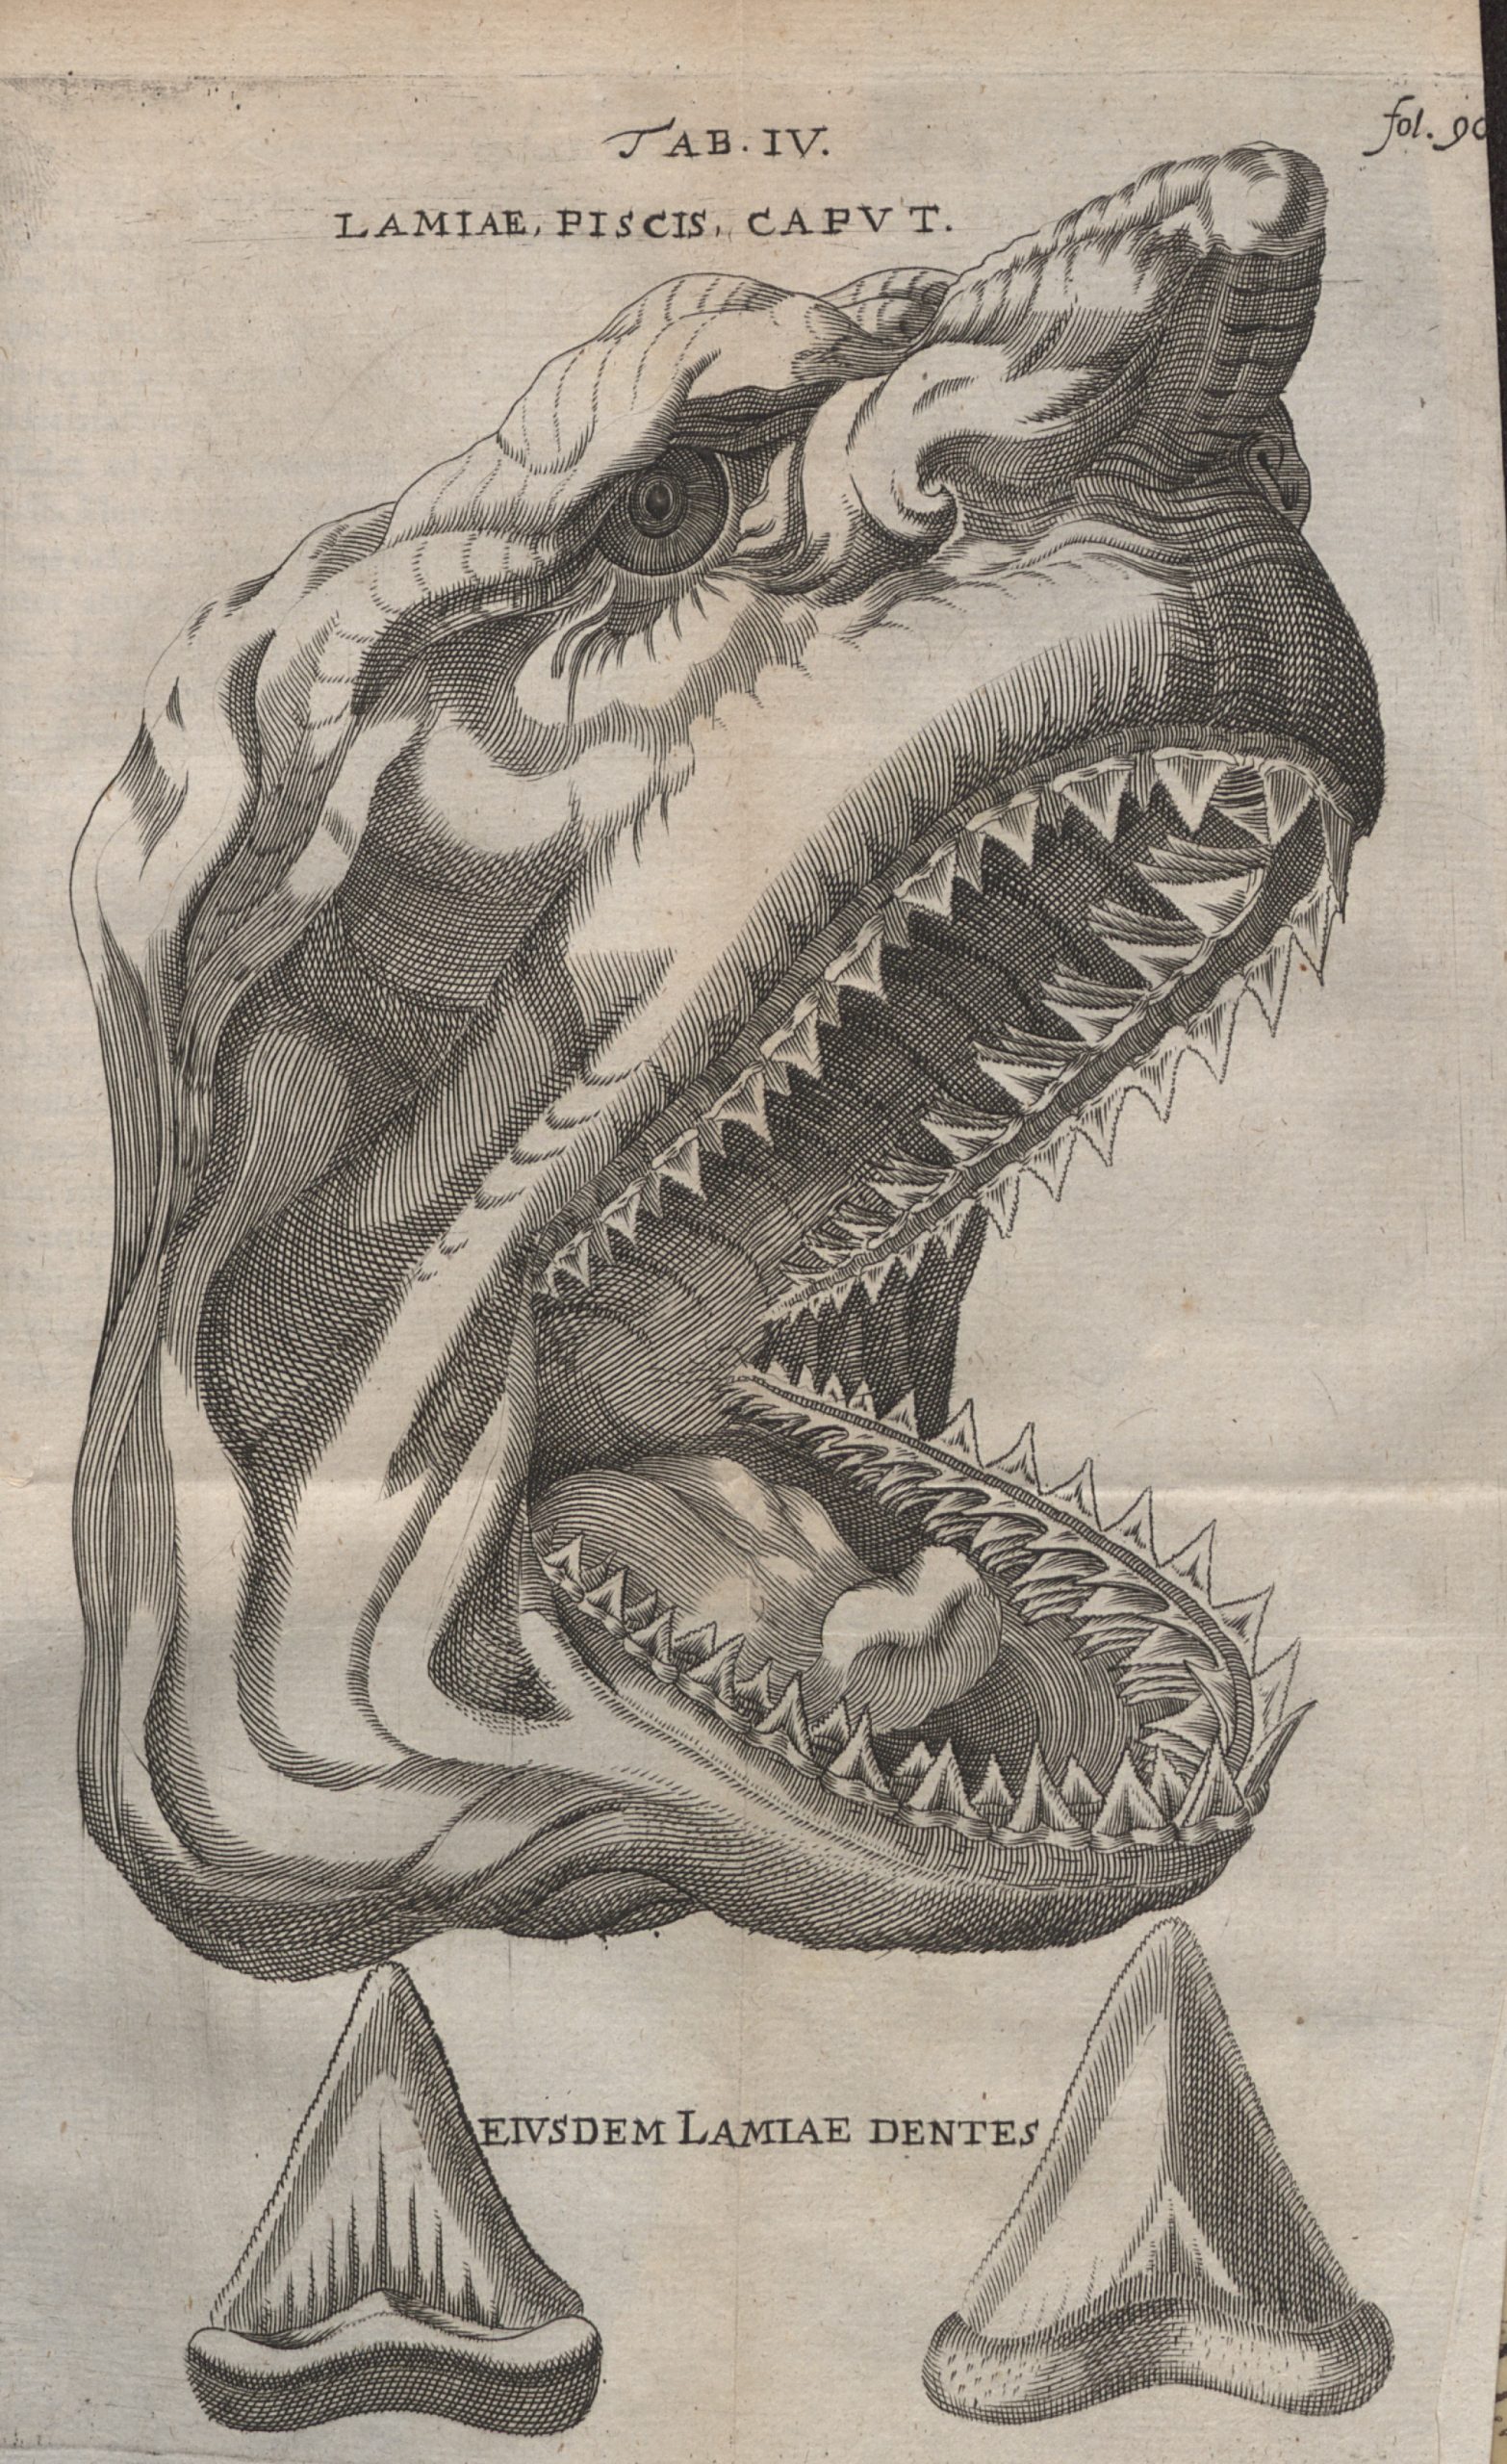
Figure 1.13: Black and white illustration of a shark head with a close-up view of a fossil shark tooth and a modern shark tooth at the bottom of the page.
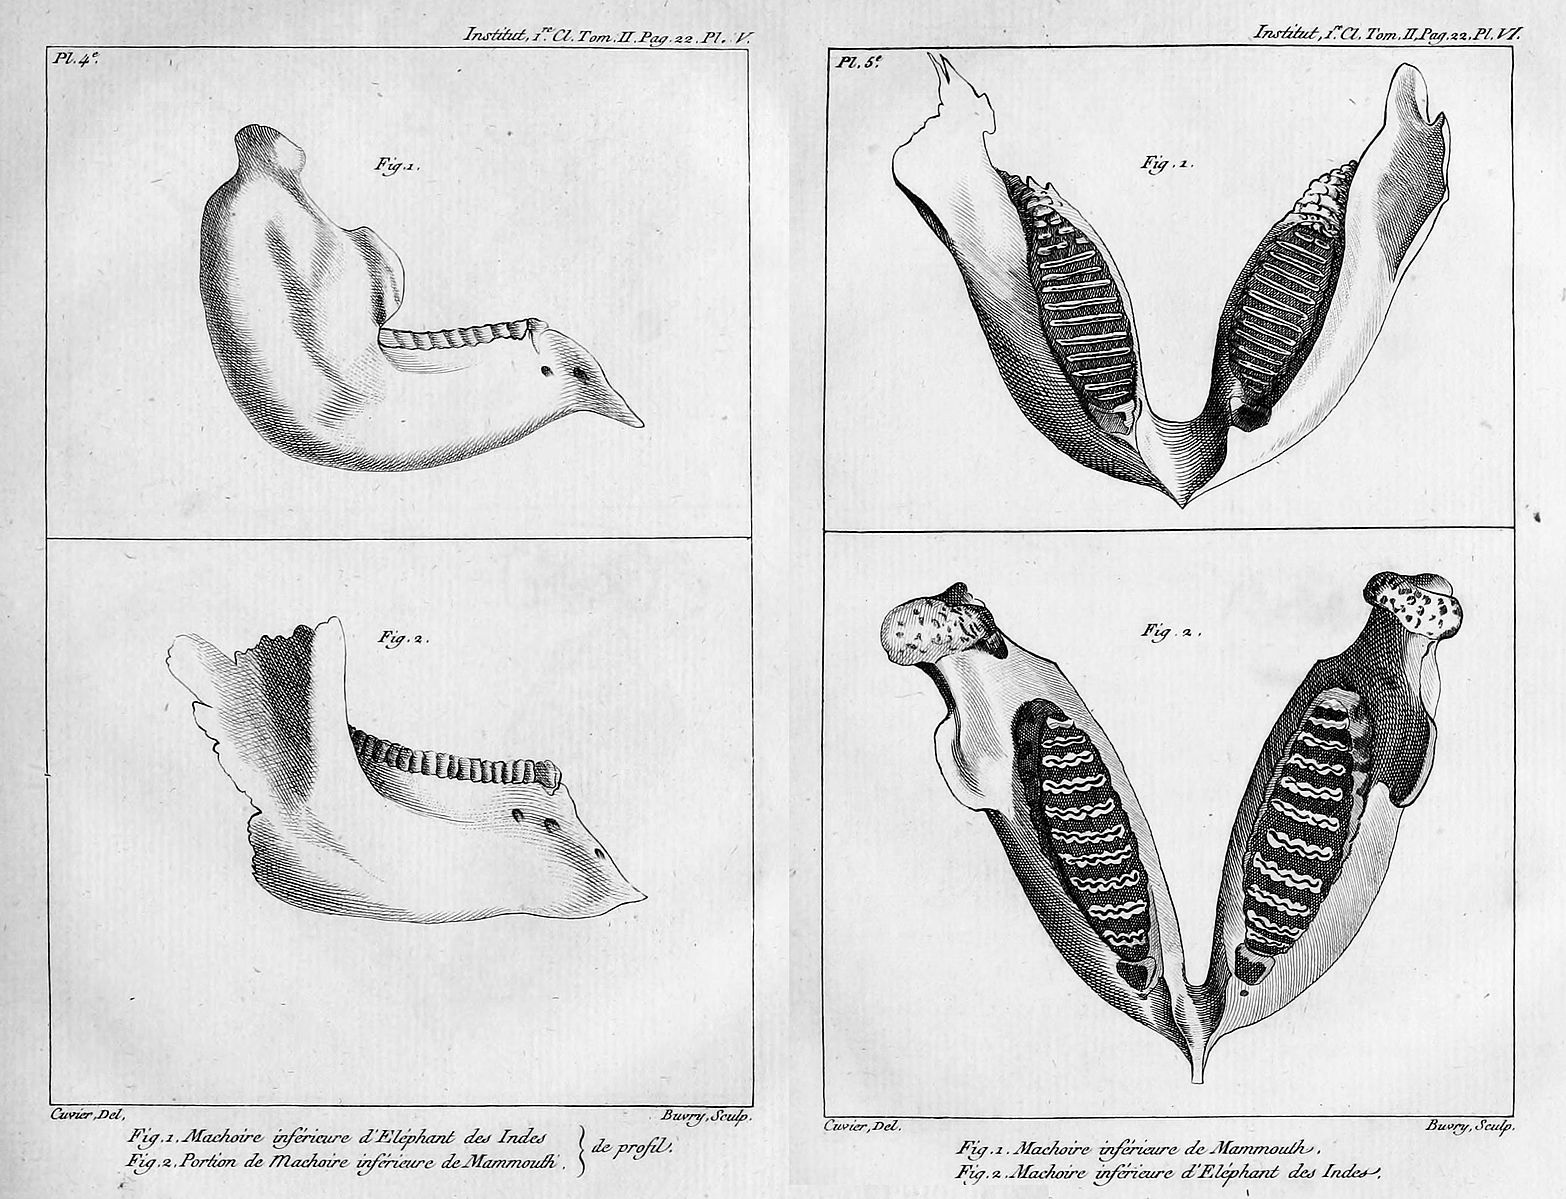
Figure 1.14: Black and white drawings of the jaw of an Indian elephant and the fossil jaw of a mammoth. Side views of each jaw are on the left and front views of each jaw are on the right.
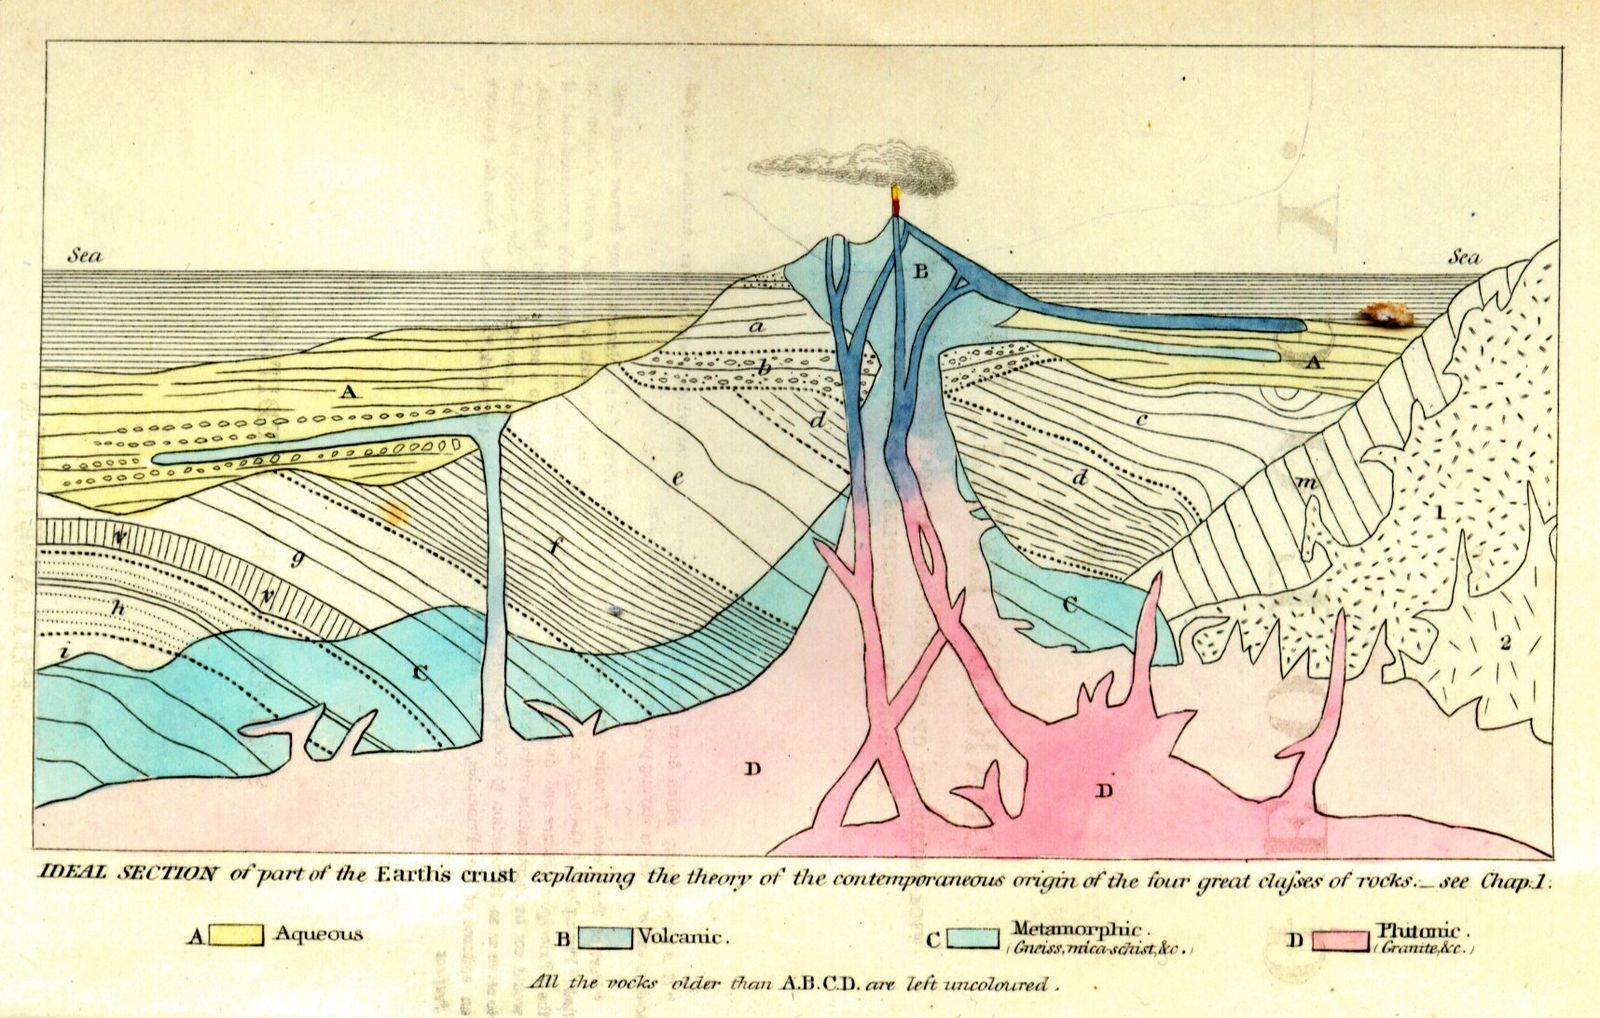
Figure 1.15: Idealized cross section of part of the Earth’s crust with a volcano and its magma chambers in the center.
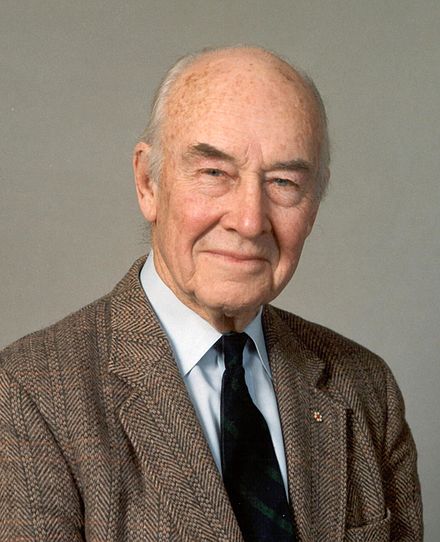
Figure 1.16: Headshot of an older man wearing a suit and tie.
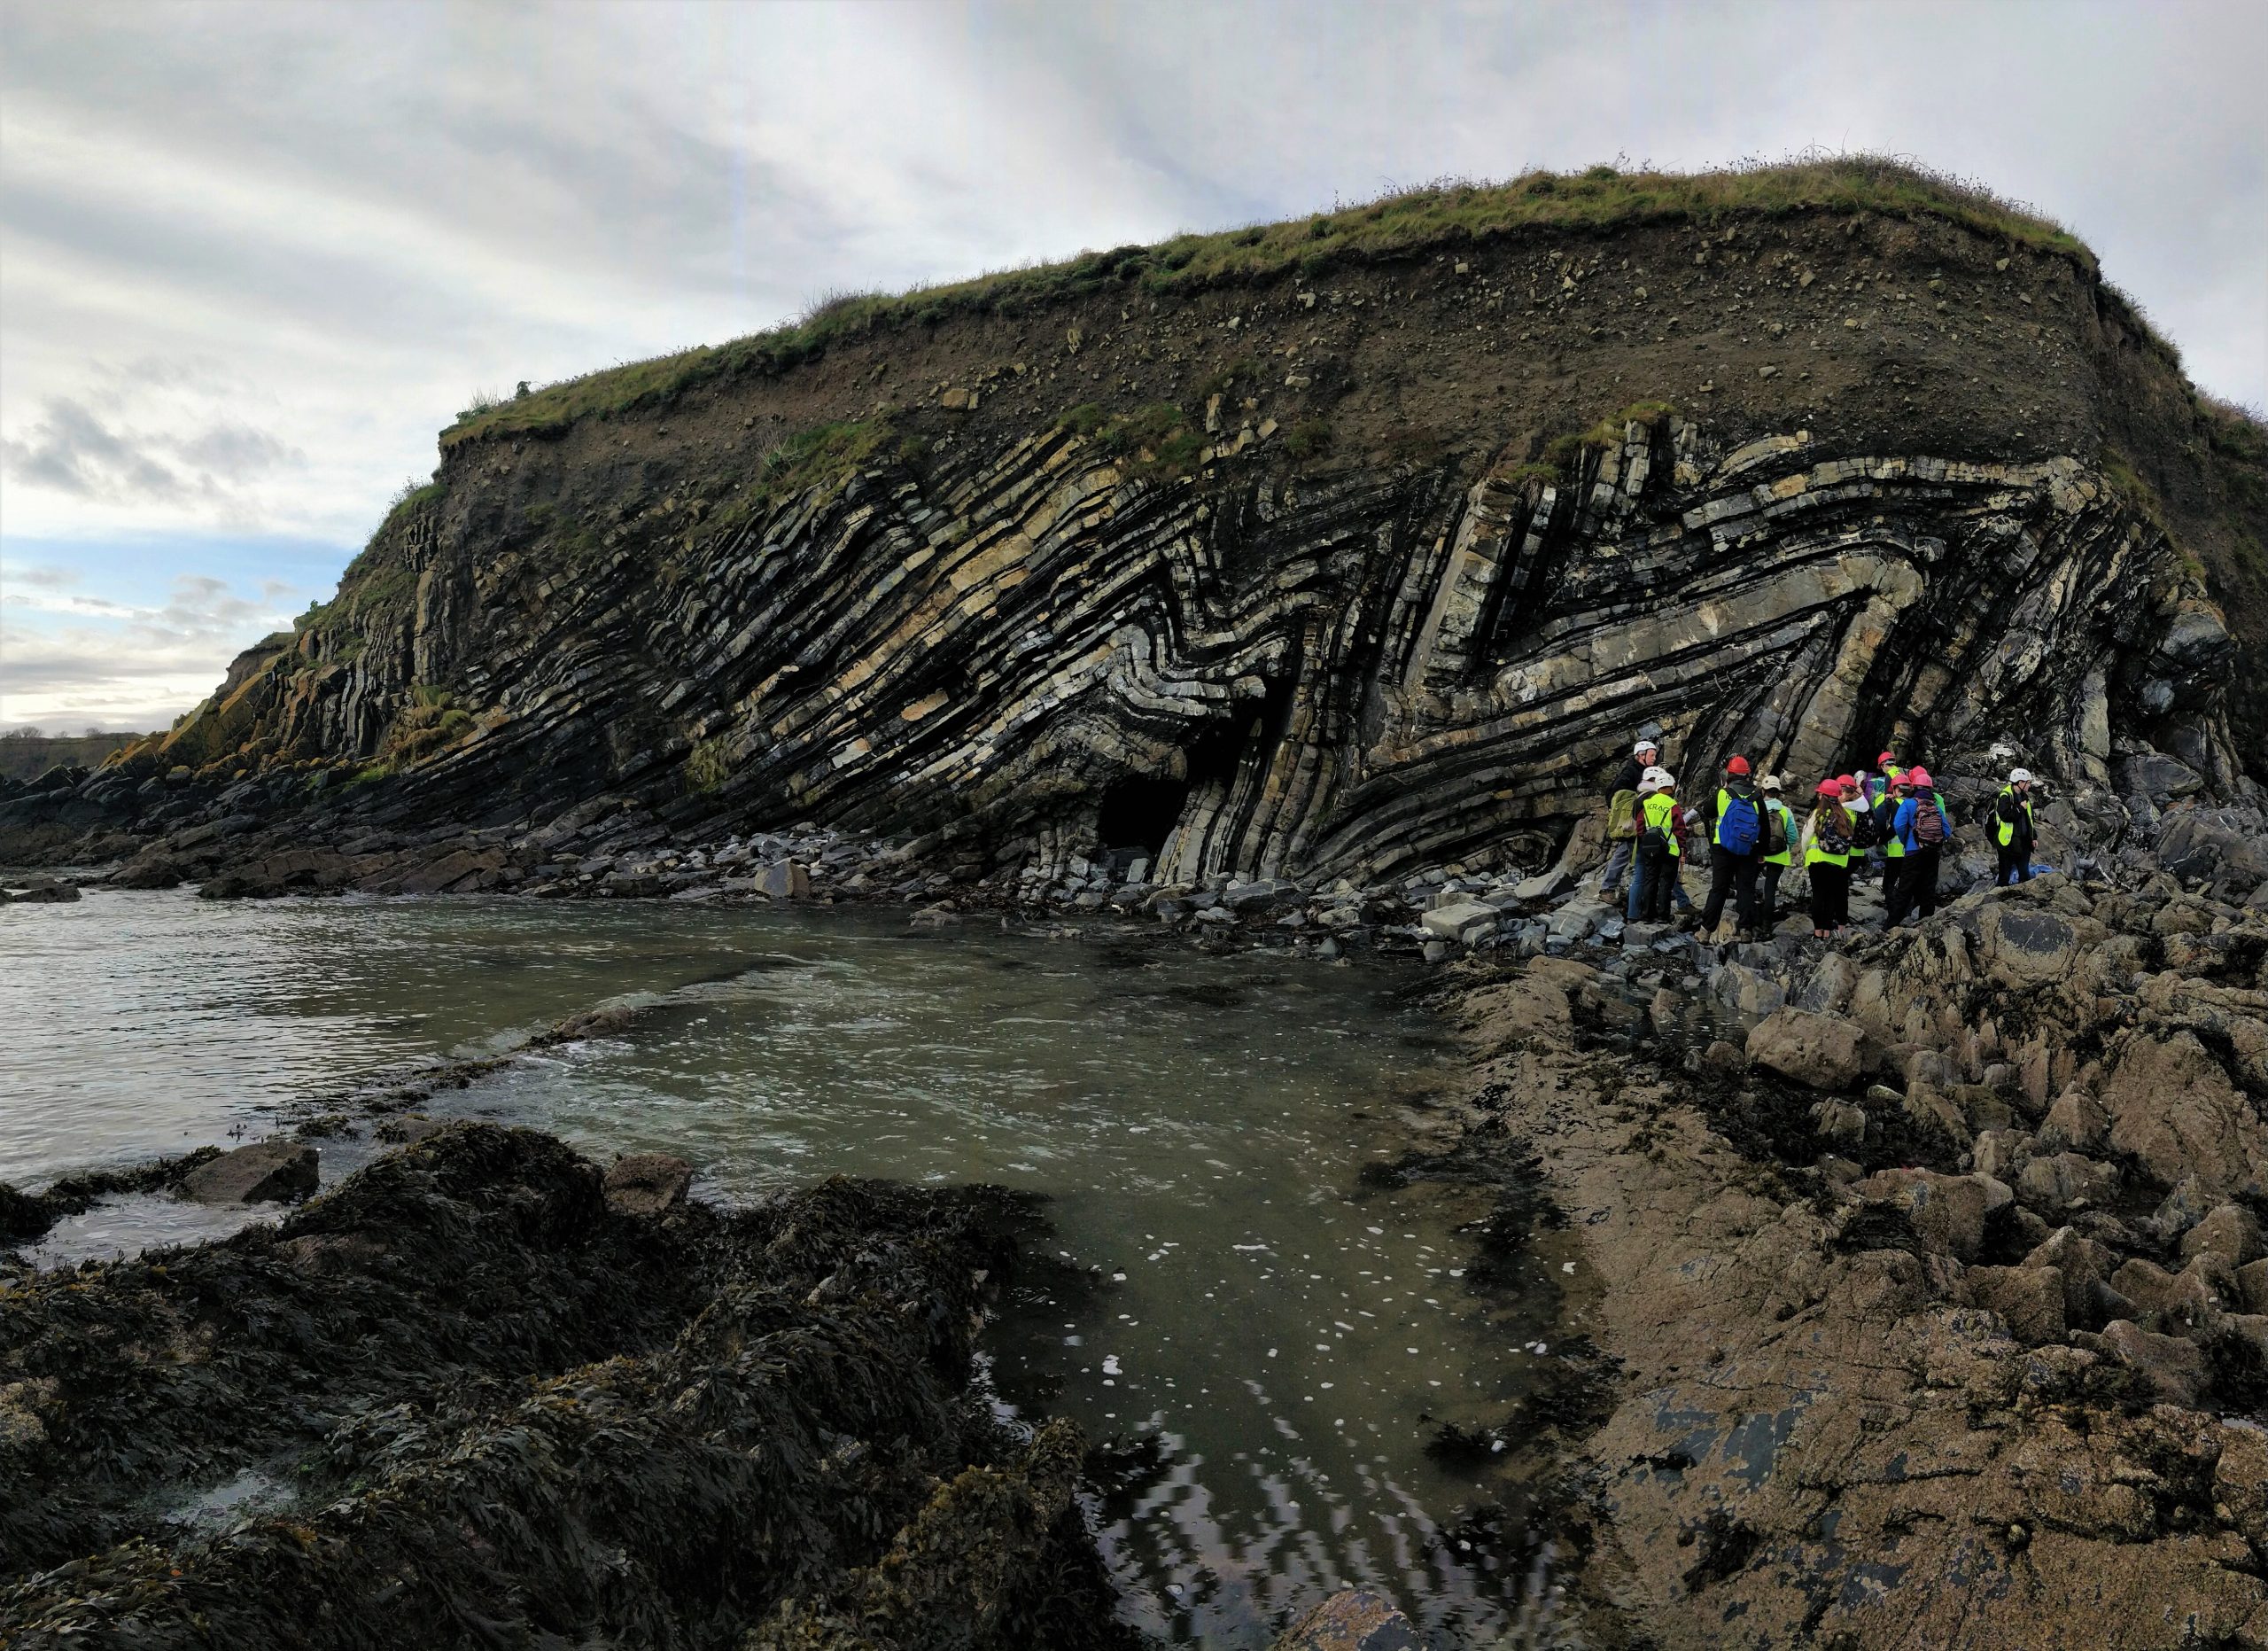
Figure 1.17: A group of women look at geological folds on a rock in Ireland.
Figure 1.18: A large tan concrete dam. The water level is much higher behind the dam than in front of it.
Figure 1.19: A power plant with steam coming out, surrounded by rocky hills on either side.
Figure 1.20: Three rows of rectangular-shaped buildings with the second and third rows of buildings having fallen over.
Figure 1.21: A large hole in the top of a mountain that is filled with a lake. There is also an island in the lake.
Figure 1.22: The rock cycle (clockwise). Magma turns to Igneous rock through crystallization. Igneous rocks turn to sediment through weathering. Sediment turns to sedimentary rocks through transport and deposition and burial and lithification. Sedimentary rocks turn to metamorphic rocks through textural and or chemical damage. Metamorphic rocks turn to magma through melting. Igneous rocks turn to metamorphic rocks through textural and/or chemical damage. metamorphic and sedimentary rocks endure weathering by exhumation of rock back to Earth’s surface.
Figure 1.23: This grey rock has round circles left by raindrops. There is a 3-centimeter scale bar on the upper right of the rock.
Figure 1.24: Grey-and-orange rock with wavy texture.
Figure 1.25: World map with the largest tectonic plates outlined and filled in with a different color for each plate: the Eurasian Plate is colored green, the North American Plate is gray, the Australian Plate is orange, the Filipino Plate is red, the Pacific Plate is yellow, the Juan de Fuca and Cocos Plates are blueish purple, the Nazca Plate is light blue, the Antarctic Plate is dark blue, the Scotia Plate is medium blue, the Caribbean plate is pinkish orange, the South American Plate is purple, the African Plate is dark orange, the Arabian Plate is yellow, and the Indian Plate is dark red.
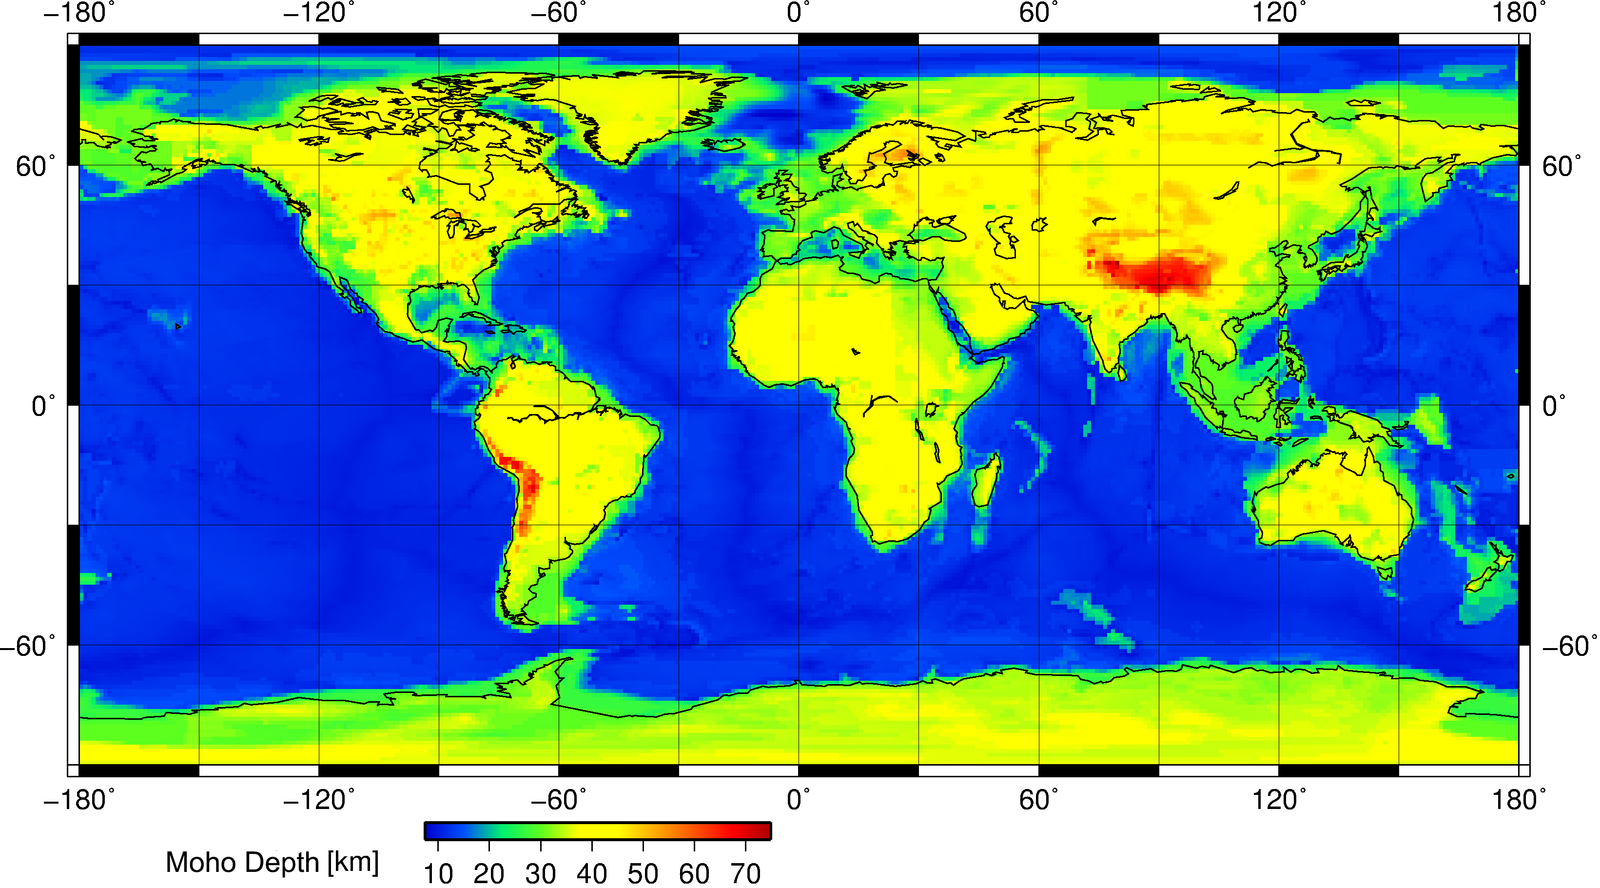
Figure 1.26: World map with the Moho depth color coded on the map: red is the deepest while blue is the shallowest. The Moho is deepest under central Asia and western South America, and the Moho is shallowest under the world ocean basins.
Figure 1.27: From core to surface: Inner core (solid), outer core (liquid), mantle (including asthenosphere), crust (including lithosphere)
Figure 1.28: From oldest to newest time divisions: Hadean, archean, proterozoic, paleozoic, mesozoic, cenozoic. 4550 Ma: formation of the earth. 4527 Ma: formation of the moon.4000 Ma: end of the late heavy bombardment; first life. 3200 Ma: earliest start of photosynthesis. 2300 Ma: atmosphere becomes oxygen-rich; first snowball earth. 750-635 Ma: two snowball earths. 530 Ma: cambrian explosion. 380 Ma: first vertebrate land animals. 230-66 Ma: Non-avian dinosaurs. 2 Ma: first hominins.
Figure 1.29: Precambrian eon is made up of haydean, archean, and proterozoic eons. Phanerozoic eon is made up of paleozoic (permian, pennsylvanian, mississippian, devonian, silurian, ordovician, cambrian periods), mesozoic (cretaceous, jurassic, triassic periods), and cenozoic eras (quaternary and tertiary periods).
Figure 1.30: Woman wearing a red tee shirt and tan pants sitting on a steeply tilted tan rock bed while leaning forward and holding a compass against the face of another steeply tilted tan rock bed in front of her.
Figure 1.31: A group of 12 people stand below a banner that says “T.T. Martin Headquarters Anti-Evolution League ‘The Conflict’ – “Hell & The High School’
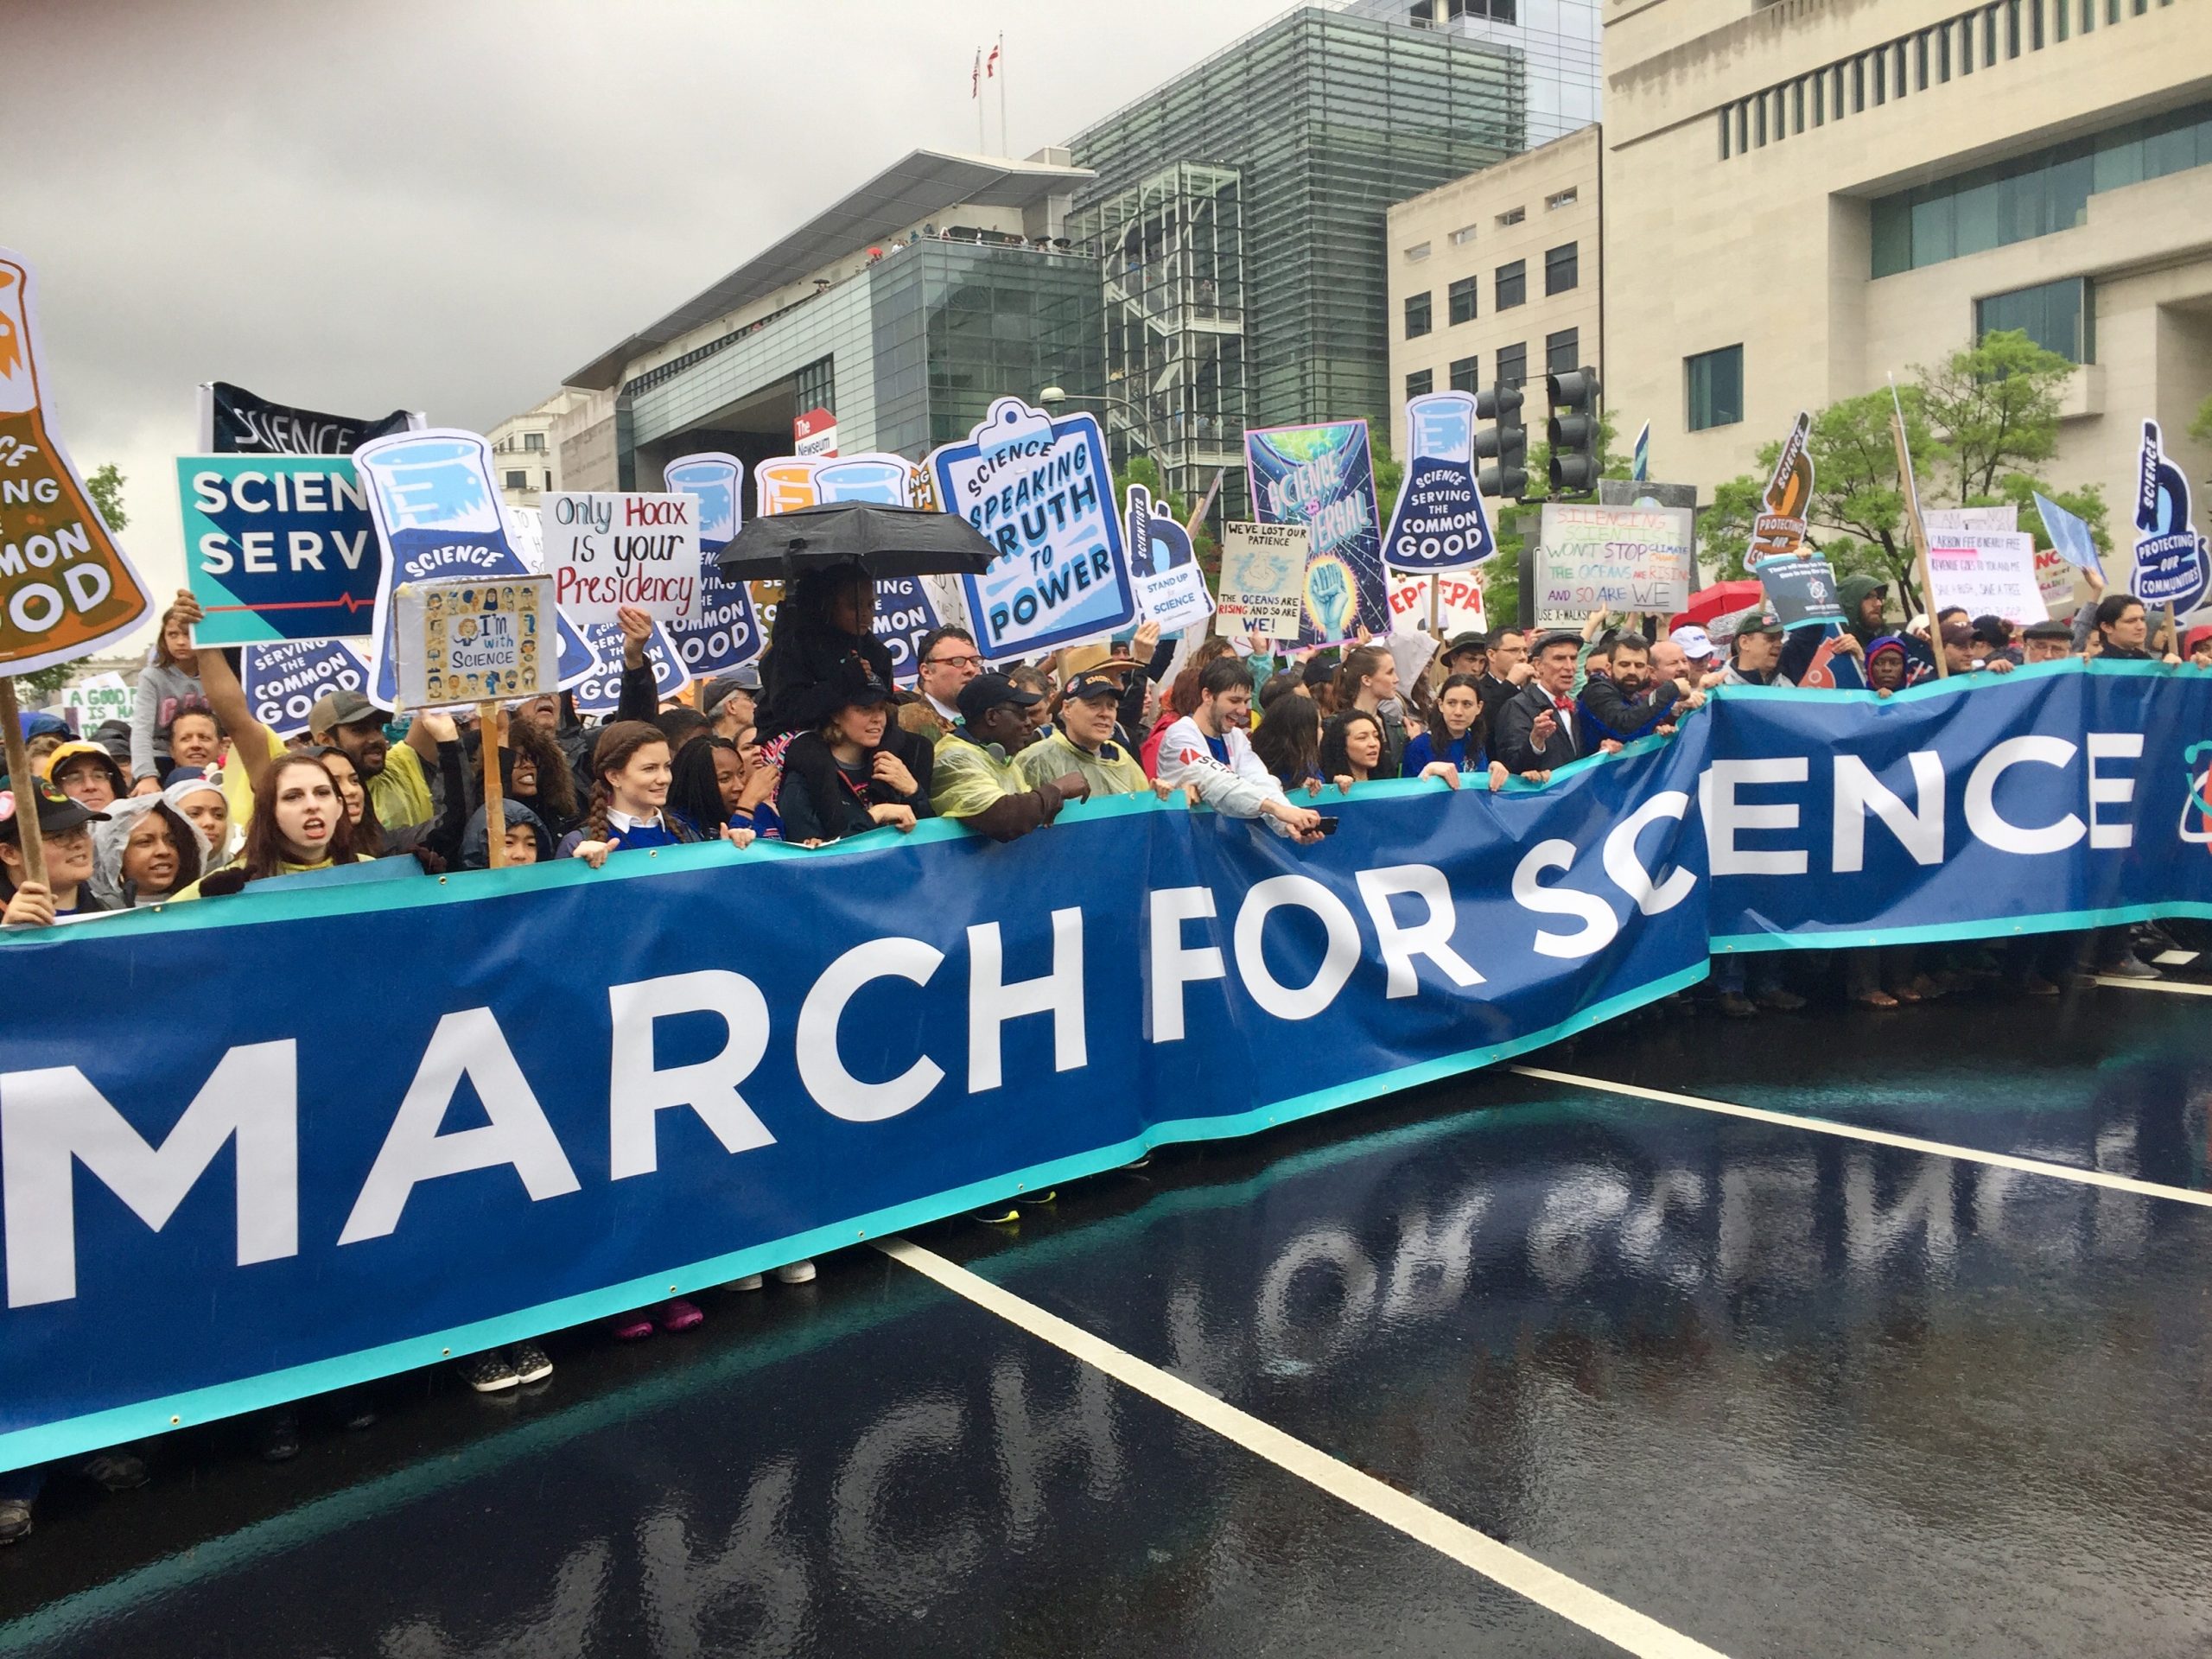
Figure 1.32: Huge crowd of people marching on the street holding a banner that says “March for Science”
Figure 1.33: Shows three pillars labeled “Undermine the Science”, “Claim the Result is Evil”, and “Demand Equal Time”.
Figure 1.34: Cigarettes smoked per person per year and lung cancer deaths per 100,000 people shown on the same timeline. cigarette consumption (men) and lung cancer (men) have the same increasing slope, only lung cancer is 20 years delayed.
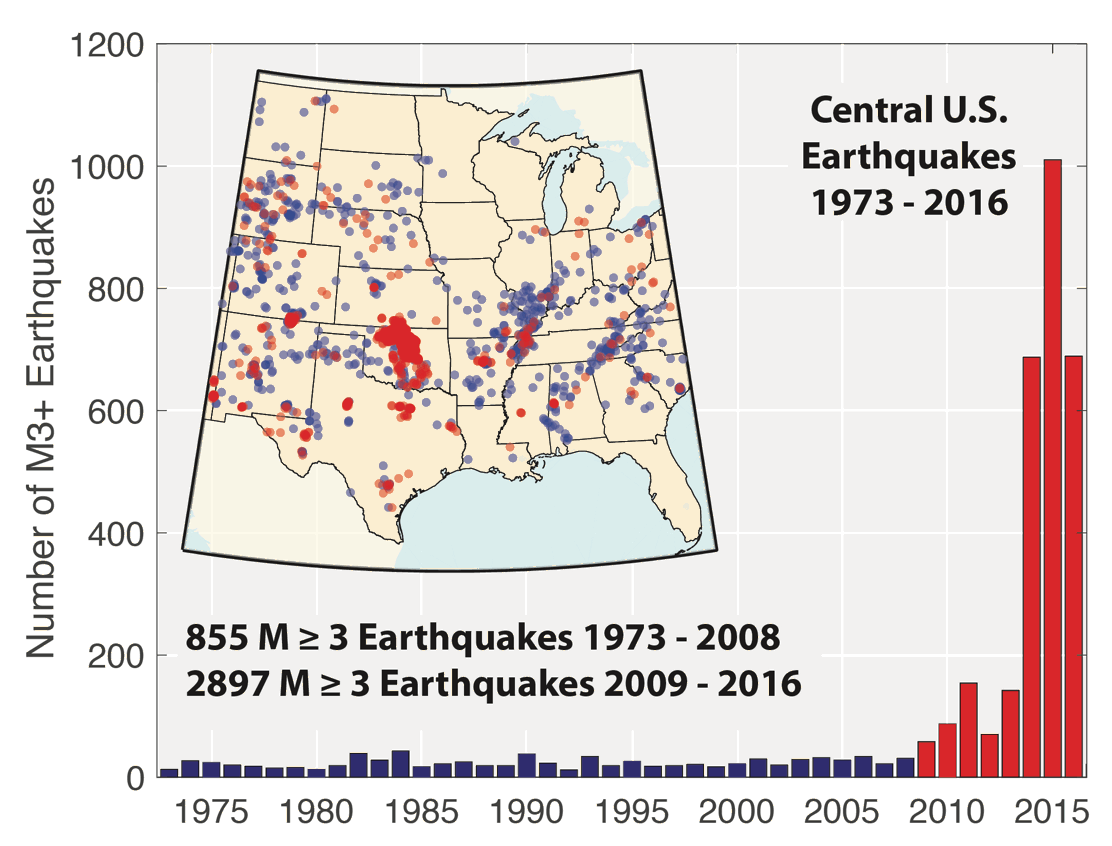
Figure 1.35: A bar graph: the y-axis is “Number of M3+ Earthquakes” with a scale of 0 to 1200, and the x-axis is the year in question with a scale of 1970 to 2020. The bars spike sharply up after the year 2009, with the highest bar peak in 2015. There is also an inset map of the central United States that has dots of locations of earthquakes during this period, color-coded by magnitude. The densest cluster is in Oklahoma.
Figure 1.36: The geological society of America logo
definition
Referring to an observation that is completely free of bias (i.e., anyone would make the same observation).
The act of gathering new information from the senses or from a scientific instrument.
An observation influenced by the observer's personal bias.
An observation based on numerical data. These observations are preferred because they can be used in calculations.
An observation based on non-numerical data. While these types of observations are not preferred, they can still be useful.
The idea that claim in science can be proved wrong with proper evidence.
An accepted scientific idea that explains a process using the best available information.
A method of investigation that claims to be scientific but does not hold up to full scientific scrutiny. Examples include astrology, paranormal studies, young-Earth creationism, and cryptozoology (i.e., the study of creatures like Bigfoot and the Loch Ness Monster).
The branch of science that deals with celestial objects, space, and the physical universe as a whole.
The idea in science that phenomena and ideas need to be scrutinized through hypothesizing, experimentation, and analysis. This can eventually result in a consensus or scientific theory.
A proposed explanation for an observation that can be tested.
A test of an idea in which new information can be gathered to either accept or reject a hypothesis.
A process where experts in a field review and comment on a newly introduced work, typically a part of publication.
Using known truths to develop new truths.
Establishing evidence (including new observations) to infer a possible truth.
While the generic term for a group of planets and other bodies circling a star is planetary system, our planetary system is the only one officially called “Solar System,” because our Sun is sometimes called Sol.
A rock primarily made of sand.
A very fine-grained rock with very thin layering, making it fissile.
Channels of water that flow downhill due to gravity.
A channelled body of water.
Idea championed by James Hutton that the present is the key to the past, meaning the physical laws and processes that existed and operated in the past still exist and operate today.
The idea that large, damaging occurrences are the cause of most geologic events.
An animal that possesses a spinal column or backbone.
When a species no longer exists.
A solid part of the lithosphere that moves as a unit, i.e., the entire plate generally moves the same direction at the same speed.
A divergent boundary within an oceanic plate where new lithosphere and crust is created as the two plates spread apart. "Mid-ocean ridge" and "spreading center" are synonyms.
Symmetric patterns of magnetism occurring around an ocean ridge; created by ocean floor rocks recording changes in Earth's magnetic field.
General term for material suddenly falling (sliding) down a slope due to gravity.
Items that are found within Earth that are valuable and limited. Examples include coal, water, and gold.
Former swamp-derived (plant) material that is part of the rock record.
A liquid fossil fuel derived from shallow marine rocks; also known as crude oil.
A solid material that is typically hard, shiny, malleable, fusible, and ductile, with good electrical and thermal conductivity.
A resource that is not able to be replaced on a human timescale.
A resource that is replaced on a human timescale.
A significant and dangerous event that is part of a natural process.
An interconnected set of parts that combine to make up a whole.
The study of the interaction of the spheres within the system that is the Earth, mainly the study of the hydrosphere, atmosphere, geosphere (lithosphere), and biosphere.
The solid, rocky parts of the Earth, including the crust, mantle, and core. Also referred to as the lithosphere.
The gases that are part of the Earth, which are mainly nitrogen and oxygen.
The part of the Earth composed of water, as a solid, liquid, or gas.
The part of the hydrosphere (water) that is frozen, found mainly at the poles.
One of Earth's interacting spheres; it is composed of all living organisms and the nonliving parts with which they interact.
The concept that any rock type (igneous, sedimentary, or metamorphic) can change into another rock type under the right conditions over geologic time.
Liquid rock within the Earth.
Liquid rock on the surface of the Earth.
The process of liquid rock solidifying into solid rock. Because liquid rock is made of many components, the process is complex, with different components solidifying at different temperatures.
Relating to molten rock.
Breaking rocks into small pieces by chemical or mechanical means.
The transport and movement of weathered sediments.
Pieces of rock that have been weathered and possibly eroded.
Sediment gathering together, typically in a topographic low point.
Referring to locations that are under ocean water at all times.
Water that is below the surface.
Sediment being squeezed together into a coherent mass.
Sediment becoming "glued" together via mineralization, typically calcite and quartz from groundwater fluids.
The process of turning sediment into sedimentary rock, including deposition, compaction, and cementation.
Rocks that are formed by sedimentary processes, such as sediment lithification and precipitation from solution.
Sedimentary rocks that form through precipitation, from solution.
Referring to rocks and minerals that are changed by heat and pressure within the Earth (a process known as metamorphism).
The theory that the outer layer of the Earth (the lithosphere) is broken into several plates that move relative to one another, causing the major topographic features of Earth (e.g., mountains, oceans) as well as most earthquakes and volcanoes.
Relating to the movement of plates of lithosphere.
A ductile physical layer of the Earth, below the lithosphere. Movement within the asthenosphere is the main driver of plate motion, pushing the overriding lithosphere.
The mineral makeup of a rock (i.e., which minerals are found within a rock).
The outermost chemical layer of the Earth, defined by its low density and higher concentrations of lighter elements. The crust has two types: continental, which is thicker, more ductile, and has lower density, and oceanic, which is thinner, more brittle, and has greater density.
The layers of igneous, sedimentary, and metamorphic rocks that form the continents; much thicker than oceanic crust; contains higher concentrations of very light elements like K, Na, and Ca, and is the lowest density rocky layer of Earth, with an average composition similar to granite.
The thin, outer layer of the Earth that makes up the rocky bottom of ocean basins; much thinner (but denser) than continental crust; made of rocks similar to basalt, and as it cools, it becomes more dense.
General name of a mafic rock that is extrusive, usually with a black groundmass.
The outermost physical layer of the Earth, made of the entire crust and upper mantle. It is brittle and broken into a series of plates, which move in various ways (relative to one another), causing the features described by the theory of plate tectonics.
Middle chemical layer of the Earth, made of mainly iron and magnesium silicates. It is generally denser than the crust (except for older oceanic crust) and less dense than the core.
An intrusive ultramafic rock that is the main component of the mantle. The minerals in peridotite are typically olivine with some pyroxene.
The innermost chemical layer of the Earth, made chiefly of iron and nickel, with both liquid and solid components.
The liquid outer physical layer of the core. Movement within the outer core is believed to be responsible for Earth's magnetic field and flips of the magnetic field.
The innermost physical layer of the Earth, which is solid.
The largest span of time recognized by geologists, larger than an era. We are currently in the Phanerozoic Eon.
A term for the collective time before the Phanerozoic (pre-541 million years ago), including the Hadean, Archean, and Proterozoic. Known for a lack of easy-to-find fossils.
Meaning "visible life," the most recent eon in Earth's history, starting at 541 million years ago and extending through the present. Known for the diversification and evolution of life, along with the formation of Pangea.
Any evidence of ancient life.
The second-largest span of time recognized by geologists; smaller than an eon, larger than a period. We are currently in the Cenozoic Era.
Meaning "ancient life," the era that started 541 million years ago and ended 252 million years ago. Vertebrates (including fish, amphibians, and reptiles) and arthropods (including insects) evolved and diversified throughout the Paleozoic. Pangea formed near the era's end.
Meaning "middle life," it is the middle era of the Phanerozoic, starting 252 million years ago and ending 66 million years ago. Known as the Age of Reptiles.
A pronounced increase in the extinction rate, typically caused by significant environmental change. There have been five mass extinctions in geologic history, with a sixth suggested to be currently occurring.
The last (and current) era of the Phanerozoic Eon, starting 66 million years ago and spanning through the present.
The average diameter of a grain of sediment, ranging from small, fine-grained (e.g., clay, silt) to large, coarse-grained (e.g., boulder).
A system for detecting the presence, direction, distance, and speed of aircraft, ships, and other objects by sending out pulses of high-frequency electromagnetic waves that are reflected off the object back to the source. It is an acronym for "radio detection and ranging."
Deposition and erosion tied to glacier movement.
The act of purposely ignoring or dissenting from science for political or cultural gains.