16 Energy and Mineral Resources
Learning Objectives
By the end of this chapter, students should be able to:
- Describe how a renewable resource is different from a nonrenewable resource.
- Compare the pros and cons of extracting and using fossil fuels and conventional and unconventional petroleum sources.
- Describe how metallic minerals are formed and extracted.
- Understand how society uses nonmetallic mineral resources.
- Compare the pros and cons of renewable energy sources, including solar, wind, hydroelectric, geothermal, and biomass.
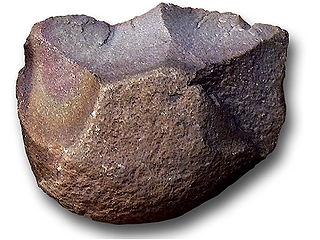
This text has previously discussed geology’s pioneers such as scientists James Hutton and Charles Lyell, but the first real “geologists” were the hominids who picked up stones and began the Stone Age. Maybe stones were first used as curiosity pieces, maybe as weapons, but ultimately, they were used as tools. This was the Paleolithic Period, the beginning of geologic study, and it dates back 2.6 million years to East Africa.
In modern times, geologic knowledge is important for locating economically valuable materials for society’s use. In fact, all things we use come from only three sources; they are farmed, hunted or fished, or mined. At the turn of the twentieth century, speculation was rampant that food supplies would not keep pace with world demand, suggesting the need to develop artificial fertilizers.
Fertilizer ingredients have multiple sources. Nitrogen is processed from the atmosphere using the Haber process for the manufacture of ammonia from atmospheric nitrogen and hydrogen; potassium comes from the hydrosphere, such as lakes or ocean evaporation; and phosphorus is mined from the lithosphere in minerals like apatite from phosphorite, which is found in Florida, North Carolina, Idaho, Utah, and around the world. Thus, without the mining and processing of natural materials, modern civilization would not exist. Indeed, geologists are essential in this process.
Resources generally come in two major categories: renewable and nonrenewable. Renewable resources can be reused over and over, or their availability can be replicated over a short human life span; nonrenewable resources cannot.
16.1 Nonrenewable Resources
Nonrenewable resources cannot be replenished at a sustainable rate. They are finite within human time frames. Many nonrenewable resources come from planetary, tectonic, or long-term biologic processes and include materials such as gold, lead, copper, diamonds, marble, sand, natural gas, oil, and coal. Most nonrenewable resources include specific concentrated elements listed on the periodic table; some are compounds of those elements. For example, if society needs iron (Fe) sources, then an exploration geologist will search for iron-rich deposits that can be economically extracted. Nonrenewable resources may be abandoned when other materials become cheaper or serve a better purpose. For example, coal is abundantly available in England and other nations, but because oil and natural gas are available at a lower cost and lower environmental impact, coal use has decreased. Economic competition among nonrenewable resources is shifting use away from coal in many developed countries.
16.1.1 Mining
Mining is defined as extracting valuable materials from the Earth for society’s use. Usually, these include solid materials such as gold, iron, coal, diamond, sand, and gravel, but materials can also include fluid resources such as oil and natural gas. Modern mining has a long relationship with modern society. The oldest mine dates back 40,000 years to the Lion Cavern in Swaziland, where there is evidence of concentrated digging into the Earth for hematite, an important iron ore used as red dye. Resources extracted by mining are generally considered to be nonrenewable.
16.1.2 Ore
Earth’s materials include the periodic table elements. However, it is rare that these elements are concentrated to the point where it is profitable to extract and process the material into usable products. Any place where a valuable material is concentrated is a geologic and geochemical anomaly. A body of material from which one or more valuable substances can be mined at a profit is called an ore deposit. Typically, the term ore is used for only metal-bearing minerals, but it can be applied to valuable nonrenewable resource concentrations such as fossil fuels, building stones, and other nonmetal deposits, even groundwater. If a metal-bearing resource is not profitable to mine, it is referred to as a mineral deposit. The term natural resource is more common than the term ore for non-metal-bearing materials.
It is implicit that the technology to mine is available, economic conditions are suitable, and political, social, and environmental considerations are satisfied in order to classify a natural resource deposit as ore. Depending on the substance, it can be concentrated in a narrow vein or distributed over a large area as a low-concentration ore. Some materials are mined directly from bodies of water (e.g., sylvite for potassium; water through desalination) and the atmosphere (e.g., nitrogen for fertilizers). These differences lead to various methods of mining and differences in terminology depending on the certainty. Ore mineral resource is used to describe an indication of ore that is potentially extractable, and the term ore mineral reserve is used for a well-defined (proven), profitable amount of extractable ore.
16.1.3 Mining Techniques
The mining style is determined by technology, social license, and economics. It is in the best interest of the company extracting the resources to do so in a cost-effective way. Fluid resources, such as oil and gas, are extracted by drilling wells and pumping. Over the years, drilling has evolved into a complex discipline in which directional drilling can produce multiple bifurcations and curves originating from a single drill collar at the surface. Using geophysical tools like seismic imaging, geologists can pinpoint resources and extract efficiently.
Solid resources are extracted by two principal methods of which there are many variants. Surface mining is used to remove material from the outermost part of the Earth. Underground mining accesses deep pockets of a resource through tunnels and shafts.
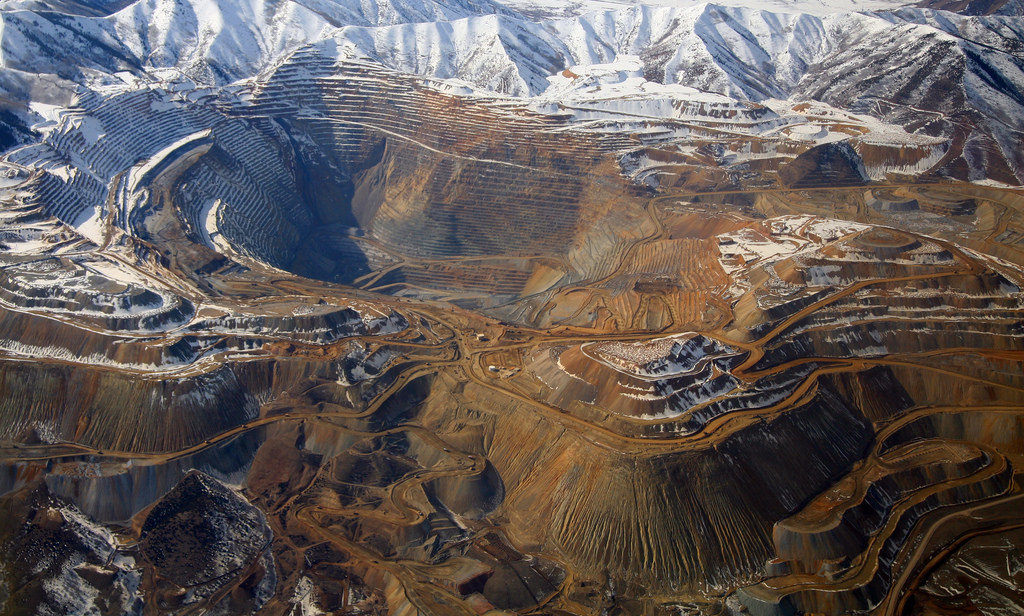
Open-pit mining is a type of surface mining that requires careful study of the ore body through surface mapping and drilling exploratory cores. The pit is progressively deepened through additional mining cuts to extract the ore. Typically, the pit’s walls are as steep as can be safely managed. Once the pit is deepened, widening the top is very expensive. A steep wall is thus an engineering balance between efficient and profitable mining (from the company’s point of view) and mass wasting (the angle of repose, from a safety point of view) so that there is less waste to remove. The waste is called nonvaluable rock or overburden, and moving it is costly. Occasionally, landslides do occur, such as the very large landslide in the Kennecott Bingham Canyon mine, Utah, in 2013. These events are costly and dangerous. The job of engineering geologists is to carefully monitor the mine; when company management heeds their warnings, there is ample time and action to avoid or prepare for any slide.
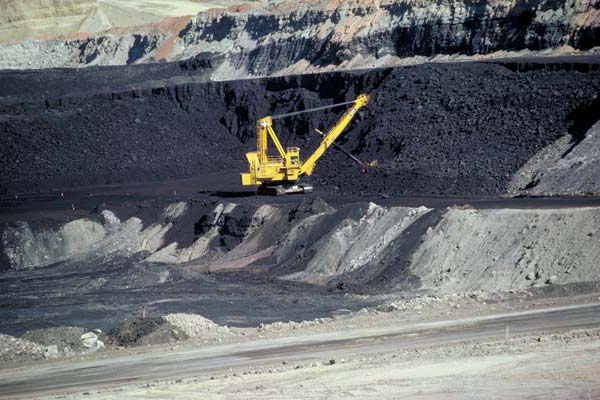
Strip mining and mountaintop mining are surface mining techniques that are used to mine resources that cover large areas, especially layered resources such as coal. Strip mining uses large machines to remove layers of soil and rock, known as overburden, to expose the resource just below the surface. In mountaintop removal mining, an entire mountaintop is removed to access the ore below. After the mining is finished, the disturbed area can be re-covered with topsoil, and the area is replanted. However, the topography of the mountain is permanently altered. Surface mining can cause severe negative environmental impacts due to the large surface footprint that’s disturbed. It has been known to destroy natural communities over large areas, trigger erosion, and pollute water, threatening the health and safety of nearby communities.
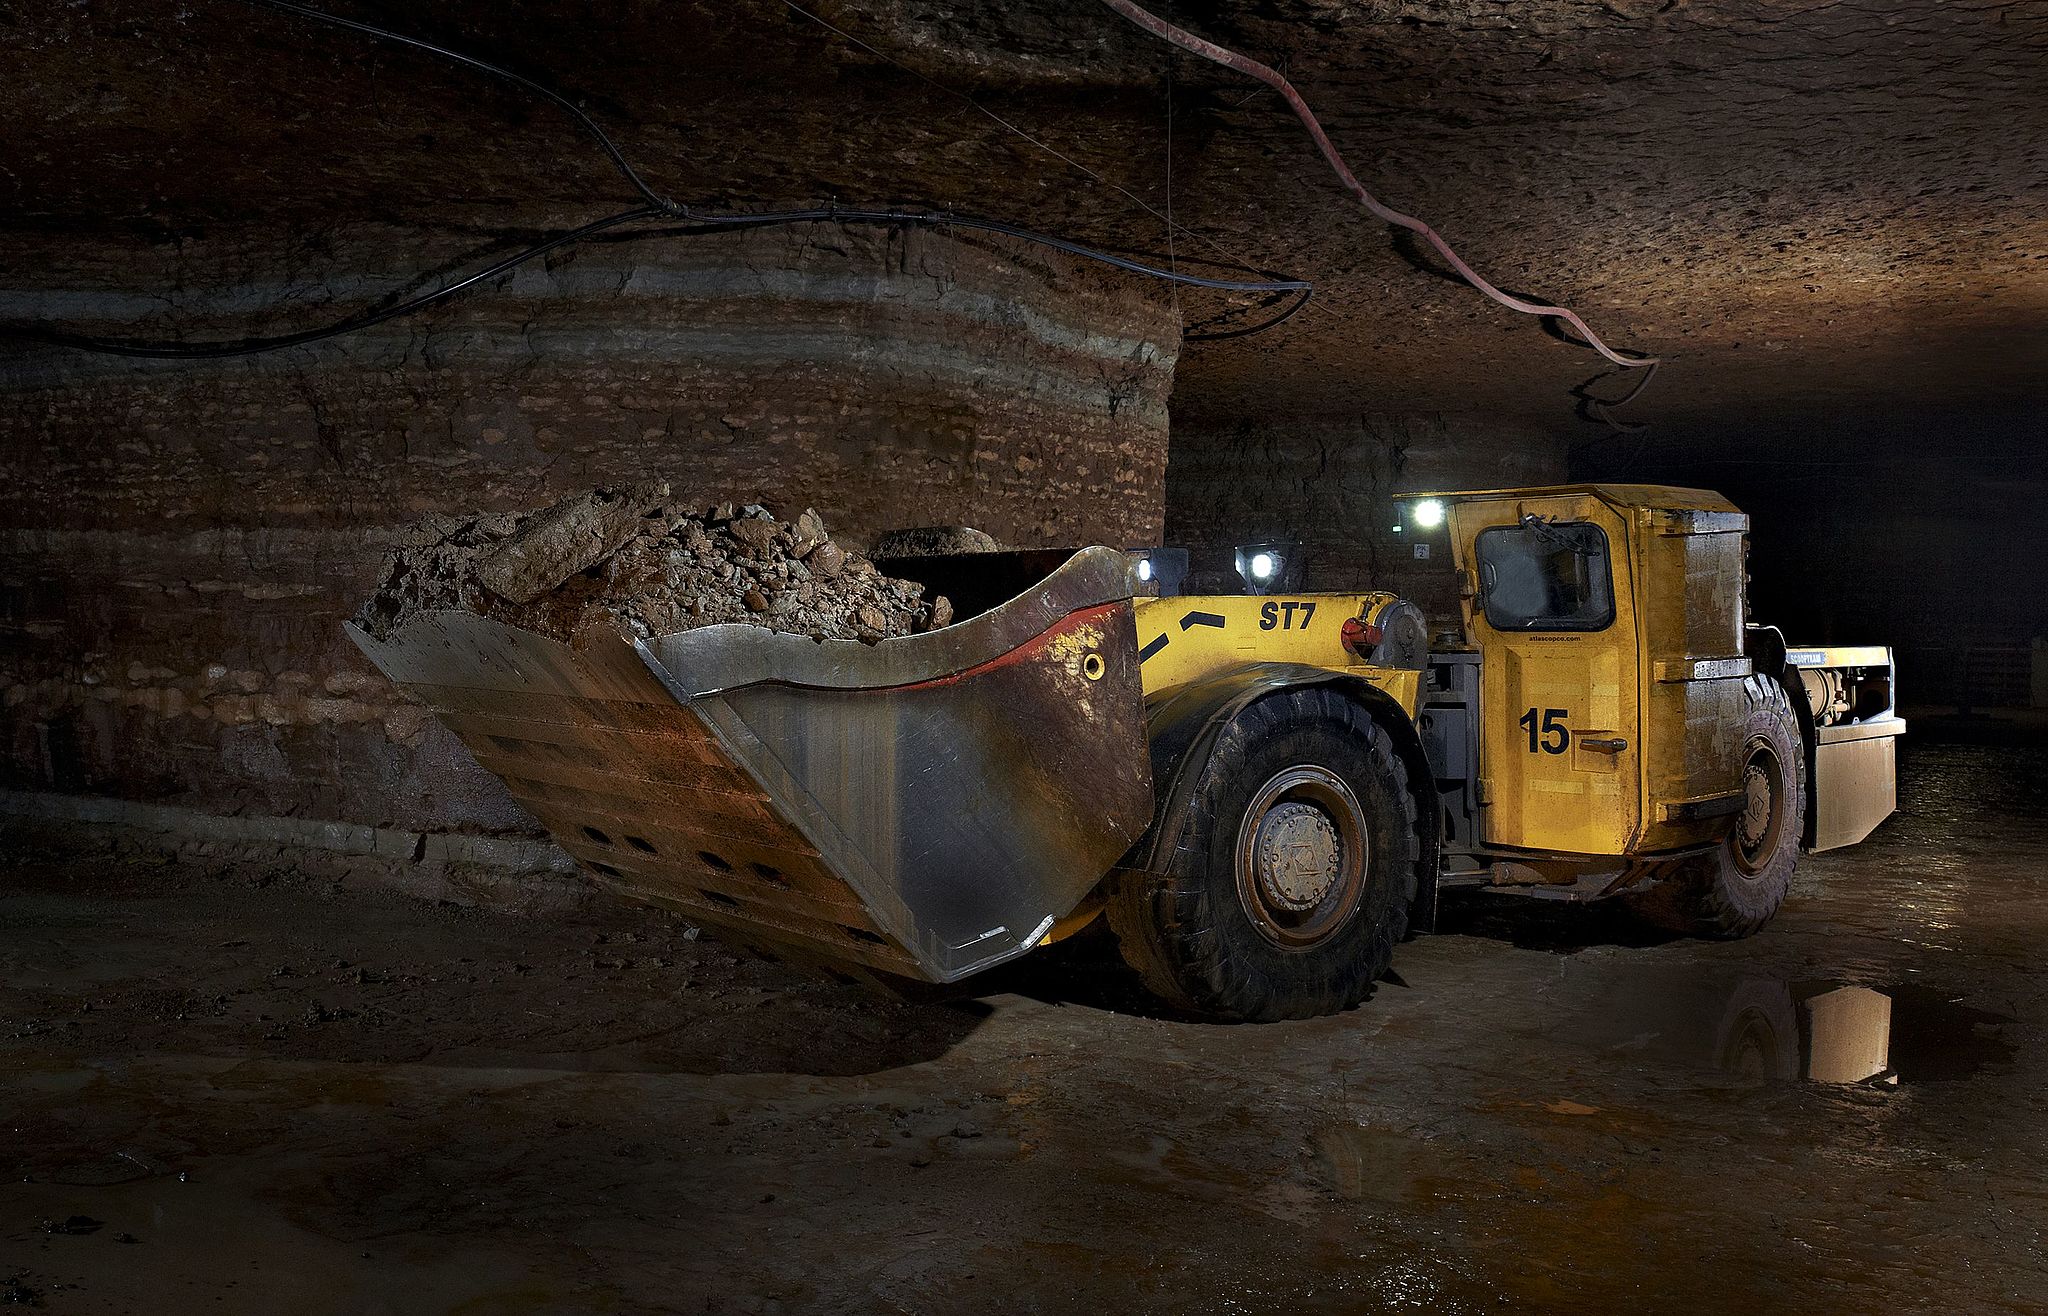
Underground mining is a method often used to mine higher-grade, more localized, or very concentrated resources. In some examples, geologists mine some underground ore minerals by introducing chemical agents, which dissolve the target mineral. Then, they bring the solution to the surface, where precipitation extracts the material. But more often, a mining shaft tunnel or a large network of these shafts and tunnels is dug to access the material. The decision to mine underground or from Earth’s surface is dictated by the ore deposit’s concentration, depth, geometry, land-use policies, economics, surrounding rock strength, and physical access to the ore. For example, using surface mining techniques for deeper deposits might require removing too much material, the necessary method may be too dangerous or impractical, removing the entire overburden may be too expensive, or the mining footprint would be too large. These factors may prevent geologists from surface mining materials and cause a project to be mined underground. The mining method and its feasibility depends on the commodity’s price and the cost of the technology needed to remove it and deliver it to market. Thus, mines and the towns that support them come and go as the commodity price varies. Conversely, technological advances and market demands may reopen mines and revive ghost towns.
There are also significant health effects and risks to miners. Traditional underground mining is risky to mine workers due to the risk of entrapment or death. Twenty-nine miners died on April 5, 2010, in an explosion at the Upper Big Branch coal mine in West Virginia, contributing to an uptick in mining-related deaths in the US between 2009 and 2010. In other countries with fewer safety regulations, accidents occur more frequently. In October 2022, for example, 41 were killed in a Turkish mine explosion. And in the same country just eight years prior, the Soma mine disaster took place on May 13, 2014, in which 301 people died. There is also risk of getting black lung disease (pneumoconiosis) in underground mining. This lung disease is caused by inhaling coal dust over a long time. It causes coughing and shortness of breath. If exposure is stopped, the outcome is good. However, the complicated form may cause shortness of breath that worsens.
16.1.4 Concentrating and Refining
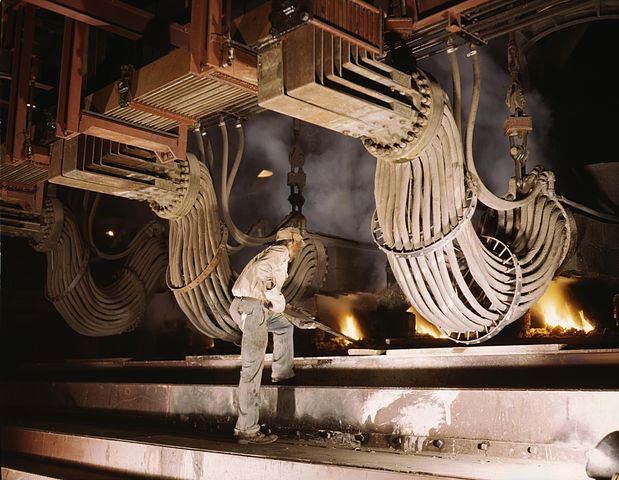
All ore minerals occur mixed with less desirable components called gangue. The process of physically separating gangue minerals from ore-bearing minerals is called concentrating. Separating a desired element from a host mineral by chemical means, including heating, is called smelting. Finally, taking a metal such as copper and removing other trace metals such as gold or silver is done through the refining process. Typically, refining is done one of three ways: (1) Materials can either be mechanically separated and processed based on the ore mineral’s unique physical properties, such as recovering placer gold based on its high density; (2) Materials can be heated to chemically separate desired components, such as refining crude oil into gasoline; and (3) Materials can be smelted, in which controlled chemical reactions unbind metals from the minerals in which they are contained, such as when copper is taken out of chalcopyrite (CuFeS2). Mining, concentrating, smelting, and refining processes require enormous energy. Continual advances in metallurgy and mining practice strive to develop more energy-efficient and environmentally benign processes and practices.

Take this quiz to check your comprehension of this section.
If you are using an offline version of this text, access the quiz for Section 16.1 via the QR code.
16.2 Fossil Fuels
Fossil fuels are extractable sources of stored energy that were created by ancient ecosystems. The natural resources that typically fall under this category are coal, oil, and natural gas. These resources were originally formed via photosynthesis by living organisms such as plants, phytoplankton, algae, and cyanobacteria. This energy is actually fossil solar energy, since the Sun’s ancient energy was converted by ancient organisms into tissues that preserved the chemical energy within the fossil fuel. Of course, as the energy is used, carbon enters the atmosphere as CO2—just like photosynthetic respiration today—causing climate consequences (see Chapter 15). Today, humanity uses fossil fuels for most of the world’s energy.
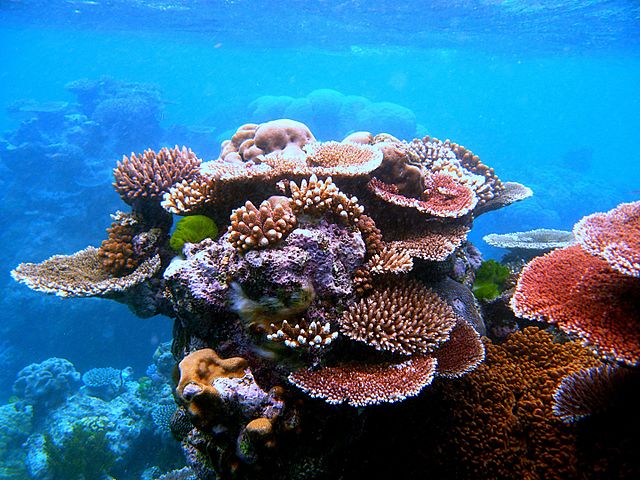
Converting solar energy by living organisms into hydrocarbon fossil fuels is a complex process. As organisms die, they decompose slowly, usually due to being buried rapidly, and the chemical energy stored within the organisms’ tissues is buried within surrounding geologic materials. All fossil fuels contain carbon that was produced in an ancient environment. In environments rich with organic matter, such as swamps, coral reefs, and planktonic blooms, there is a higher potential for fossil fuels to accumulate. Indeed, there is some evidence that over geologic time, organic hydrocarbon fossil fuel material was highly produced globally. Lack of oxygen and moderate temperatures in the environment seem to help preserve these organic substances. The heat and pressure applied to organic material after it is buried contribute to transforming it into higher-quality materials, such as brown coal to anthracite and oil to gas. Heat and pressure can also cause mobile materials to migrate to conditions suitable for extraction.
16.2.1 Oil and Gas
Petroleum is principally derived from organic-rich shallow marine sedimentary deposits where the remains of microorganisms like plankton accumulated in fine-grained sediments. Petroleum’s liquid component is called oil, and its gas component is called natural gas, which is mostly made up of methane (CH4). As rocks such as shale, mudstone, or limestone lithify, the increasing pressure and temperature cause the oil and gas to be squeezed out and migrate from the source rock to a different rock unit higher in the rock column. Similar to the discussion of good aquifers in Chapter 11, if that rock is a sandstone, limestone, or other porous and permeable rock, and if it is involved in a suitable stratigraphic or structural trapping process, then that rock can act as an oil and gas reservoir.
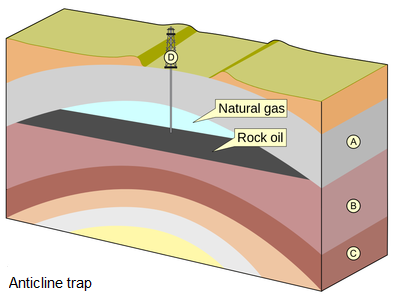
A trap is a combination of a subsurface geologic structure, a porous and permeable rock, and an impervious layer that helps block oil and gas from moving further, which concentrates it for humans to extract later. A trap develops due to many different geologic situations. Examples include an anticline or domal structure, an impermeable salt dome, or a fault-bounded stratigraphic block, which is porous rock next to nonporous rock. The different traps have one thing in common: they pool fluid fossil fuels into a configuration in which extracting it is more likely to be profitable. The presence of oil or gas in strata outside of a trap renders it less viable to extract.
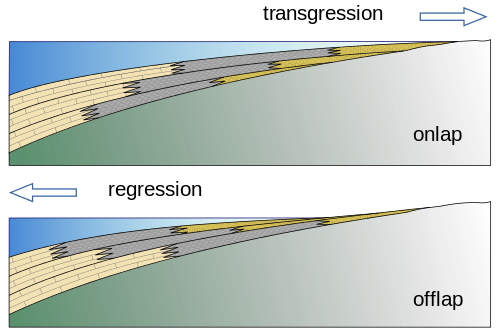
Sequence stratigraphy is a branch of geology that studies sedimentary facies both horizontally and vertically and is devoted to understanding how sea level changes create organic-rich shallow marine muds, carbonates, and sands in areas that are close to each other. For example, shoreline environments may have beaches, lagoons, reefs, nearshore and offshore deposits, all next to each other. Beach sand, lagoonal and nearshore muds, and coral reef layers accumulate into sediments that include sandstones—good reservoir rocks— next to mudstones and then limestones, both of which are potential source rocks. As sea level either rises or falls, the shoreline’s location changes, and the sand, mud, and reef locations shift with it (see the figure). This places oil- and gas-producing rocks, such as mudstones and limestones, next to oil and gas reservoirs, such as sandstones and some limestones. Understanding how the lithology and the facies/stratigraphic relationships interplay is very important in finding new petroleum resources. Using sequence stratigraphy as a model allows geologists to predict favorable locations of the source rock and reservoir.
16.2.2 Tar Sands
Conventional oil and gas, which are pumped from a reservoir, are not the only way to obtain hydrocarbons. There are a few fuel sources known as unconventional petroleum sources. However, they are becoming more important as conventional sources become scarce. Tar sands, or oil sands, are sandstones that contain petroleum products that are highly viscous, like tar, and thus cannot be drilled and pumped out of the ground readily like conventional oil. This unconventional fossil fuel is bitumen, which can be pumped as a fluid only at very low recovery rates and only when heated or mixed with solvents. Therefore, using steam and solvent injections or directly mining tar sands to process later are ways to extract the tar from the sands. Alberta, Canada, is known to have the largest tar sand reserves in the world. As with ores, an energy resource becomes uneconomic if the total extraction and processing costs exceed the extracted material’s sales revenue. Environmental costs may also contribute to a resource becoming uneconomic.
16.2.3 Oil Shale
Oil shale, or tight oil, is a fine-grained sedimentary rock that has significant petroleum or natural gas quantities locked tightly in the sediment. Shale has high porosity but very low permeability and is a common fossil fuel source rock. To extract the oil directly from the shale, the material has to be mined and heated, which, like with tar sands, is expensive and typically has a negative environmental impact.
16.2.4 Fracking
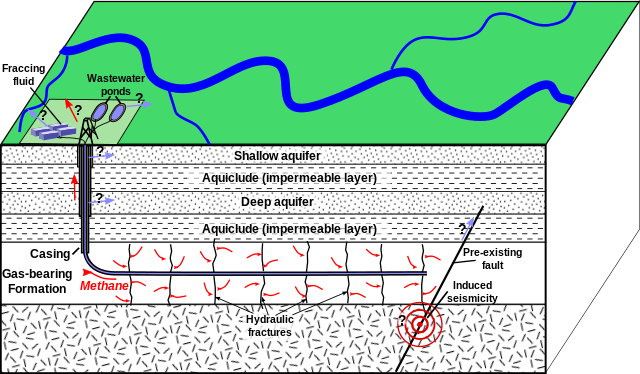
Another process used to extract the oil and gas from shale and other unconventional tight resources is called hydraulic fracturing, better known as fracking. In this method, high-pressure water, sand grains, and added chemicals are injected and pumped underground. The high pressure creates and holds open fractures in the rocks, which help release the hard-to-access mostly natural gas fluids. Fracking is more useful in tighter sediments, especially shale, which has a high porosity to store the hydrocarbons but low permeability to allow transmission of the hydrocarbons. Fracking has become controversial because its methods contaminate groundwater and induce seismic activity. This has created much controversy centered around public concerns, political concerns, and energy value.
16.2.5 Coal
Coal comes from fossilized swamps, though some older coal deposits that predate terrestrial plants are presumed to come from algal buildups. Coal is chiefly carbon, hydrogen, nitrogen, sulfur, and oxygen, with minor amounts of other elements. As plant material is incorporated into sediments, heat and pressure cause several changes that concentrate the fixed carbon, which is the coal’s combustible portion. So, the more heat and pressure that coal undergoes, the greater its carbon concentration and fuel value and the more desirable its coal.
This is the general sequence of a swamp progressing through the various stages of coal formation and becoming more concentrated in carbon: Swamp → Peat → Lignite → Sub-bituminous → Bituminous → Anthracite → Graphite. As swamp materials collect on the swamp floor and are buried under accumulating materials, they first turn to peat.
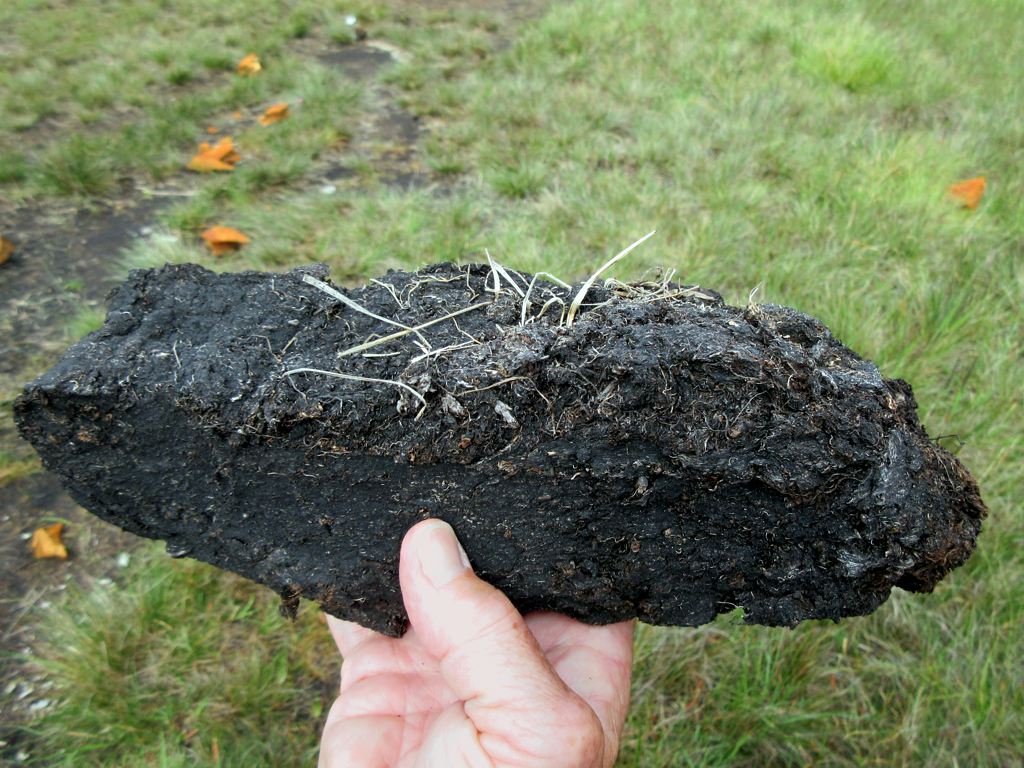
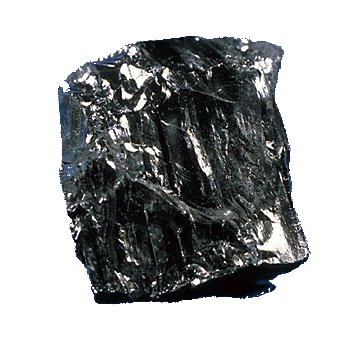
Peat itself is an economic fuel in some locations like the British Isles and Scandinavia. As lithification occurs, peat turns to lignite. With increasing heat and pressure, lignite turns to sub-bituminous coal, bituminous coal, and then, in a process like ]metamorphism, anthracite. Anthracite is the highest metamorphic grade and most desirable coal since it provides the highest energy output. With even more heat and pressure driving out all the volatiles and leaving pure carbon, anthracite can become graphite.
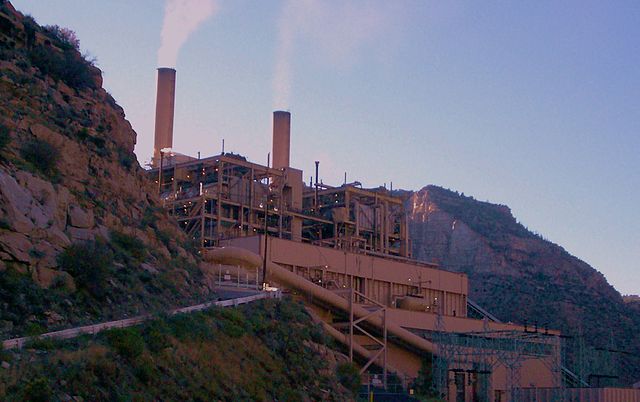
Humans have used coal for at least 6,000 years, mainly as a fuel source. Coal resources in Wales are often cited as a primary reason for Britain’s rise, and later, for the United States’ rise during the Industrial Revolution. According to the US Energy Information Administration, US coal production has decreased due to competing energy sources’ cheaper prices and due to society recognizing its negative environmental impacts, including increased very fine-grained particulate matter as an air pollutant, greenhouse gases, acid rain, and heavy metal pollution. Seen from this perspective, the coal industry as a source of fossil energy is unlikely to be revived.
As the world transitions away from fossil fuels like coal and as manufacturing seeks materials that are stronger, more flexible, and lighter than steel, including carbon fiber, for many applications, current research is exploring coal as a source of this carbon.

Take this quiz to check your comprehension of this section.
If you are using an offline version of this text, access the quiz for Section 16.2 via the QR code.
16.3 Mineral Resources
Mineral resources, while principally nonrenewable, are generally placed in two main categories: metallic, which contain metals, and nonmetallic, which contain other useful materials. Most mining has been traditionally focused on extracting metallic minerals. Human society has advanced significantly because we’ve developed the knowledge and technologies to yield metal from the Earth. This knowledge has allowed humans to build the machines, buildings, and monetary systems that dominate our world today. Locating and recovering these metals has been a key facet of geologic study since its inception. Every element across the periodic table has specific applications in human civilization. Metallic mineral mining is the source of many of these elements.
16.3.1 Types of Metallic Mineral Deposits
The various ways in which minerals and their associated elements concentrate to form ore deposits are too complex and numerous to fully review in this text. However, entire careers are built around them. In the following section, we describe some of the more common deposit types along with their associated elemental concentrations and world class occurrences.
Magmatic Processes
When a magmatic body crystallizes and differentiates (see Chapter 4), it can cause certain minerals and elements to concentrate. Layered intrusions, typically ultramafic to mafic, can host deposits that contain copper, nickel, platinum, palladium, rhodium, and chromium. The Stillwater Complex in Montana is an example of economic quantities of layered mafic intrusion. Associated deposit types can contain chromium or titanium-vanadium. The largest magmatic deposits in the world are the chromite deposits in the Bushveld Igneous Complex in South Africa. These rocks have an areal extent larger than the state of Utah. The chromite occurs in layers that resemble sedimentary layers, except these layers occur within a crystallizing magma chamber.

Water and other volatiles that are not incorporated into mineral crystals when a magma crystallizes can become concentrated around the crystallizing magma’s margins. Ions in these hot fluids are very mobile and can form exceptionally large crystals. Once crystallized, these large crystal masses are then called pegmatites. They form from magma fluids that are expelled from the solidifying magma when nearly the entire magma body has crystallized. In addition to minerals that are predominant in the main igneous mass, such as quartz, feldspar, and mica, pegmatite bodies may also have very large crystals of unusual minerals that contain rare elements like beryllium, lithium, tantalum, niobium, and tin, as well as native elements like gold. Such pegmatites are ores of these metals.
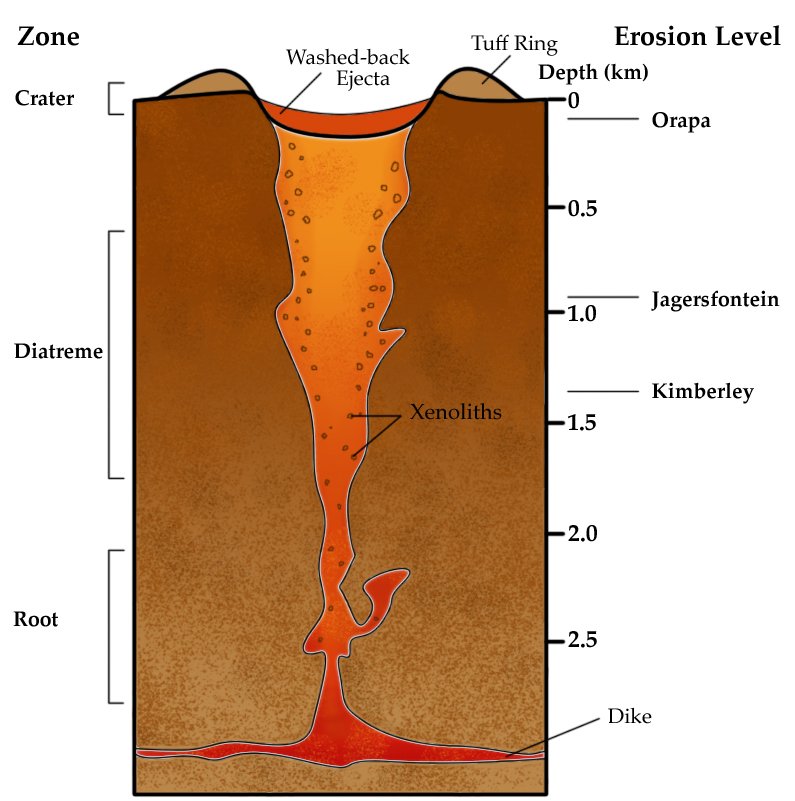
An unusual magmatic process is a kimberlite pipe, which is a volcanic conduit that transports ultramafic magma from within the mantle to the surface. Diamonds, which are formed at great temperatures and pressures of depth, are transported by kimberlite pipes to locations where they can be mined. The process that created these kimberlite ultramafic rocks is no longer common on Earth. Most known deposits are from the Archean Eon.
Hydrothermal Processes
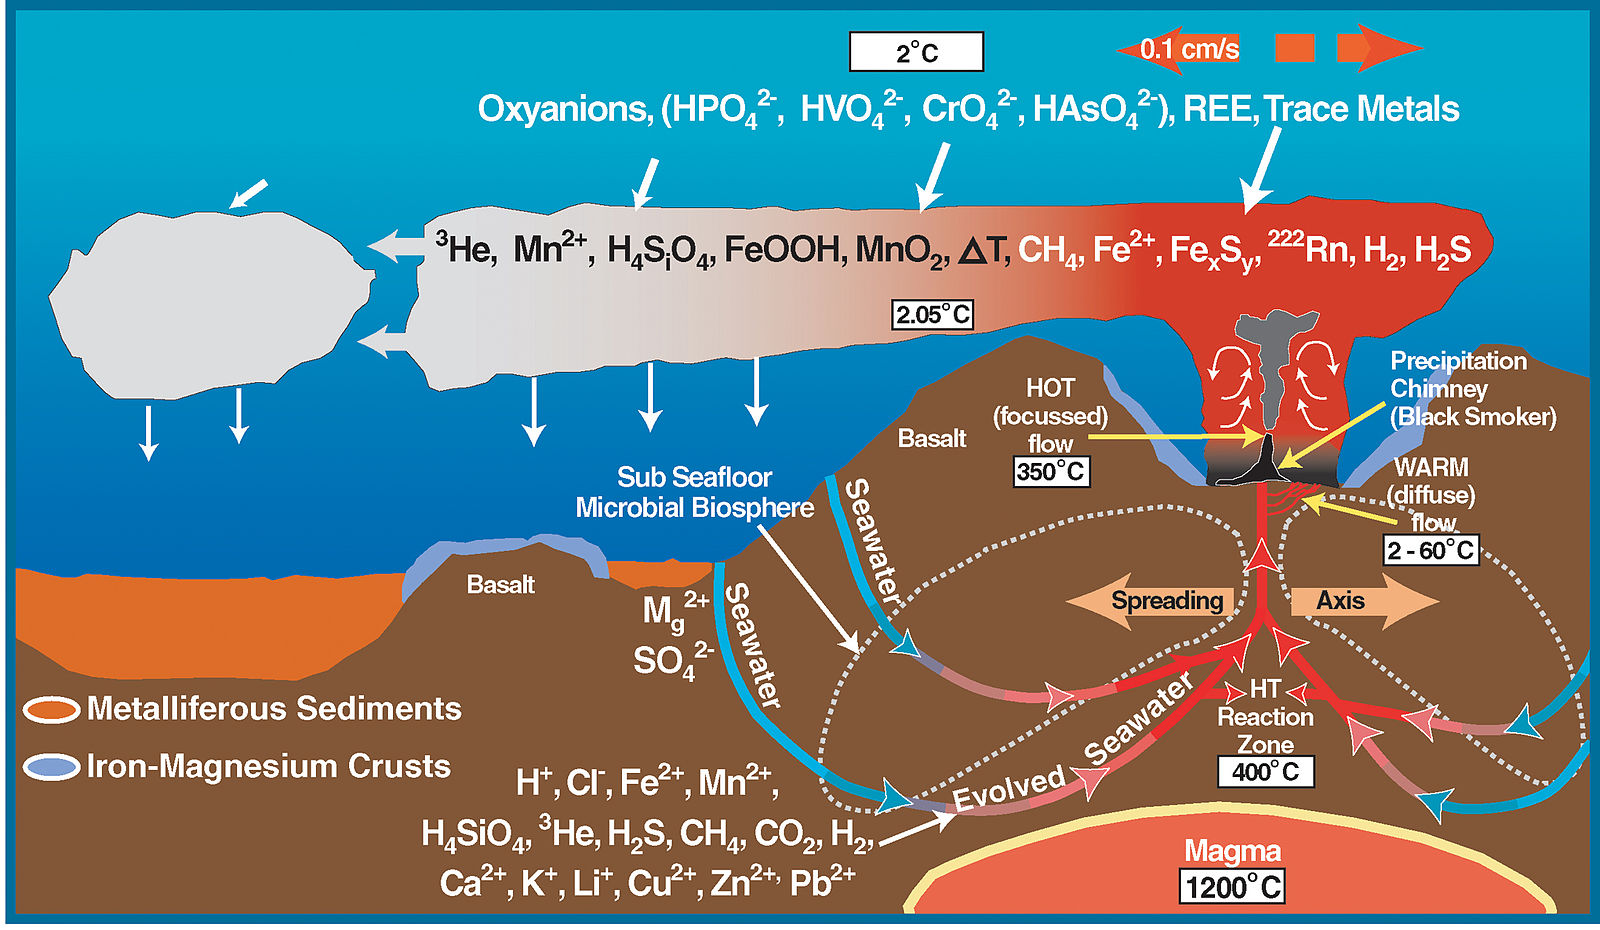
Fluids rising from crystallizing magmatic bodies or that are heated by the geothermal gradient cause many geochemical reactions that form various mineral deposits. The most active hydrothermal process today produces volcanogenic massive sulfide (VMS) deposits, which form from black smoker hydrothermal chimney activity near mid-ocean ridges all over the world. They commonly contain copper, zinc, lead, gold, and silver when found at the surface. Evidence from around 7000 BCE in a period known as the Chalcolithic shows copper was among the earliest metals smelted by humans as means of obtaining higher temperatures. The largest of these VMS deposits occur in Precambrian Period rocks. The Jerome deposit in central Arizona is a good example.
Another deposit type that draws on magma-heated water is a porphyry deposit. This is not to be confused with the porphyritic igneous texture, although the name is derived from the porphyritic texture that is nearly always present in the igneous rocks associated with a porphyry deposit. Several types of porphyry deposits exist, such as porphyry copper, porphyry molybdenum, and porphyry tin. These deposits contain low-grade disseminated ore minerals closely associated with intermediate and felsic intrusive rocks that are present over a very large area. Porphyry deposits are typically the largest mines on Earth. One of the largest, richest, and possibly best-studied mine in the world is Utah’s Kennecott Bingham Canyon Mine. It’s an open-pit mine, which, for over 100 years, has produced several elements, including copper, gold, molybdenum, and silver. Underground carbonate replacement deposits produce lead, zinc, gold, silver, and copper. In the mine’s past, the open pit predominately produced copper and gold from chalcopyrite and bornite. Gold only occurs in minor quantities in the copper-bearing minerals, but because the Kennecott Bingham Canyon Mine produces on such a large scale, it is one of the largest gold mines in the US. In the future, this mine may produce more copper and molybdenum (molybdenite) from deeper underground mines.
Most porphyry copper deposits owe their high metal content and hence their economic value to weathering processes called supergene enrichment, which occurs when the deposit is uplifted, eroded, and exposed to oxidation. This process occurred millions of years after the initial igneous intrusion and hydrothermal expulsion ends. When the deposit’s upper pyrite-rich portion is exposed to rain, the pyrite in the oxidizing zone creates an extremely acid condition that dissolves copper out of copper minerals, such as chalcopyrite, and converts the chalcopyrite to iron oxides, such as hematite or goethite. The copper minerals are carried downward in water until they arrive at the groundwater table and an environment where the primary copper minerals are converted into secondary higher-copper content minerals. Chalcopyrite (35% Cu) is converted to bornite (63% Cu) and ultimately chalcocite (80% Cu). Without this enriched zone, which is two-to-five times higher in copper content than the main deposit, most porphyry copper deposits would not be economic to mine.
If limestone or other calcareous sedimentary rocks are near the magmatic body, then another type of ore deposit called a skarn deposit forms. These metamorphic rocks form as magma-derived, highly saline metalliferous fluids react with carbonate rocks to create calcium-magnesium-silicate minerals like pyroxene, amphibole, and garnet, as well as high-grade iron, copper, zinc minerals, and gold. Intrusions that are genetically related to the intrusion that made the Kennecott Bingham Canyon deposit have also produced copper-gold skarns, which were mined by the early European settlers in Utah. When iron and/or sulfide deposits undergo metamorphism, the grain size commonly increases, which makes separating the gangue from the desired sulfide or oxide minerals much easier.
Sediment-hosted disseminated gold deposits consist of low concentrations of microscopic gold as inclusions and disseminated atoms in pyrite crystals. These are formed via low-grade hydrothermal reactions, generally in the realm of diagenesis, that occur in certain rock types, namely muddy carbonates and limey mudstones. This hydrothermal alteration is generally far removed from a magma source but can be found in rocks situated with a high geothermal gradient. The Mercur deposit in Utah’s Oquirrh Mountains was this type’s earliest locally mined deposit. There, almost a million ounces of gold was recovered between 1890 and 1917. In the 1960s, a metallurgical process using cyanide was developed for these low-grade ore types. These deposits are also called Carlin-type deposits because the disseminated deposit near Carlin, Nevada, is where the new technology was first applied and where the first definitive scientific studies were conducted. Gold was introduced into these deposits by hydrothermal fluids that reacted with silty calcareous rocks, removing carbonate, creating additional permeability, and adding silica and gold-bearing pyrite in the pore space between grains. The Betze-Post mine and the Gold Quarry mine on the Carlin Trend are two of the largest disseminated gold deposits in Nevada. Similar deposits, but not as large, have been found in China, Iran, and Macedonia.
Nonmagmatic Geochemical Processes
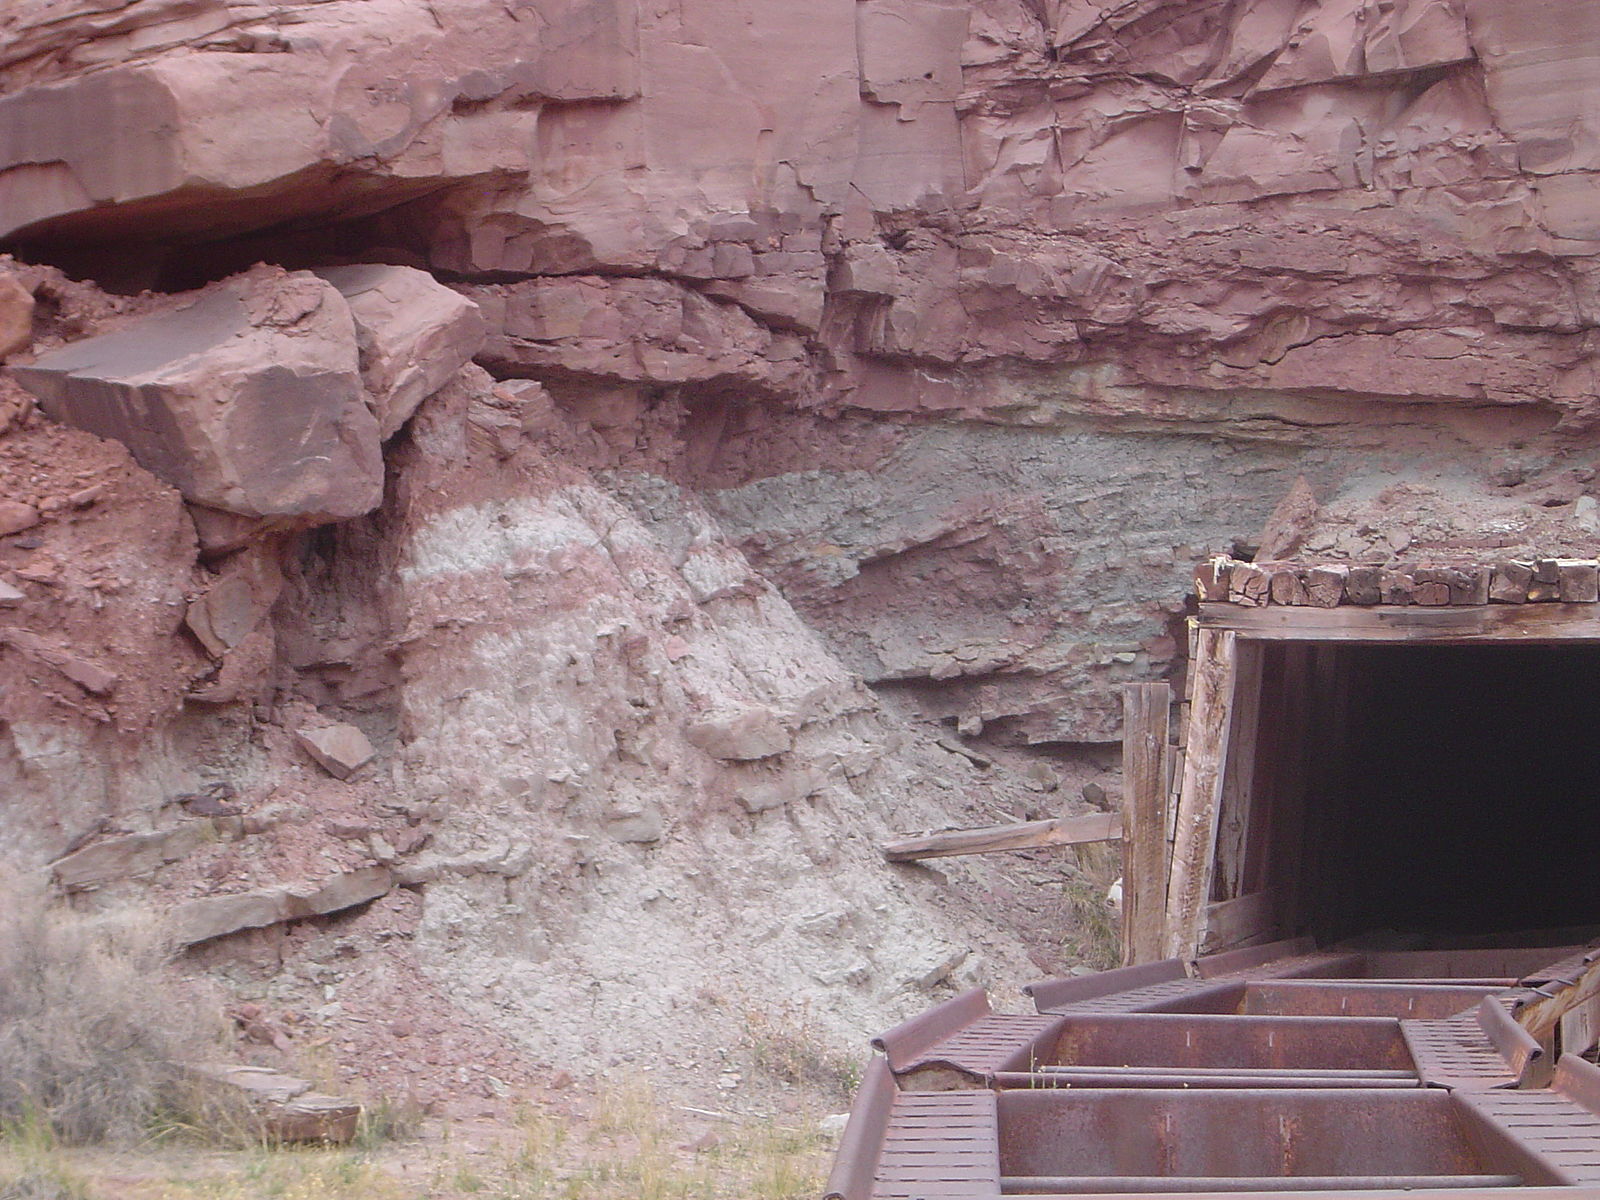
Geochemical processes that occur at or near the surface without magma’s aid also concentrate metals, but to a lesser degree than hydrothermal processes. One of the main reactions is redox, short for reduction/oxidation chemistry, which has to do with the amount of available oxygen in a system. Places with plentiful oxygen, as in the atmosphere today, are considered oxidizing environments, while oxygen-poor places are considered reducing environments. Uranium deposits are an example of where redox concentrated the metal. Uranium is soluble in oxidizing groundwater environments and precipitates as uraninite when encountering reducing conditions. Many of the deposits across the Colorado Plateau, such as in Moab, Utah, were formed by this method.
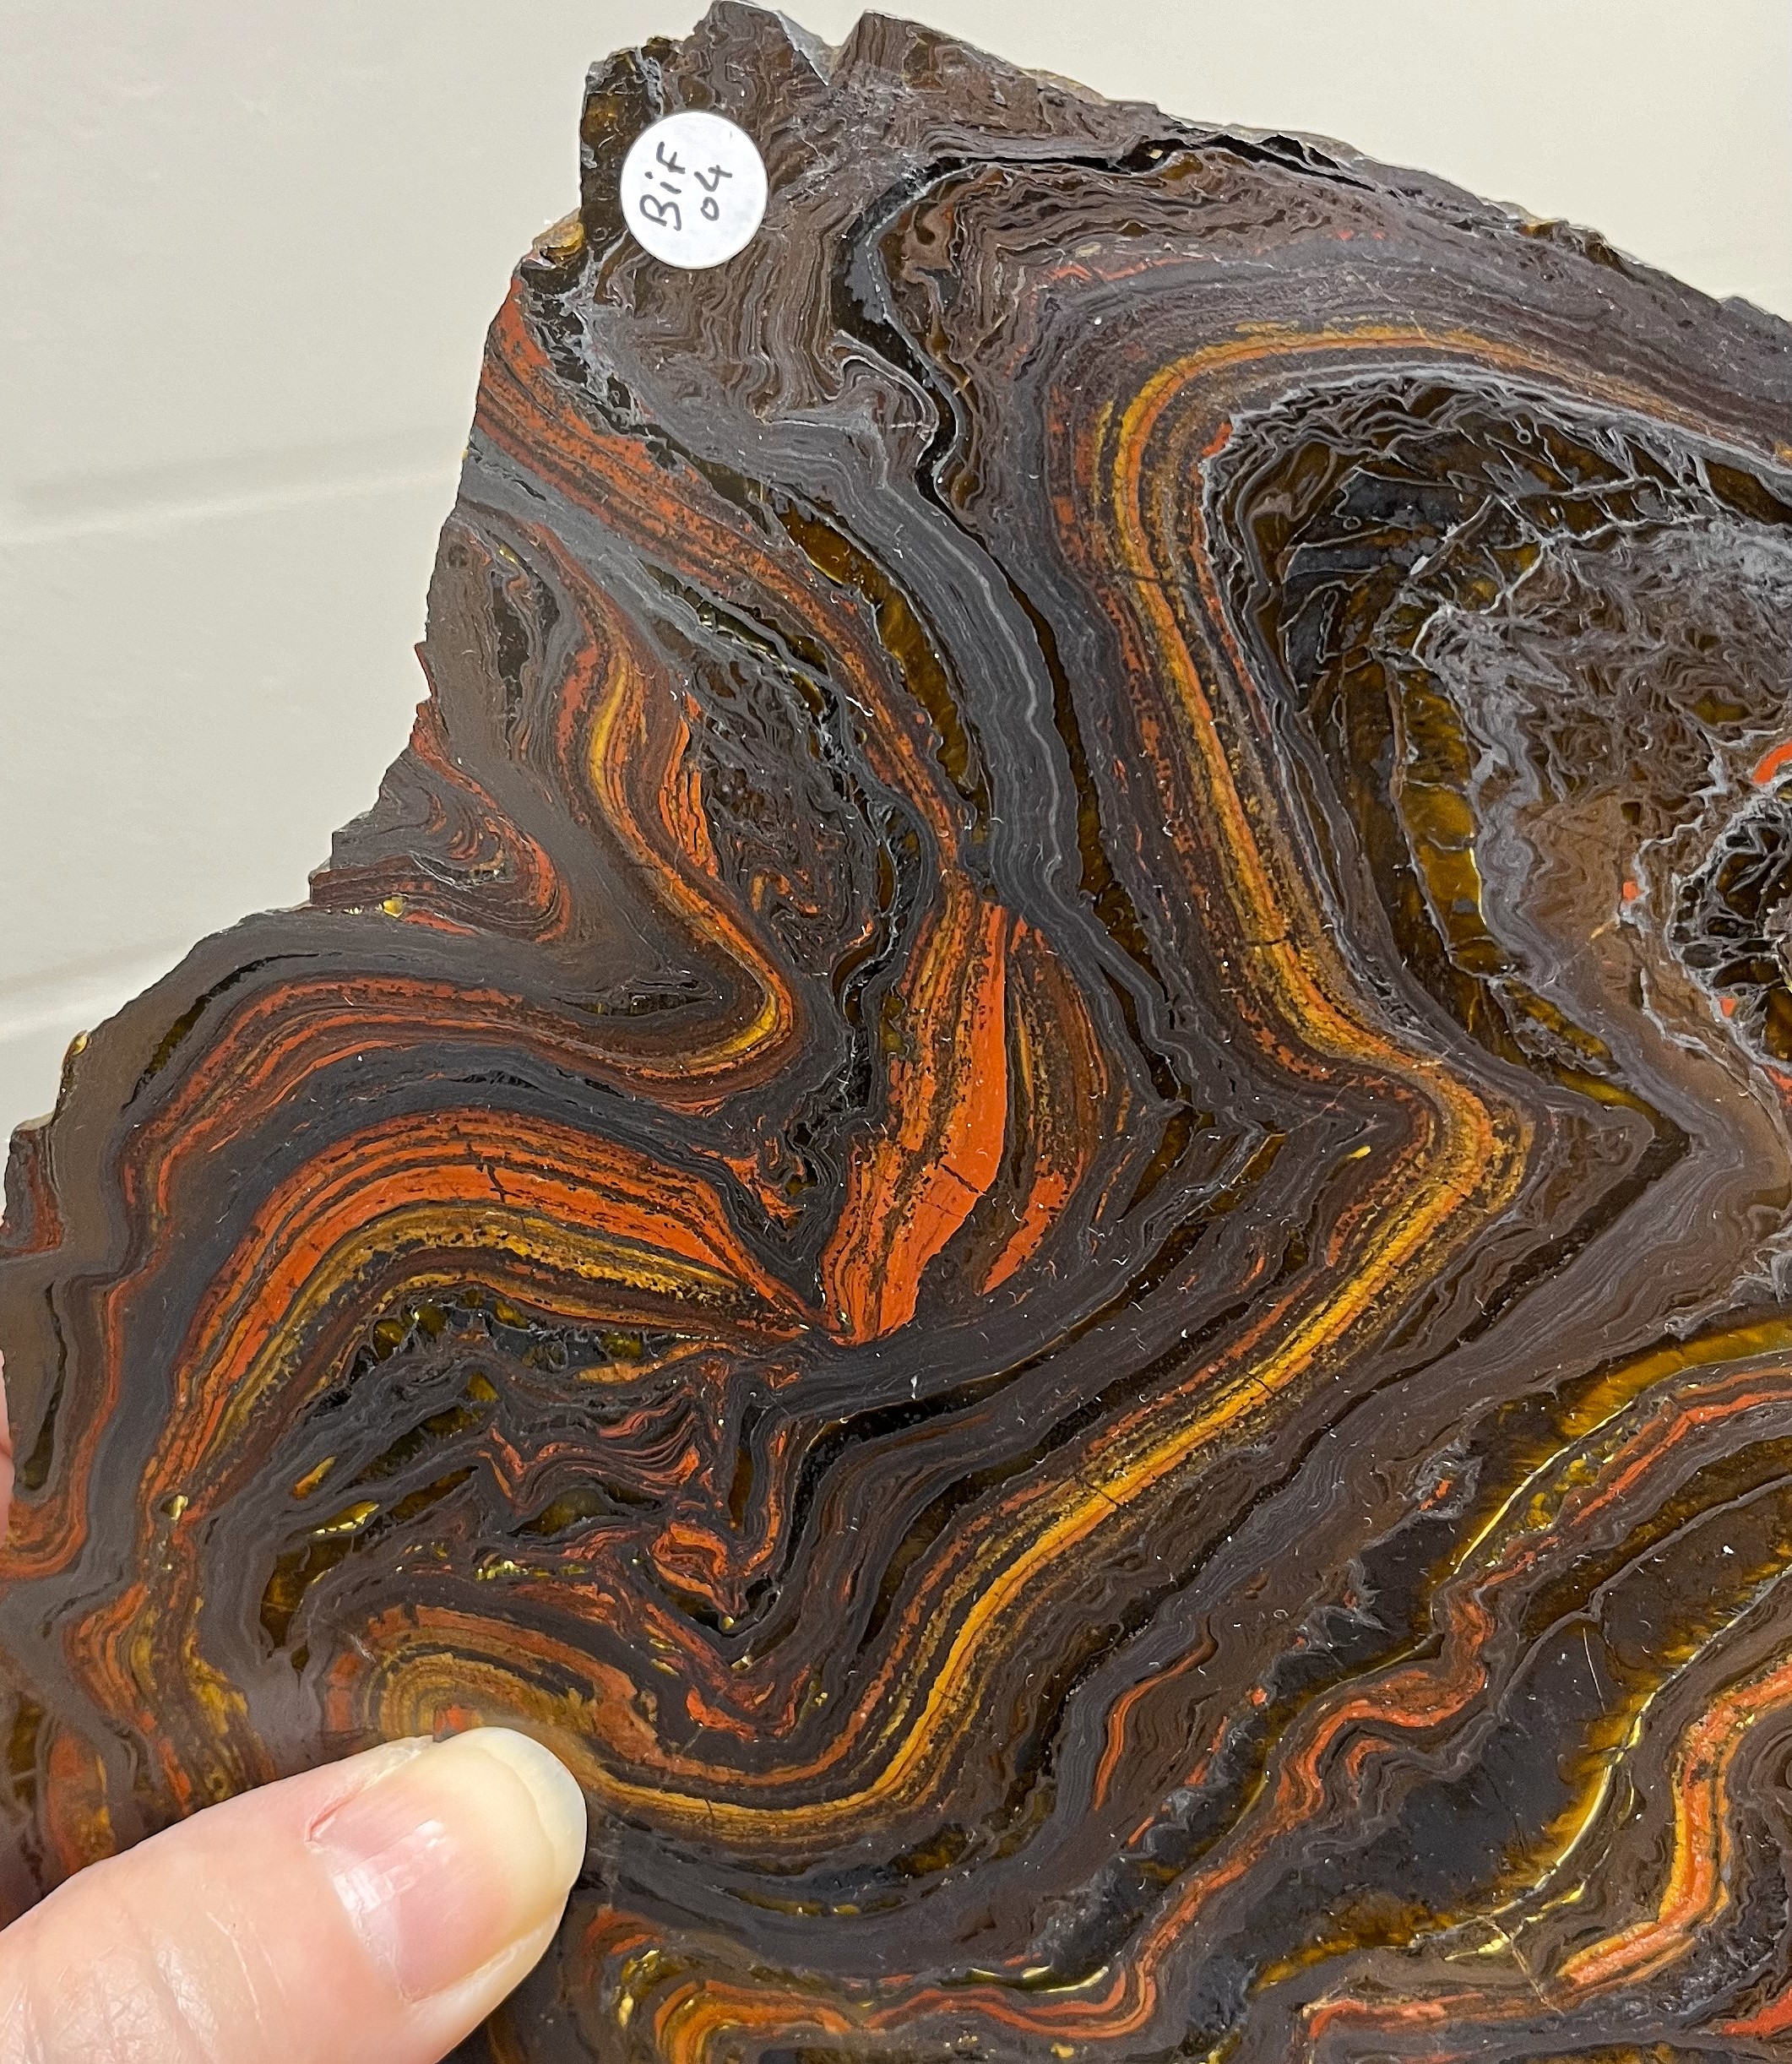
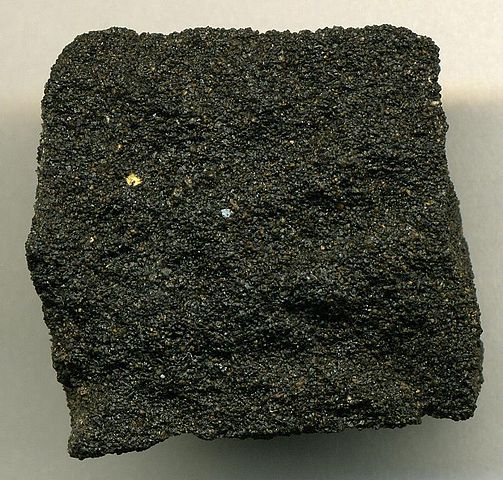
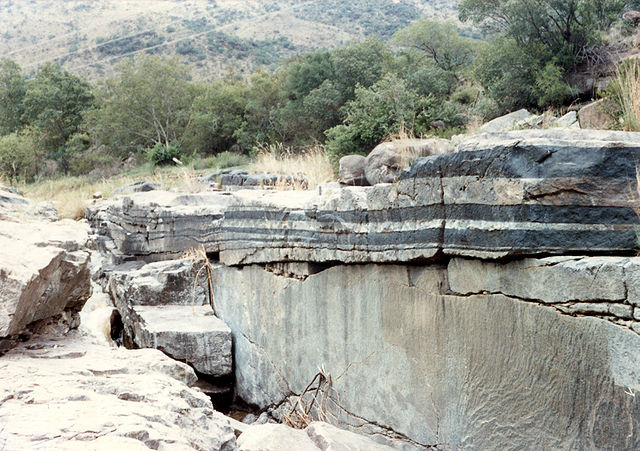
Redox reactions are also responsible for creating banded iron formations (BIFs), which are interbedded layers of iron oxide, composed of hematite and magnetite, chert, and shale beds. These deposits formed early in the Earth’s history as the atmosphere was becoming oxygenated. Cycles of oxygenating iron-rich waters initiated precipitation of the iron beds. Because BIFs are generally Precambrian in age, happening at the event of atmospheric oxygenation, they are only found in some of the older exposed rocks in the United States, such as in Michigan’s Upper Peninsula and northeast Minnesota.

Deep, saline, connate fluids (trapped in pore spaces) within sedimentary basins may be highly metalliferous. When expelled outward and upward as basin sediments compacted, these fluids formed lead and zinc deposits in limestone by replacing or filling open spaces, such as caves and faults, and in sandstone by filling pore spaces. The most famous are called Mississippi Valley-type deposits. Also known as carbonate-hosted replacement deposits, they are large deposits of galena and sphalerite lead and zinc ores that form from hot fluids ranging from 100°C to 200°C (212°F to 392°F). Although they are named for occurring along the Mississippi River Valley in the US, they are found worldwide.
Sediment-hosted copper deposits occurring in sandstones, shales, and marls are enormous, and their contained resources are comparable to porphyry copper deposits. These deposits were most likely formed diagenetically by groundwater fluids in highly permeable rocks. Well-known examples are the Kupferschiefer in Europe, which has an areal coverage of >500,000 km2, (310,685.596 mi2) and the Zambian Copper Belt in Africa.

Soils and mineral deposits that are exposed at the surface experience deep and intense weathering, which can form surficial deposits. Bauxite, an aluminum ore, is preserved in karst topography and laterites, which are soils formed in wet tropical environments. Soils containing aluminum concentrate minerals, such as feldspar, and ferromagnesian minerals in igneous and metamorphic rocks undergo chemical weathering processes that concentrate the metals. Ultramafic rocks that undergo weathering form nickel-rich soils, and when the magnetite and hematite in banded iron formations undergo weathering, it forms goethite, a friable mineral that is easily mined for its iron content.
Surficial Physical Processes
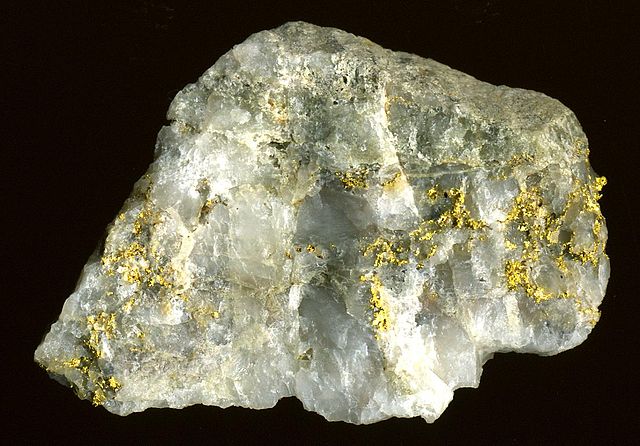
At the Earth’s surface, mass wasting and moving water can cause hydraulic sorting, which forces high-density minerals to concentrate. When these minerals are concentrated in streams, rivers, and beaches, they are called placer deposits and occur in modern sands and ancient lithified rocks. Native gold, native platinum, zircon, ilmenite, rutile, magnetite, diamonds, and other gemstones can be found in placers. Humans have mimicked this natural process to recover gold manually by gold panning and by mechanized means such as dredging.
16.3.2 Environmental Impacts of Metallic Mineral Mining
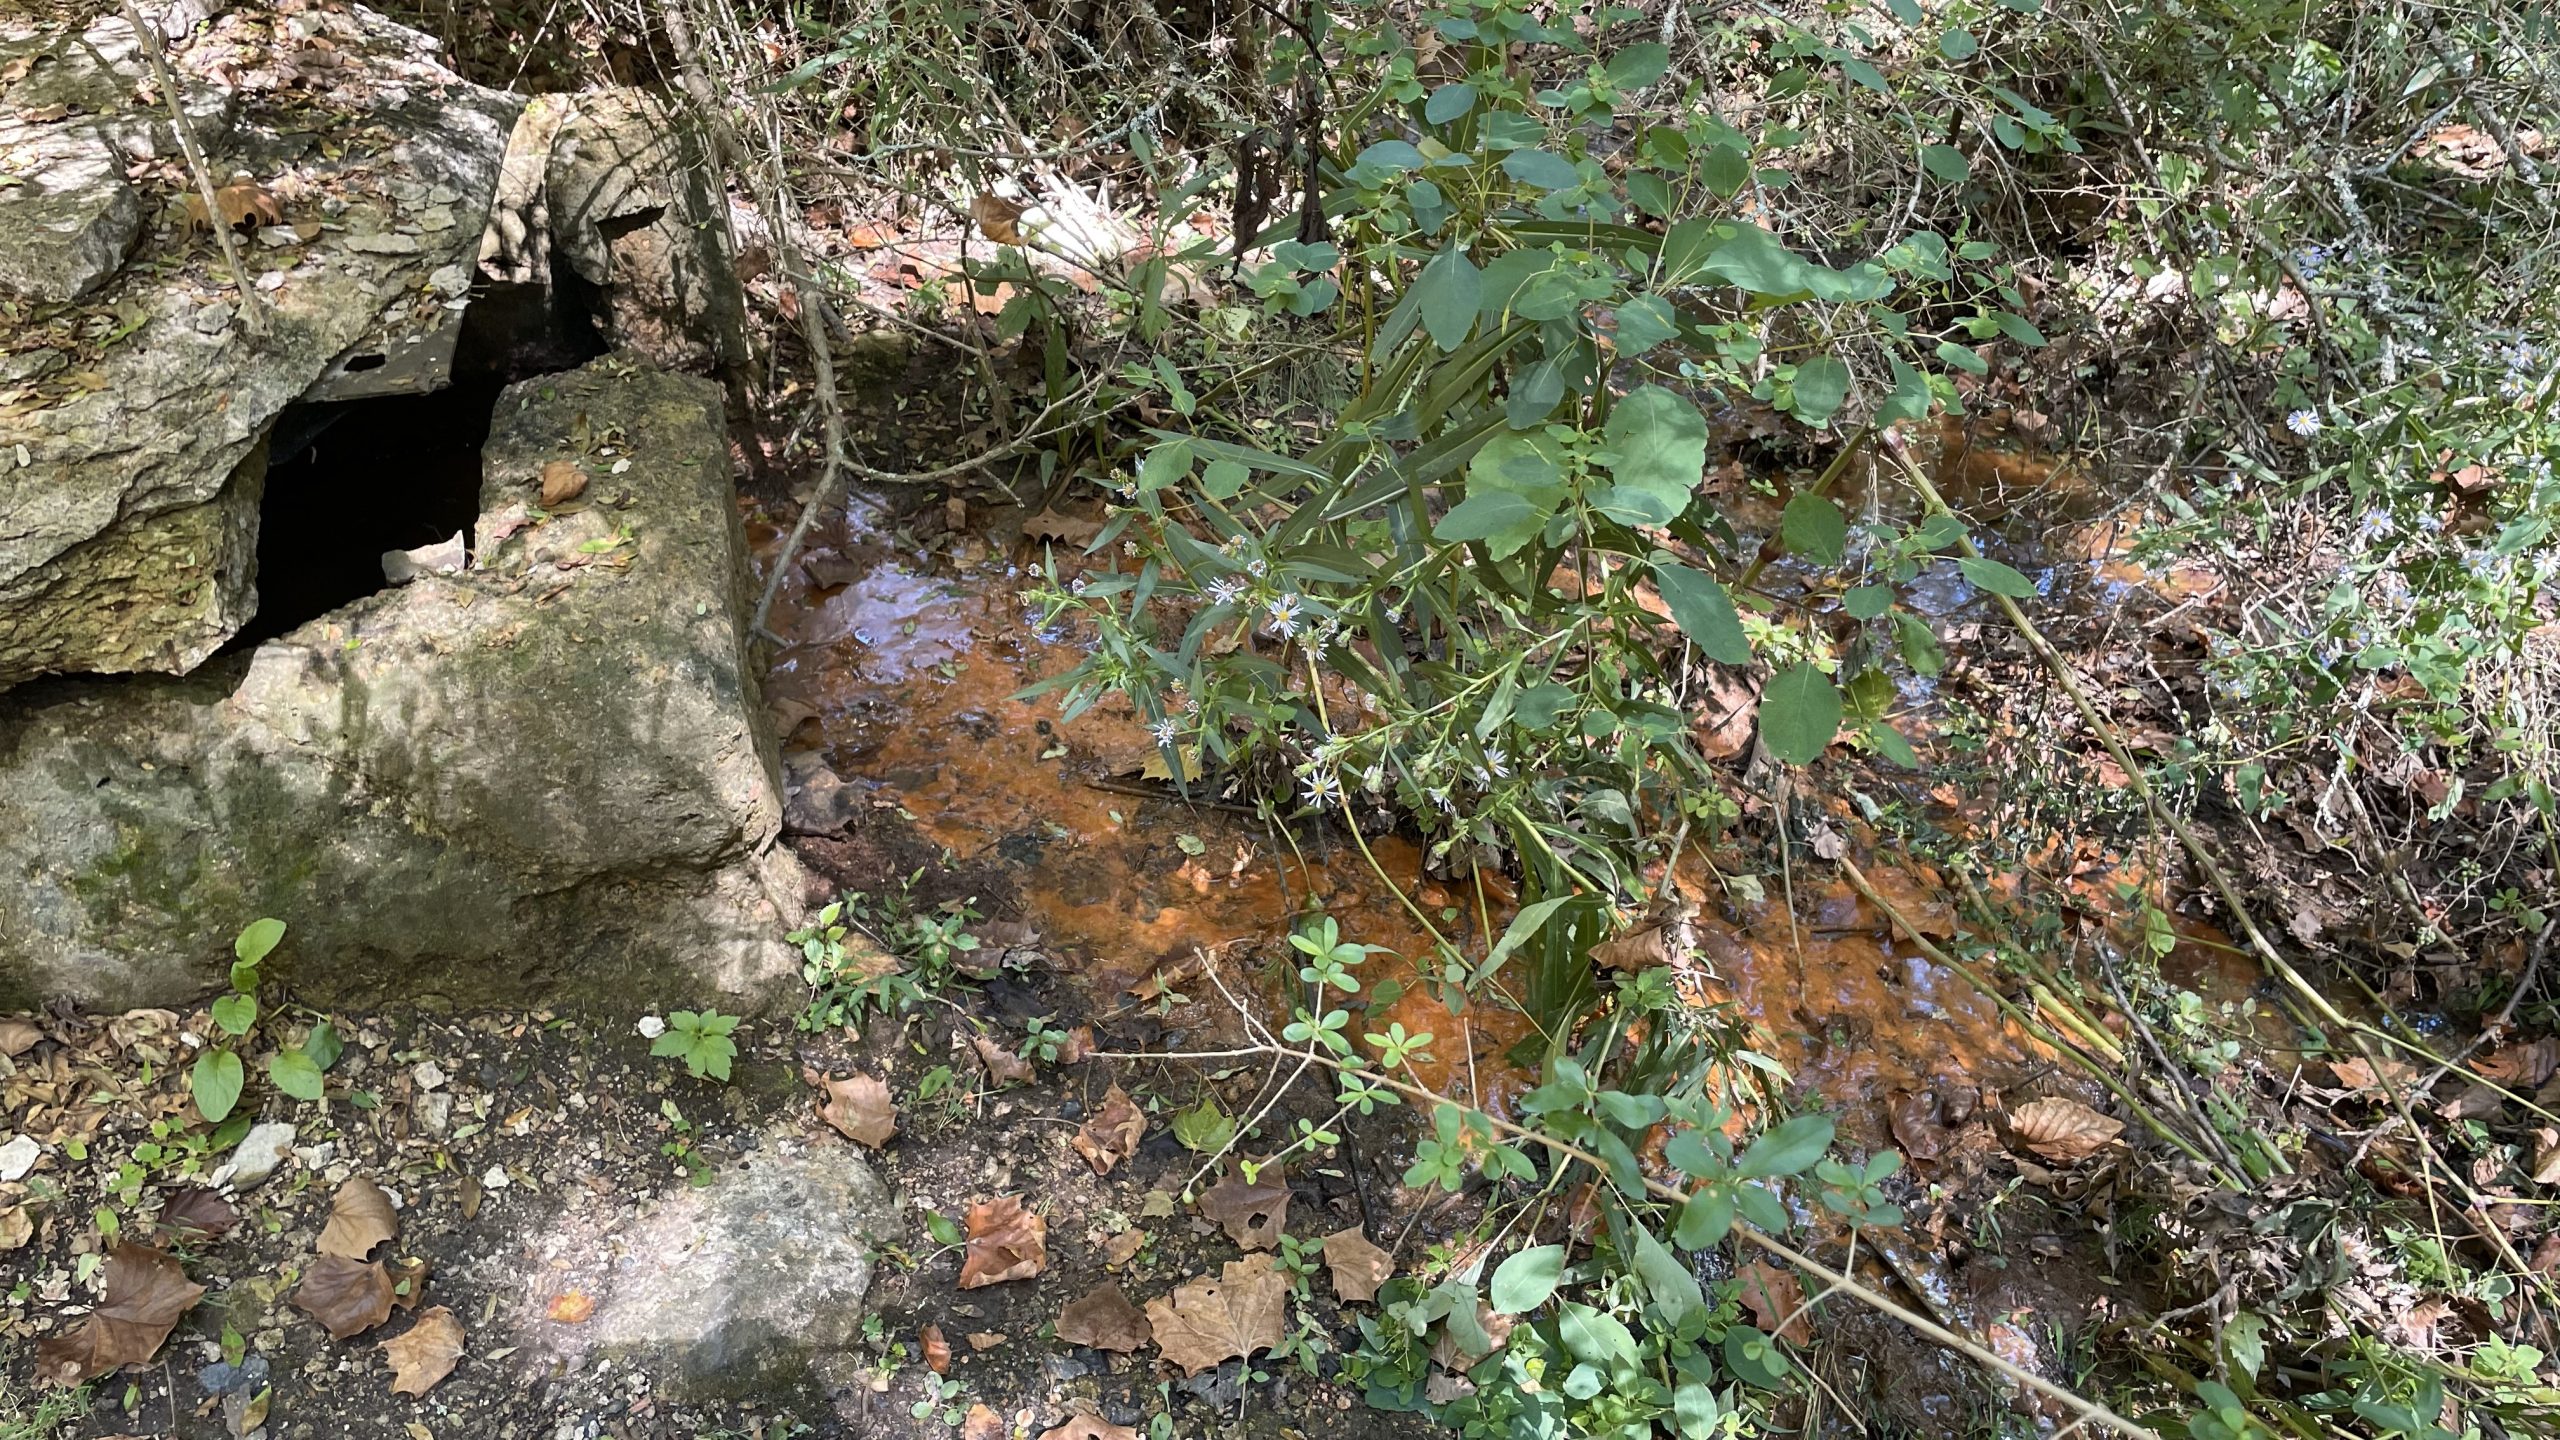
Metallic mineral mining’s primary impact comes from the mining itself, including disturbing the land surface, covering landscapes with tailings impoundments, and increasing mass wasting by accelerating erosion. In addition, many metal deposits contain pyrite, an uneconomic sulfide mineral that, when placed on waste dumps, generates acid rock drainage (ARD) during weathering, also commonly referred to as acid mine drainage. In oxygenated water, sulfides such as pyrite react and undergo complex reactions to release metal ions and hydrogen ions, which lowers pH to highly acidic levels. Mining and processing of mined materials typically increase the surface-area-to-volume ratio in the material, causing chemical reactions to occur even faster than would occur naturally. If not managed properly, these reactions lead to acidic streams and groundwater plumes that carry dissolved toxic metals. In mines where limestone is a waste rock or where carbonate minerals like calcite or dolomite are present, their acid-neutralizing potential helps reduce acid rock drainage. Although this is a natural process too, it is very important to isolate mine dumps and tailings from oxygenated water, to prevent the sulfides from dissolving and subsequently percolating the sulfate-rich water into waterways. Industry has taken great strides to prevent contamination in recent decades, but earlier mining projects are still causing problems with local ecosystems.
16.3.3 Nonmetallic Mineral Deposits
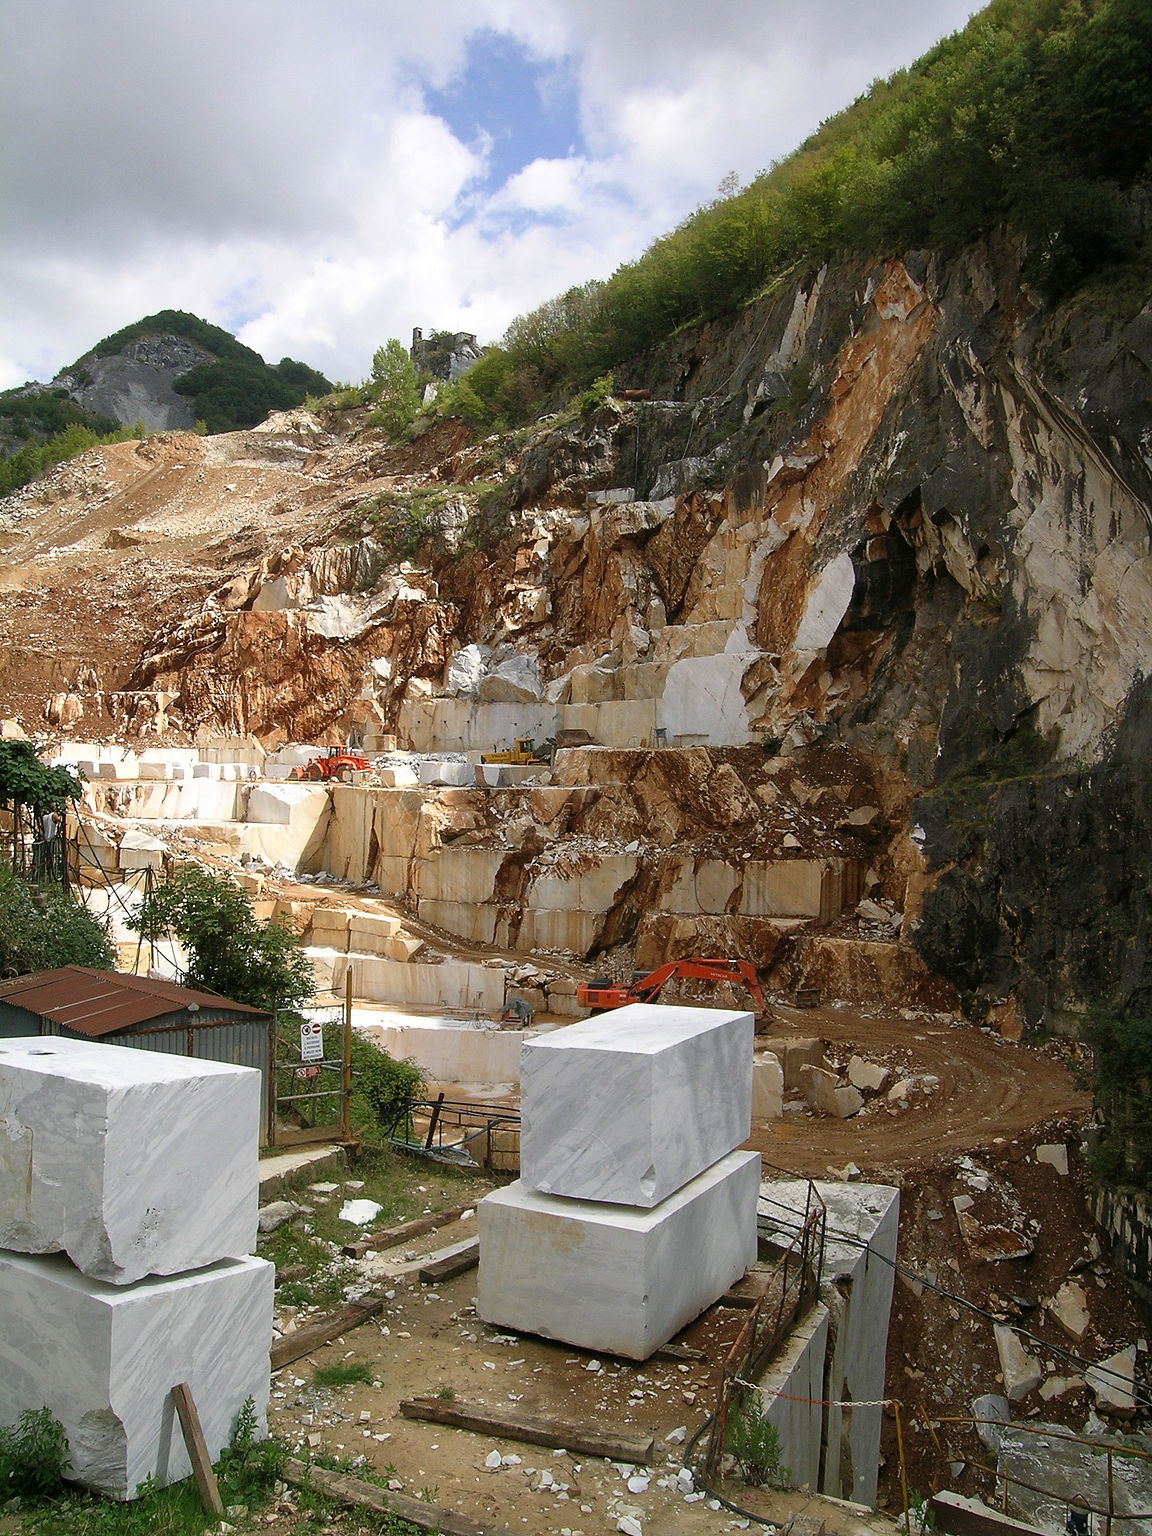
While receiving much less attention, nonmetallic mineral resources, also known as industrial minerals, are just as vital to ancient and modern society as metallic minerals. The most basic is building stone. Limestone, travertine, granite, slate, and marble are common building stones and have been quarried for centuries. Even today, building stones are very popular for everything from slate roof tiles to granite countertops. In particular, pure limestone is ground up, processed, and reformed as plaster, cement, and concrete. Some nonmetallic mineral resources are not mineral specific; nearly any rock or mineral can be used. This is generally called aggregate, which is used in concrete, roads, and foundations. Gravel is one of the more common aggregates.
Evaporites
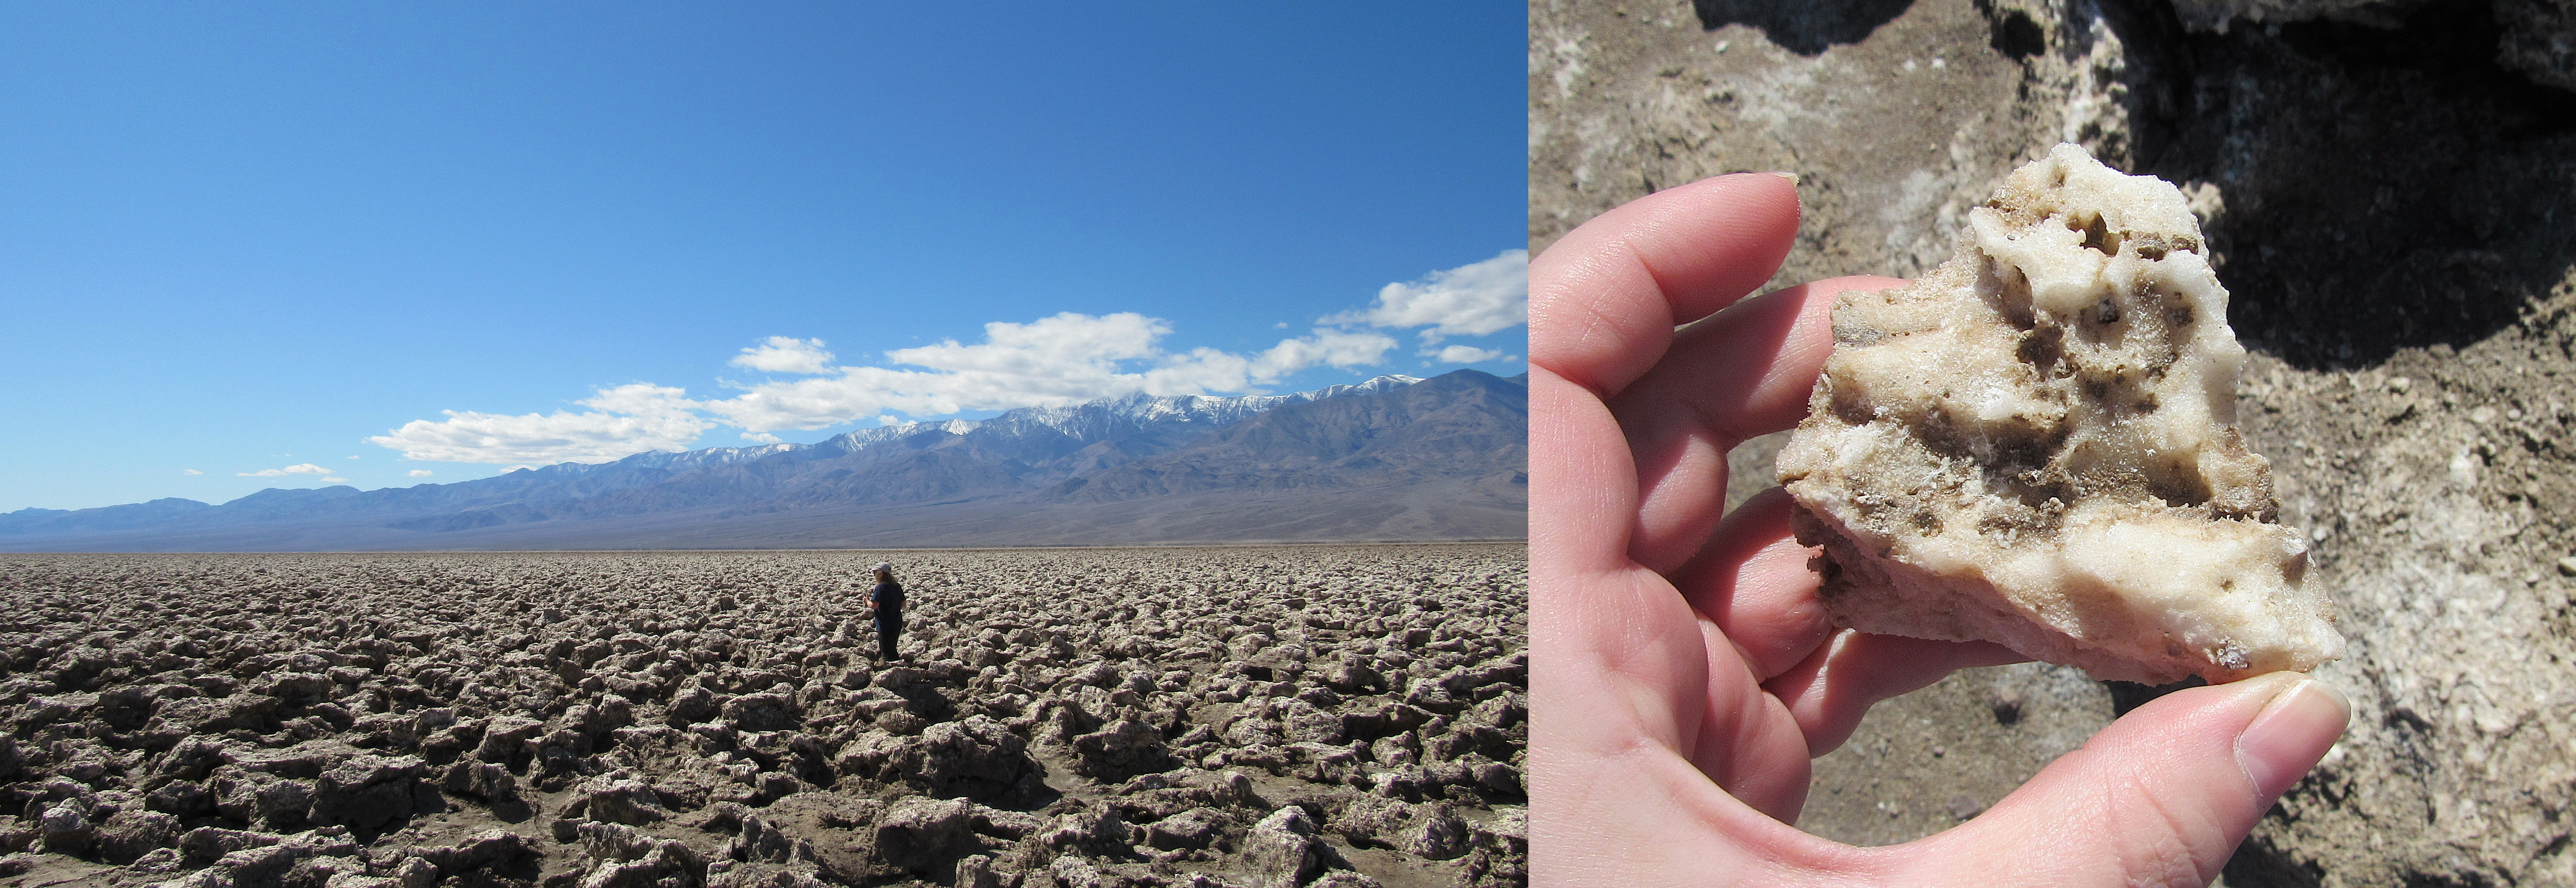
Evaporite deposits form in restricted basins where water evaporates faster than it recharges, such as the Death Valley saltpan in the Western United States or the Dead Sea, which borders Israel and Jordan. As the waters evaporate, soluble minerals are concentrated and become supersaturated, at which point they precipitate from the now highly saline waters. If these conditions persist for long stretches, thick rock salt, rock gypsum, and other mineral deposits accumulate (see Chapter 5).
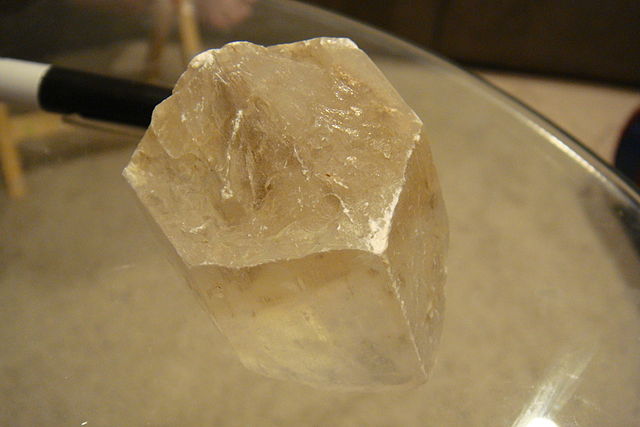
Evaporite minerals, such as halite, are used in our food as common table salt. Salt was a vitally important food preservative and economic resource before refrigeration was developed. While still used in food, halite is now mainly mined as a chemical agent, water softener, or road de-icer. Gypsum is a common nonmetallic mineral used as a building material; it is the main component in dry wall. It is also used as a fertilizer. Other evaporites include sylvite (potassium chloride) and bischofite (magnesium chloride), both of which are used in agriculture, medicine, food processing, and other applications. Potash, a group of highly soluble potassium-bearing evaporite minerals, is used as a fertilizer. In hyper-arid locations, even more rare and complex evaporites like borax, trona, ulexite, and hanksite are mined. They can be found in places such as Searles Dry Lake and Death Valley, California, and in the Green River Formation’s ancient evaporite deposits in Utah and Wyoming.
Phosphorus
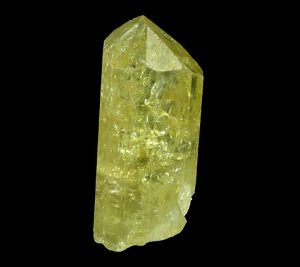
Phosphorus is an essential element that occurs in the mineral apatite, which is found in trace amounts in common igneous rocks. Phosphorite, or phosphate rock, is formed in sedimentary environments in the ocean, contains abundant apatite, and is mined to make fertilizer. Without phosphorus, life as we know it is not possible. Phosphorous is an important component of bone and DNA. Bone ash and guano are natural sources of phosphorus.

Take this quiz to check your comprehension of this section.
If you are using an offline version of this text, access the quiz for Section 16.3 via the QR code.
16.4 Renewable Resources
Renewable resources are materials present in our environment that can be exploited and replenished. Some common renewable energy sources are linked with green energy sources because they are associated with relatively small or easily remediated environmental impact. For example, solar energy comes from fusion within the Sun, which radiates electromagnetic energy. This energy reaches the Earth constantly and consistently and should continue to do so for about five billion more years. Wind energy, also related to solar energy, is maybe the oldest renewable energy and is used to sail ships and power windmills. Both solar and wind-generated energy are variable on Earth’s surface. These limitations are offset because we can use energy-storing devices, such as batteries or electricity exchanges between producing sites. The Earth’s heat, known as geothermal energy, can be viable anywhere that geologists drill deeply enough. In practice, geothermal energy is more useful where heat flow is great, such as volcanic zones or regions with a thinner crust.

Hydroelectric dams provide energy by allowing water to fall through the dam under gravity, which activates turbines that produce the energy. Ocean tides are also a reliable energy source. All of these renewable resources provide energy that powers society. Other renewable resources are plant and animal matter, which are used for food, clothing, and other necessities but are being researched as possible energy sources.
16.4.1 Solar Energy
Though only one billionth of the energy that leaves the Sun actually reaches the Earth’s surface, this is more than enough to meet the world’s energy requirements. In fact, almost all other sources of energy, renewable and nonrenewable, are actually stored forms of solar energy. Solar energy itself is a renewable energy source when energy from the Sun is converted to heat or electricity. The difficulties lie in harnessing the energy. Solar energy has been used for centuries to heat homes and water. Modern technology (e.g., photovoltaic cells) has provided a way to produce electricity from sunlight.
There are two ways to harness solar energy. Passive systems are structures whose design, placement, or materials optimize the use of heat or light directly from the Sun. Active systems have devices to convert the Sun’s energy into a more usable form, such as hot water or electricity.
In passive solar systems, strategic planning of building location, orientation, and materials provide great control over the inside temperature. Passive solar power manipulates the Sun’s energy to provide heating or cooling without the use of special devices or modern technology. These heating and cooling strategies have been used historically, such as natural ventilation, solar heat gain, solar shading, and efficient insulation.
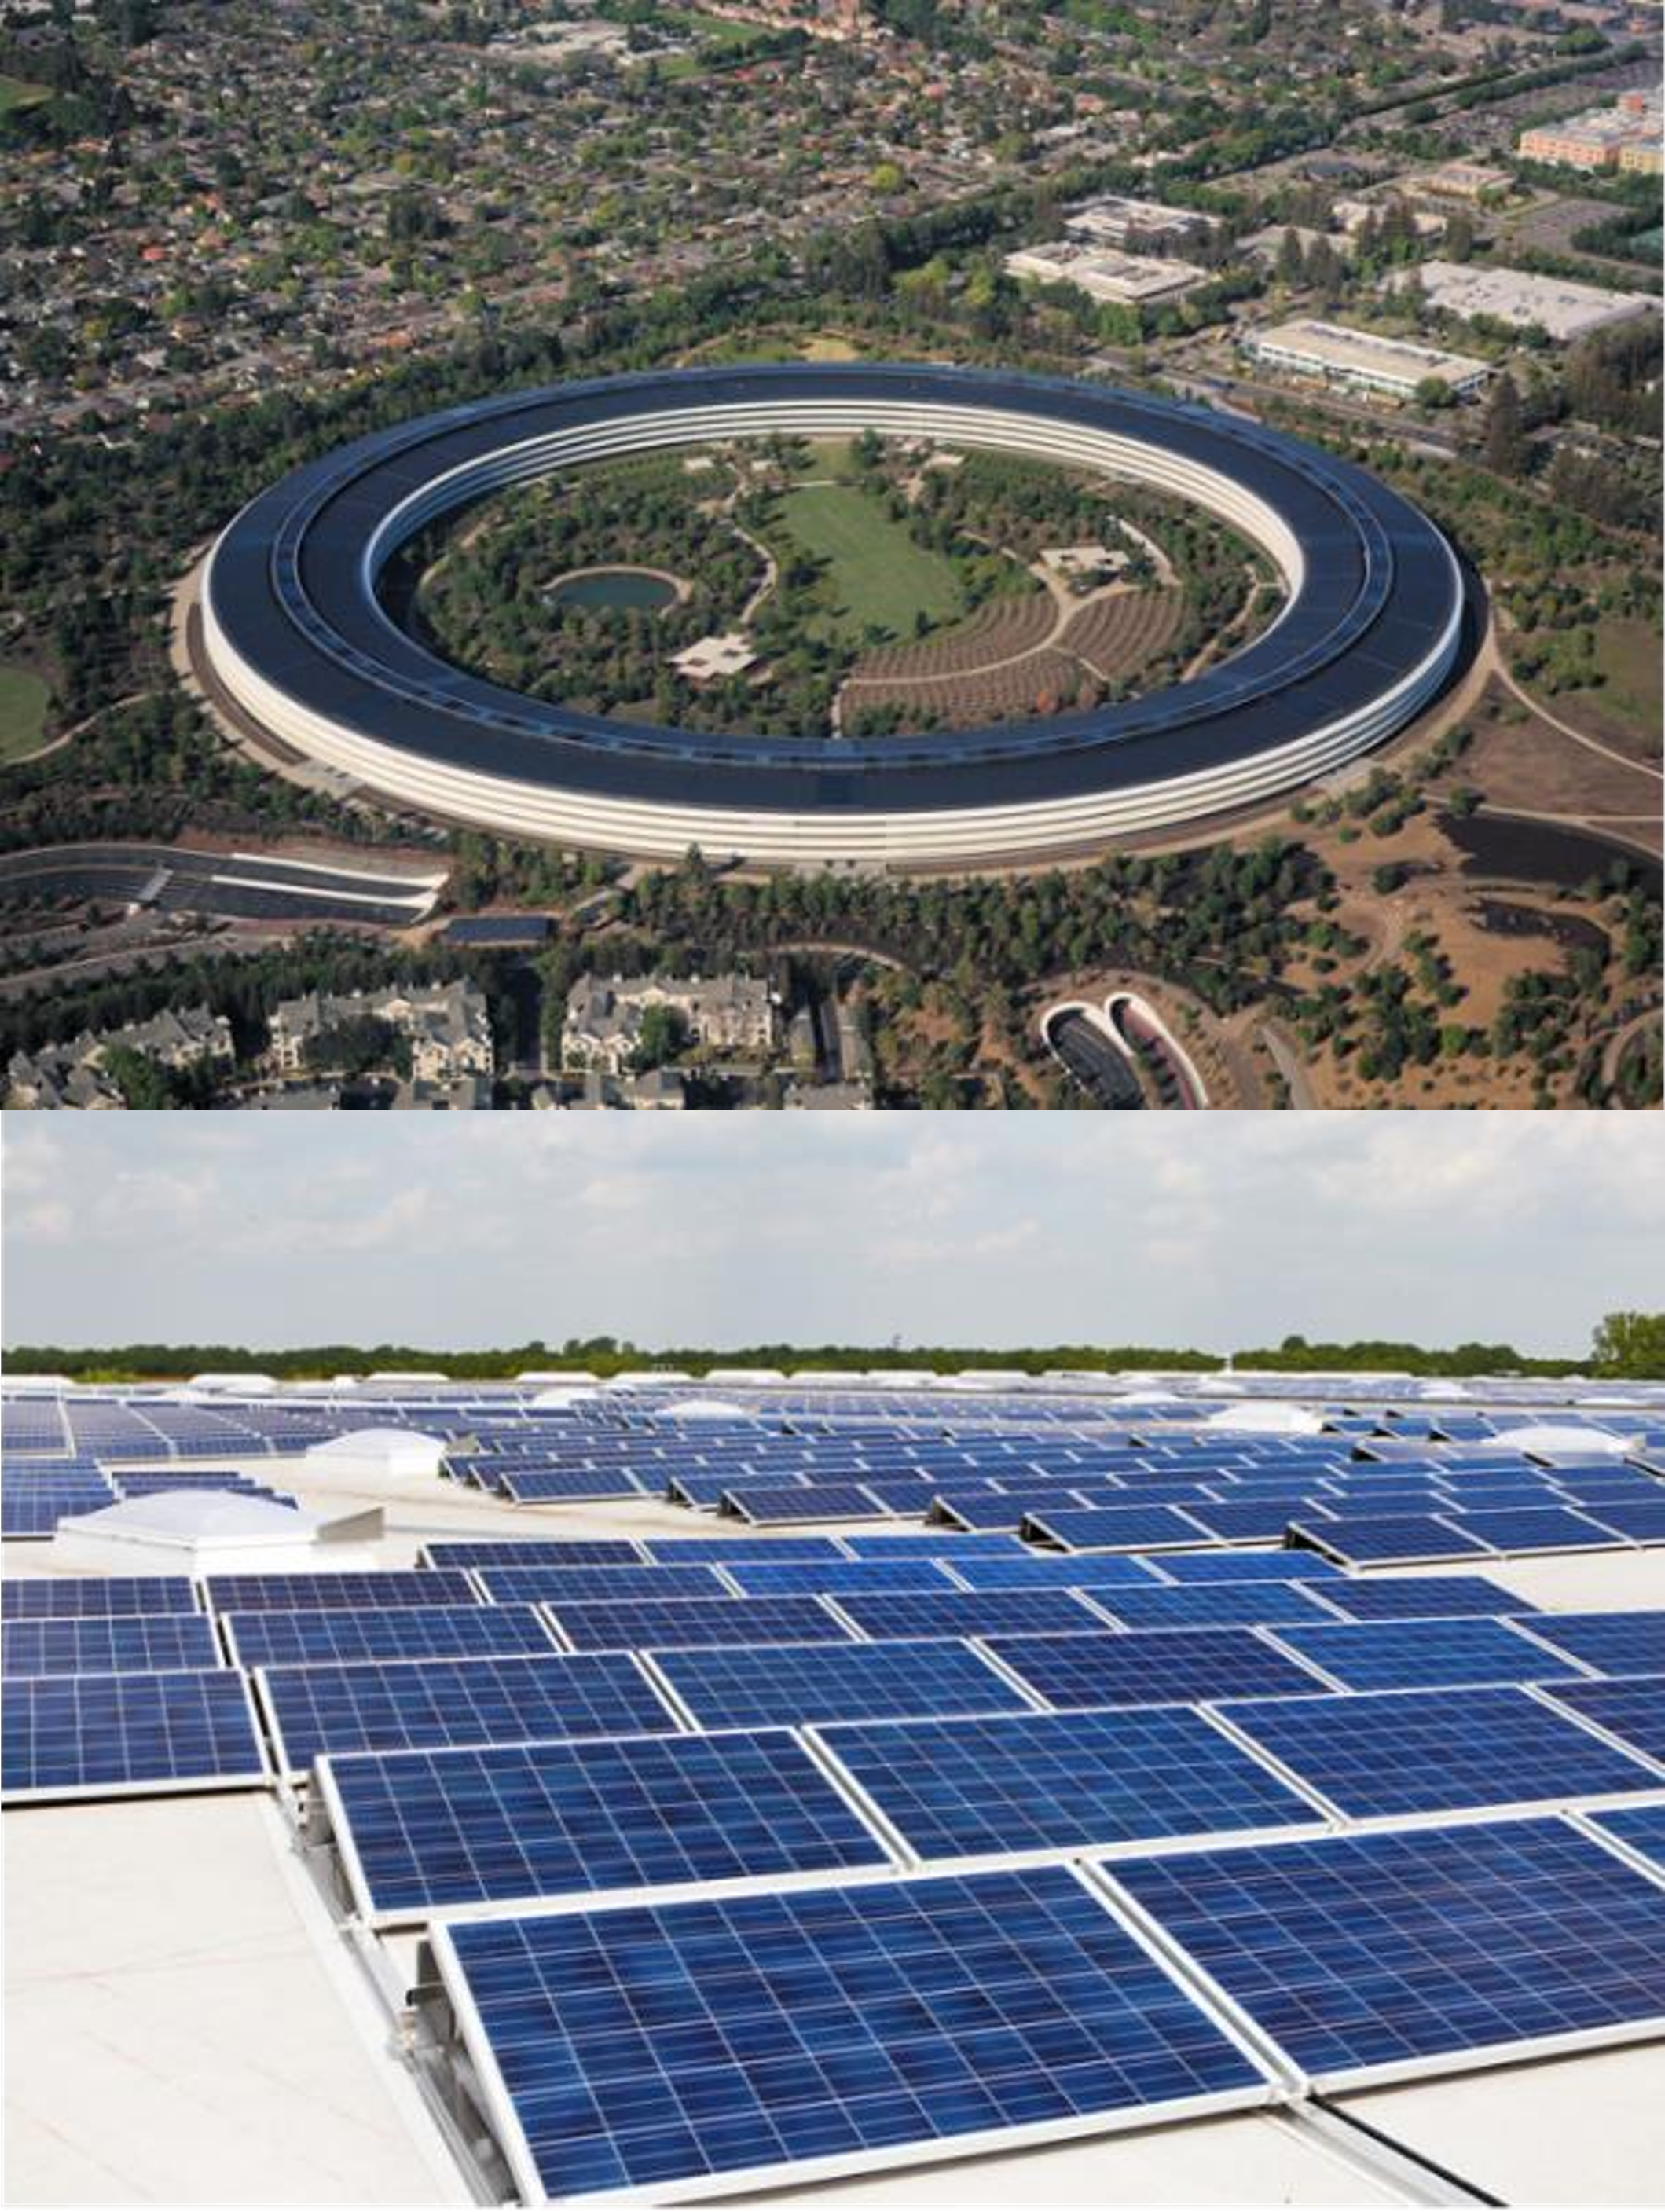
Active solar power systems harness the Sun’s energy through the use of specialized devices that transform this energy into another form. Some of the more common examples of active solar devices include solar photovoltaic (PV) devices, solar thermal collectors, and solar thermal systems. The devices you are probably most used to seeing are solar photovoltaic devices, or solar cells, which change sunlight directly into electricity. Photovoltaics use semiconducting materials such as silicon to produce electricity from sunlight. When light hits the cells, the material produces free electrons that migrate across the cell, creating an electric current. Small PV cells can power calculators, watches, and other small electronic devices. Arrangements of many solar cells in PV panels and arrangements of multiple PV panels in PV arrays can produce electricity for an entire house or business. Some PV power plants have large arrays that cover many acres to produce electricity for thousands of homes. These are often termed “solar farms.”
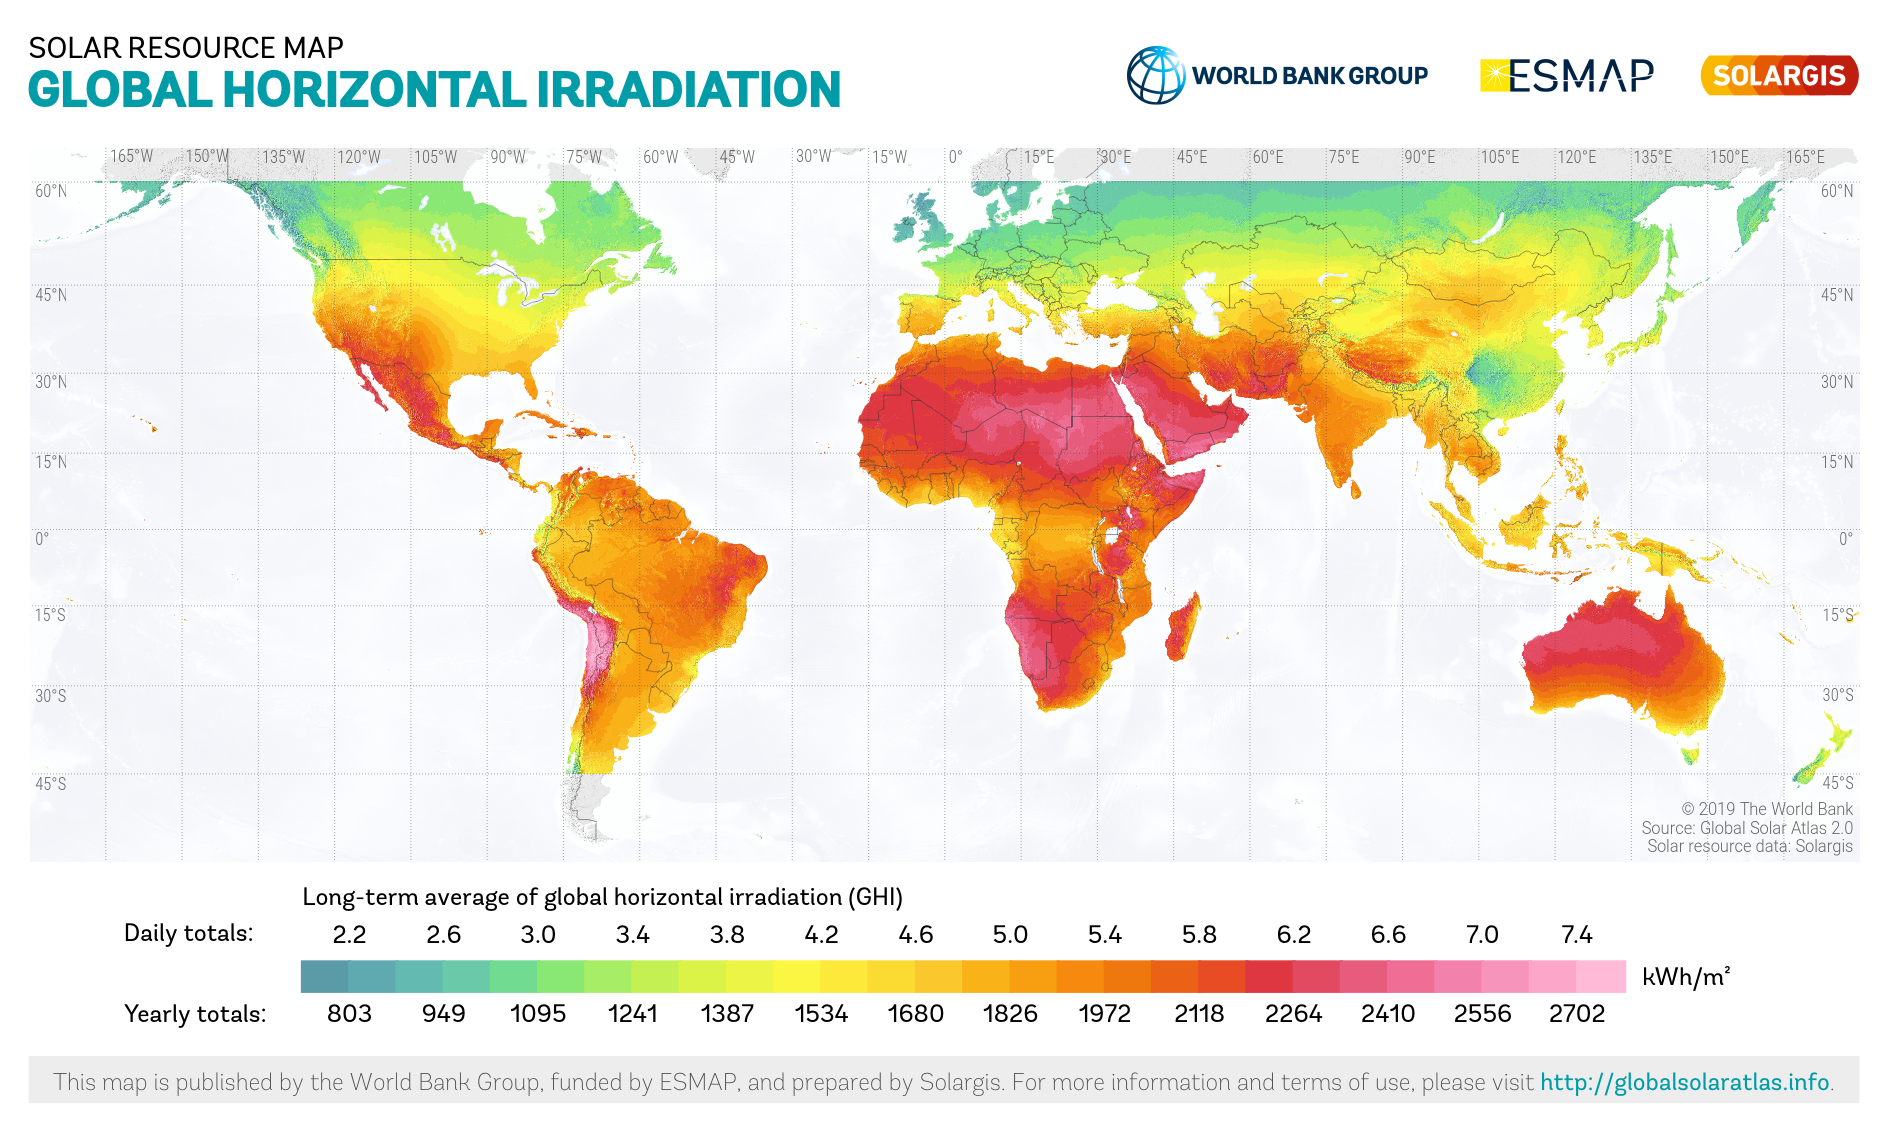
Though solar energy has great potential, there are also some downsides. Solar energy is not evenly distributed across the globe, making some locations better suited to solar energy investment than others. Even in locations with great solar potential, the solar energy can only be gathered while the Sun is shining. This means that little to no energy can be generated at night or on cloudy days. Since sunlight can’t be stored and used on demand (like coal, oil, or even biomass), the challenge of intermittent power can be difficult to overcome. Still, many have found solar energy to be an excellent supplemental source of power, as demonstrated by the increasing popularity of installing solar panels on home, business, and municipal rooftops.
16.4.2 Wind Power
Wind power is a renewable energy source that uses the energy of moving air to generate electricity. Winds are caused by differences in atmospheric pressure across the globe. These pressure differentials themselves are largely caused by the temperature differences that result from uneven solar heating across the Earth. In this way, wind energy is an indirect form of solar energy. Similar to solar energy, some locations of the Earth’s surface possess greater wind speeds and therefore a greater capacity for the harvesting of wind energy. Many locations with excellent wind power capacity are found on top of the ocean and are beginning to be utilized through the construction of offshore wind farms.
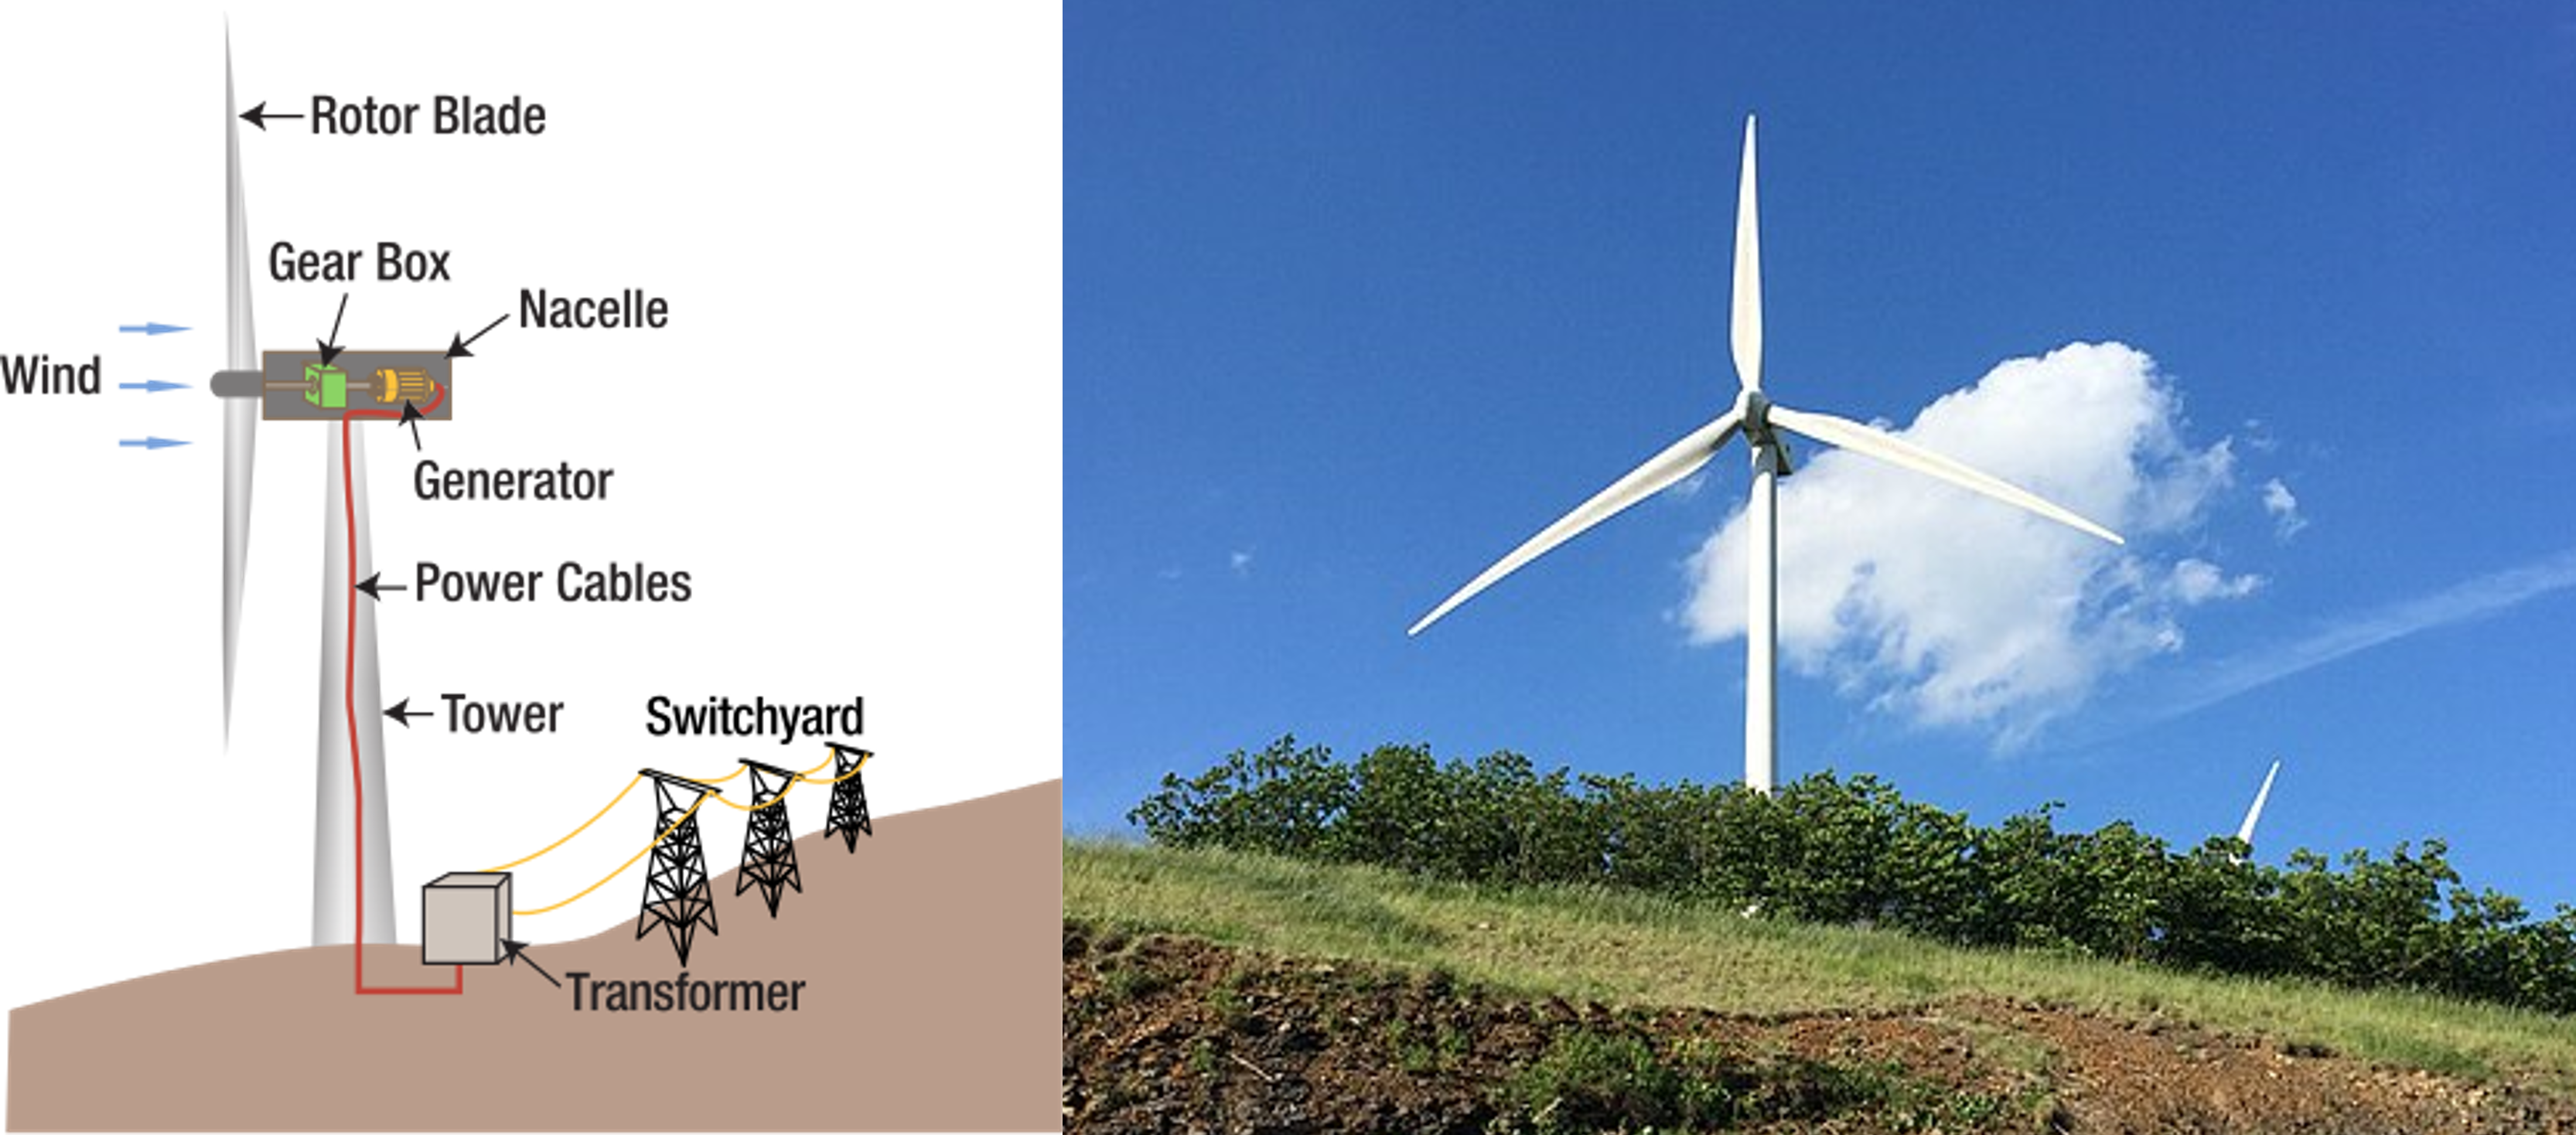
The most common way to collect and transform the wind’s energy into a usable form is through wind turbines. These turbines use blades to collect the wind’s kinetic energy. This technology has been in use for hundreds of years in the form of windmills. While traditional windmills used wind energy to pump water or grind grain, modern wind turbines convert this energy to electricity through the use of a generator. Wind flows over the blades of a turbine, creating lift (similar to the effect on airplane wings), which causes the blades to turn. The blades are connected to a drive shaft that turns an electric generator, which produces electricity.
Wind turbines do not release emissions that pollute the air or water, and they do not require water for cooling. Since a wind turbine has a small physical footprint relative to the amount of electricity it produces, many wind farms are located on crop, pasture, forest land, or coastal areas. They contribute to economic sustainability by providing extra income to farmers and ranchers. Similar to PV solar systems, wind turbines are practical at the small scale and can be used in remote areas to generate electricity, even in the absence of electrical grid infrastructure. Similar to PV solar systems, it is impossible to store wind and use it on demand. Because of this, wind turbines may be intermittent in their production of power, only producing electricity when the wind is blowing.
Still, wind turbines do have a few environmental challenges. There are aesthetic concerns for some people who see them on the landscape (“Not In My Back Yard,” or NIMBY, syndrome). A few wind turbines have caught on fire, and some have leaked lubricating fluids, though this is relatively rare. Wind turbines do produce noise pollution, which can impact both human and animal populations. Additionally, turbines have been found to cause bird and bat deaths, particularly if they are located along their migratory path. This is of particular concern if these are threatened or endangered species. There are ways to mitigate that impact, and they are currently being researched.
16.4.3 Hydroelectric Power
Hydroelectric power, also known as hydropower, is the second largest source of renewable energy used, next to biomass energy. Similar to wind power, hydropower has been used for hundreds of years as the kinetic energy from moving water was used to turn a mill and grind grain. For most types of hydropower, locations are limited to regions with rivers that are large enough and have a flow strong enough to support a hydropower station. At times when the river is low, there may not be sufficient flow to operate hydropower stations, causing this form of energy to be somewhat limited by both geographical and seasonal factors.
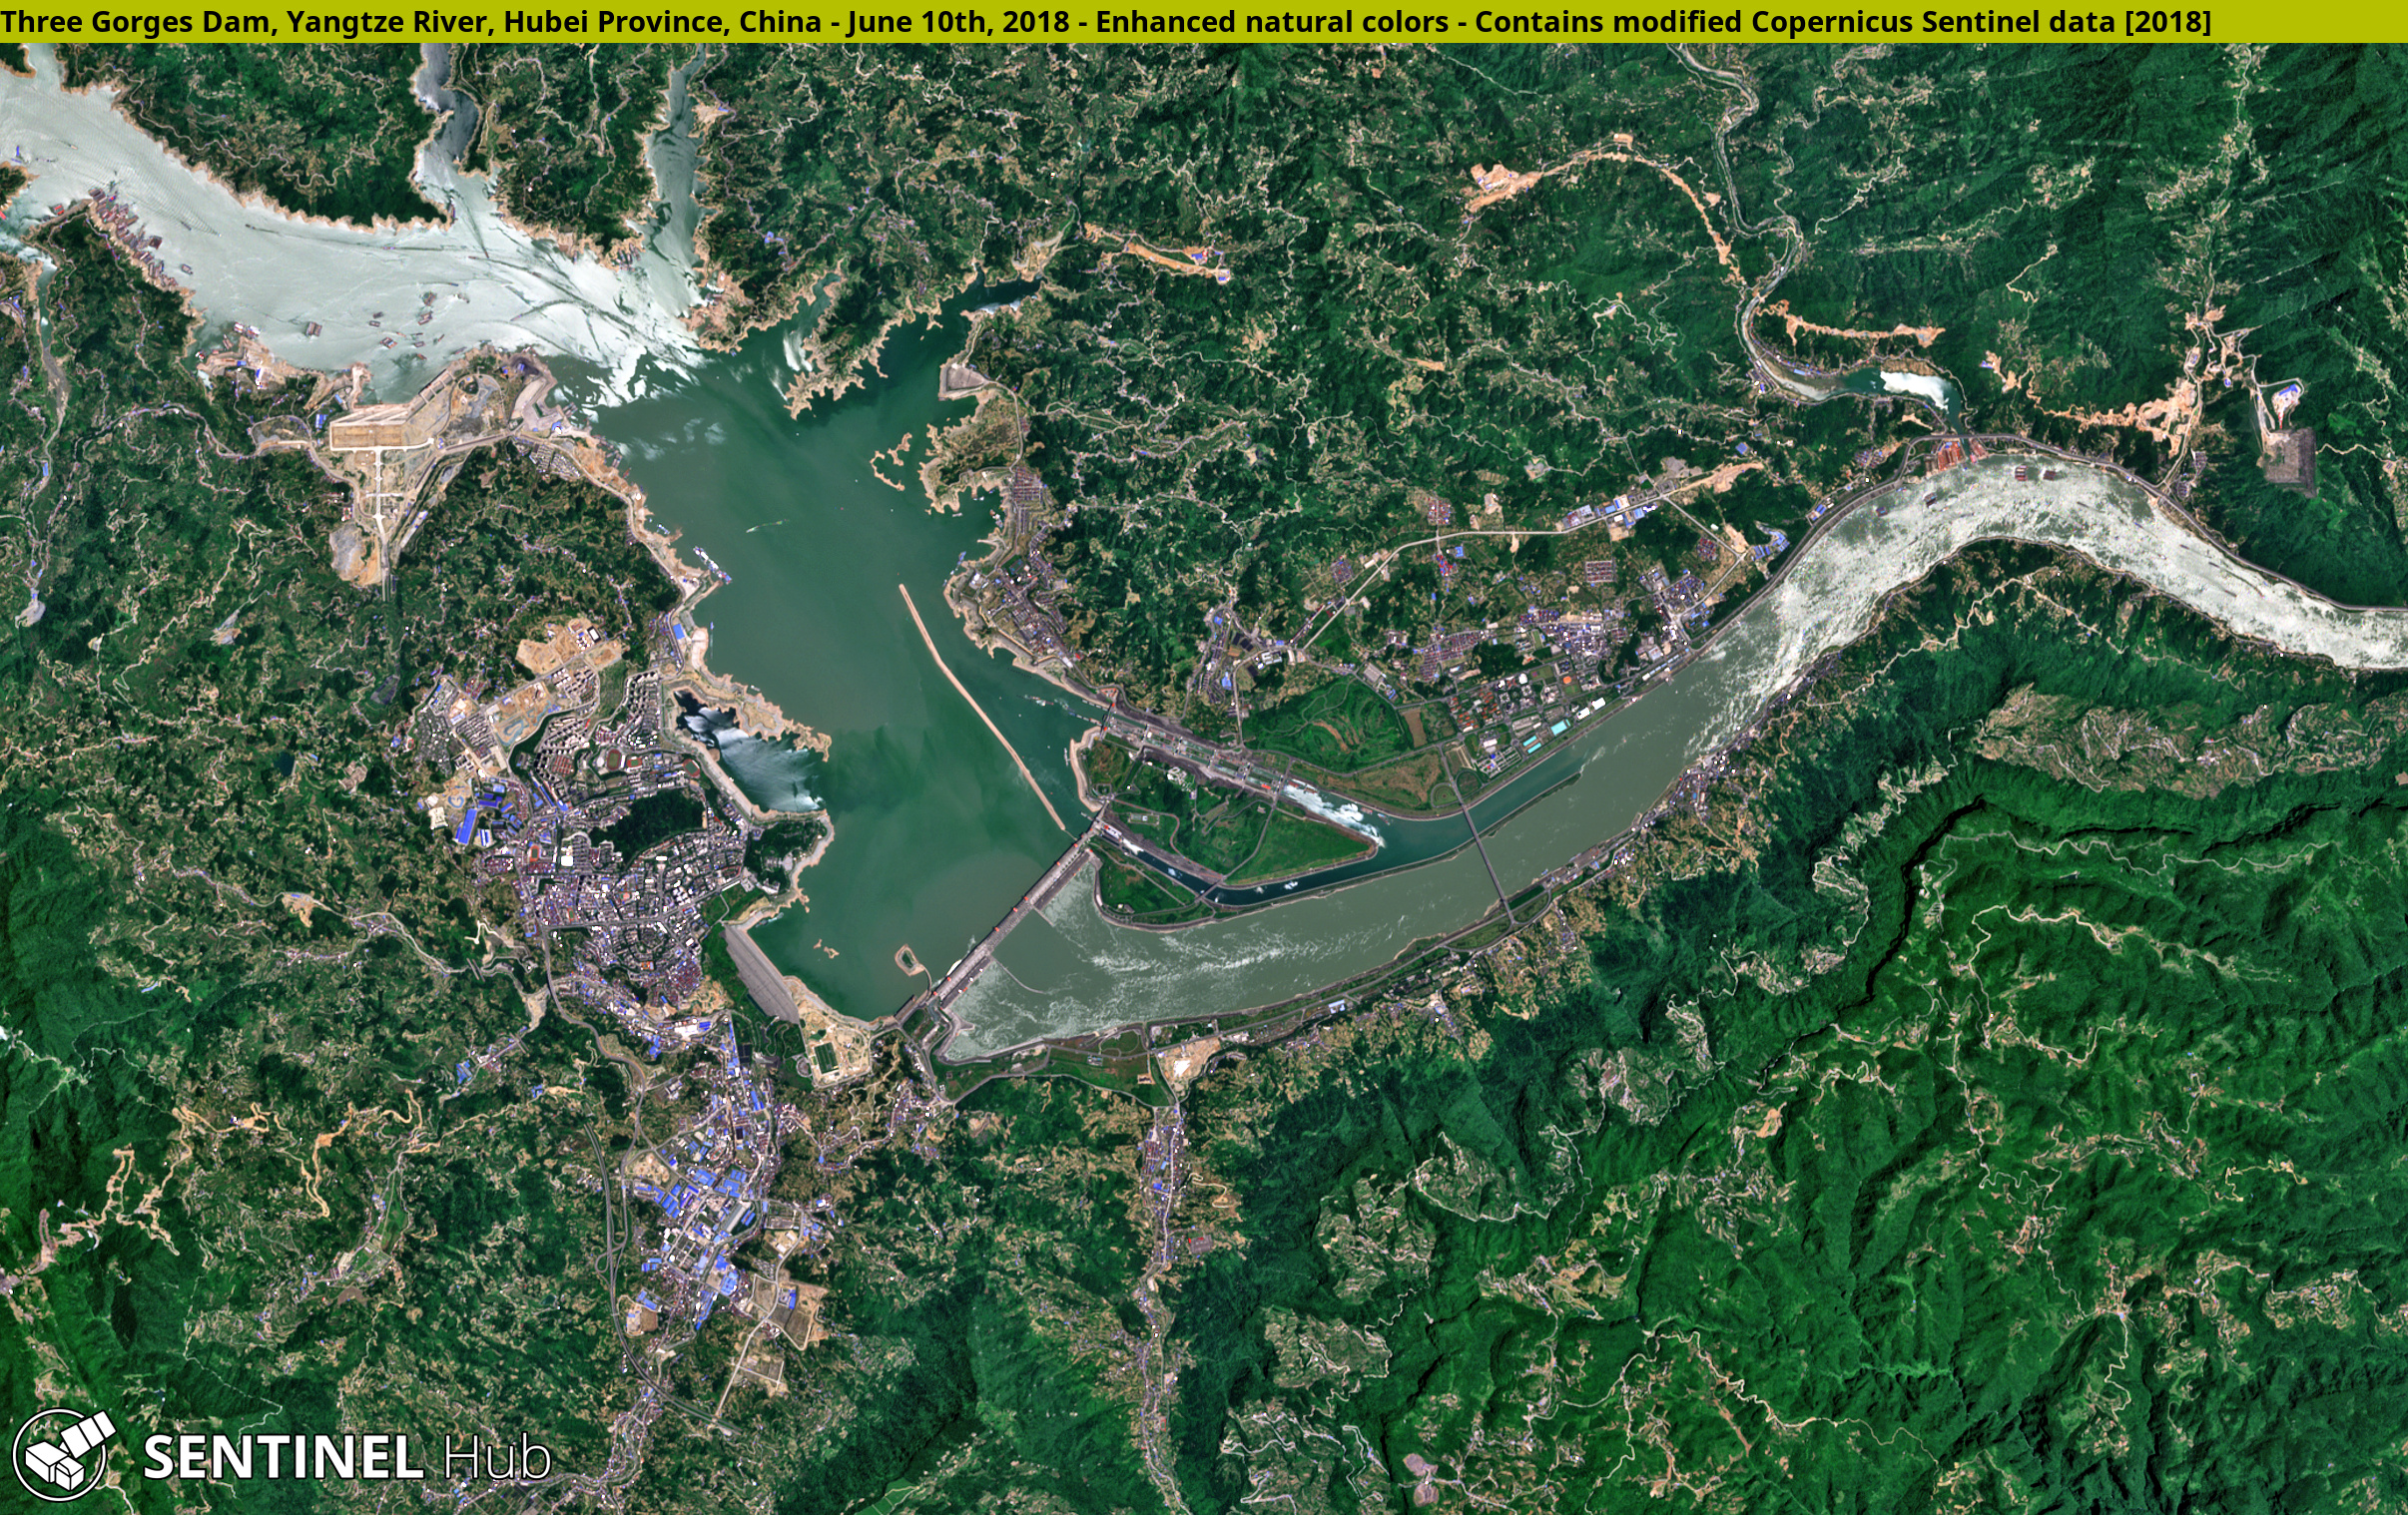
The majority of hydropower in the world exists in the form of storage hydropower, in which dams are built across a river to block the flow of river water. The water stored behind the dam contains potential energy, and when released, the potential energy is converted to kinetic energy as the water rushes down. In addition to providing a source of hydroelectric power, the dam also creates a reservoir, or manmade lake, in the area upstream of the dam. Many of the largest power plants in the world are storage hydropower facilities, including the Three Gorges Dam in China, the world’s largest power plant by installed capacity at 22,500 MW, and the Grand Coulee Dam in Washington, US, at over 6,800 MW.
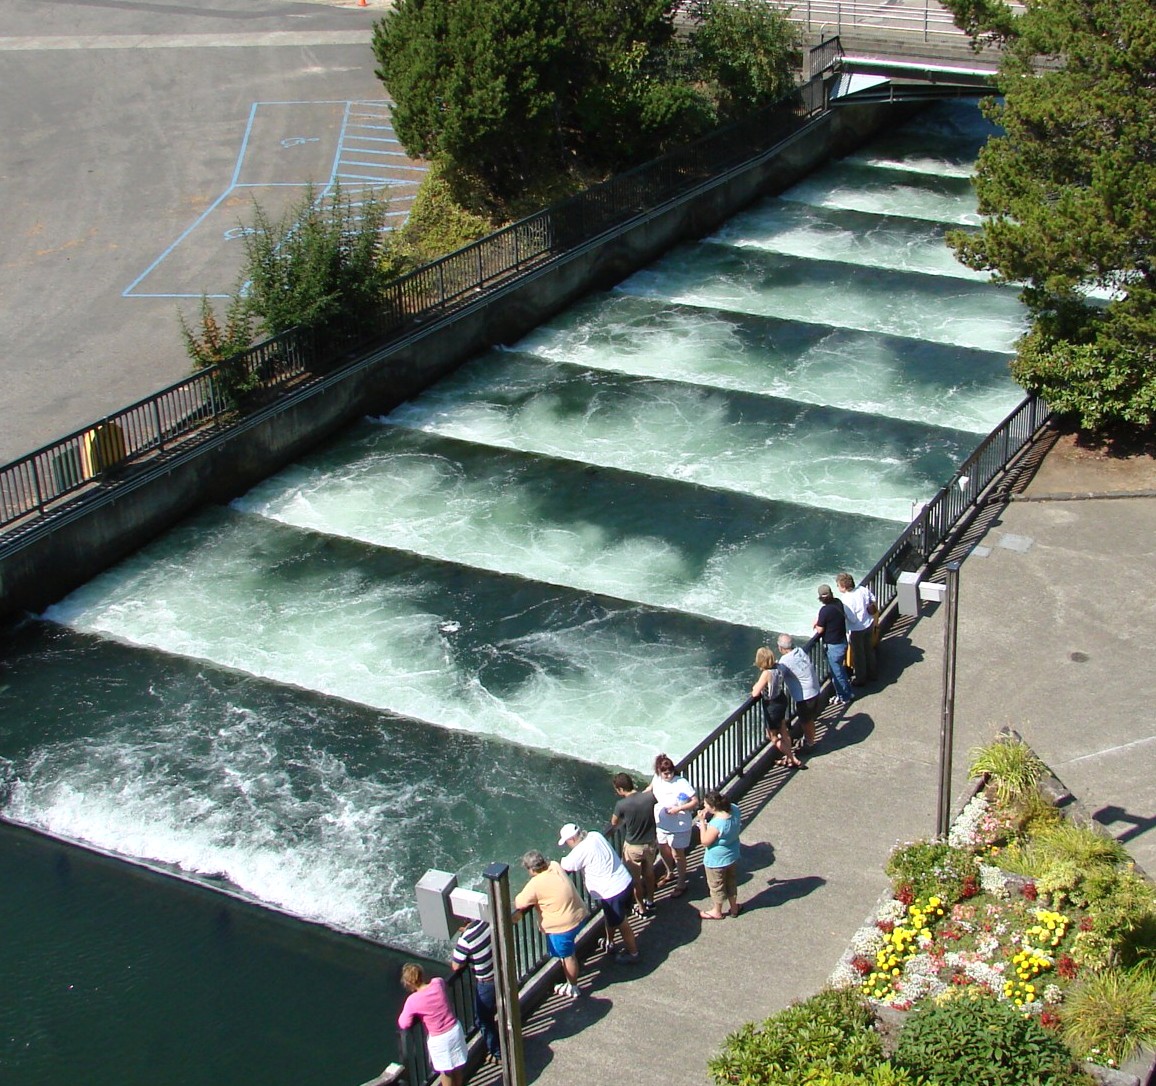
Hydropower is a renewable source of energy since it does not directly produce emissions of air pollutants, it consumes no nonrenewable fuel sources, and the source of power is constantly regenerated. However, hydropower dams, reservoirs, and the operation of generators can have serious environmental impacts. For example, the migration of fish to their upstream spawning areas can be obstructed by dams. In areas where salmon must travel upstream to spawn, such as along the Columbia River in Washington and Oregon, the dams block their way. This problem can be partially alleviated by using “fish ladders” that help salmon get around the dams. Fish traveling downstream, however, can get killed or injured as water moves through turbines in the dam. Reservoirs and the operation of dams can also affect aquatic habitats due to changes in water temperatures, water depth, chemistry, flow characteristics, and sediment loads, all of which can lead to significant changes in the ecology and physical characteristics of the river both upstream and downstream. As reservoirs fill with water, it may cause natural areas, farms, cities, and archeological sites to be inundated and force populations to relocate.
16.4.4 Geothermal Energy
Geothermal energy uses heat from the Earth’s internal geologic processes to produce electricity or provide heating. The subsurface temperature of the Earth provides an essentially endless energy resource. The energy harvested in a geothermal power plant is the same energy that forms geysers and hot springs. The heat from the Earth’s core continuously flows outward. Sometimes the heat, as magma, reaches the surface as lava, but it usually remains below the Earth’s crust, heating nearby rock and water, sometimes to levels as hot as 370°C. When water is heated by the Earth’s heat, hot water or steam can be trapped in permeable and porous rocks under a layer of impermeable rock and a geothermal reservoir can form.
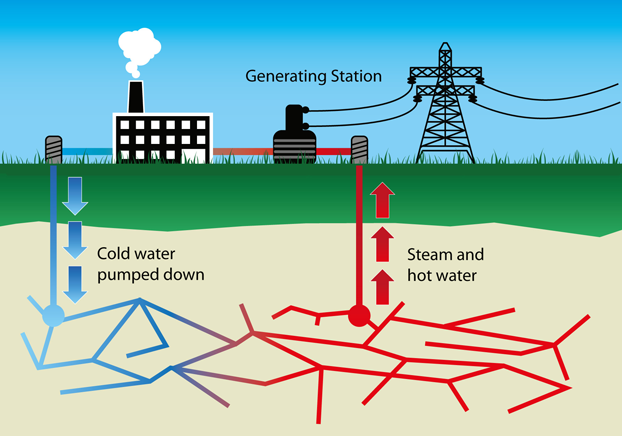
A geothermal system requires heat, permeability, and water. To develop electricity from geothermal resources, wells are drilled in a location with high geothermal potential. This is typically a region containing naturally superheated groundwater. Groundwater percolates down through cracks in the subsurface rocks until it reaches rocks heated by underlying magma, and the heat converts the water to steam. Many areas with strong seismic activity, including earthquakes and volcanoes, also possess high geothermal potential. Examples include the country of Iceland and many regions of California and the North American Pacific Coast.
The environmental impact of geothermal energy depends on how it is being used. Direct use and heating applications have almost no negative impact on the environment. Geothermal power plants do not burn fuel to generate electricity, so their emission levels are very low. Some carbon dioxide and methane gas are emitted, but to a much smaller degree than the combustion of fossil fuels or biomass. Even though geothermal energy is renewable, not every plant built to capture this energy will be able to operate indefinitely because the energy relies on groundwater recharge. If the heated water is used faster than the recharge rate of ]groundwater, the plant will eventually run out of water. Additionally, patterns of geothermal activity in the Earth’s crust naturally shift over time, and an area that produces hot groundwater now may not always so do. The water of many hot springs is laced with salts and minerals that can corrode equipment, shorten the lifetime of plants, and increase maintenance costs.
16.4.5 Biomass Energy
Biomass energy, or bioenergy, is the energy stored in materials of biological origin such as plants and animals, and it is the oldest energy source used by humans. Until the Industrial Revolution prompted a shift to fossil fuels in the mid-eighteenth century, biomass energy was the world’s dominant fuel source.

It includes direct combustion of solid biomass to provide energy for heating, cooking, and even generating electricity. Biomass can also be converted into liquid biofuels used to power vehicles, such as ethanol from corn, sugarcane residue, and soybeans (even used cooking oil can be repurposed as biodiesel). Biomass energy can also be harvested through gaseous biomass, sometimes called biogas, in the form of methane. Biomass is most frequently used as a fuel source in many less-industrialized nations, but with the decline of fossil fuel availability and the increase in fossil fuel prices, biomass is increasingly being used as a fuel source, even in more-industrialized nations.
A major challenge of biomass is determining if it is really a more sustainable option. The energy content of some biomass energy sources may not be as high as fossil fuels, so more must be burned to generate the same energy. It often takes energy to make energy, and biomass is one example where the processing required to make it may not be offset by the energy it produces. If conventional agriculture crops like corn or soybeans are used, they require major quantities of fossil fuel to manufacture fertilizer, run farm machines, and ship the fuel to markets, so these biofuels do not always offer significant net energy savings over gasoline and diesel fuel. Even if the environmental impact is net positive—for example, if renewable energy sources are used to make the biofuels—the economic and social effects of growing plants for fuels need to be considered. The land, fertilizers, water, and energy used to grow biofuel crops could be used to grow food crops instead. The competition between land for fuel and land for food can increase the price of food, which has a negative effect on society. It could also decrease the food supply and increase malnutrition and starvation globally.
Burning biomass directly (wood, manure, etc.) produces high-particulate material pollution, produces carbon dioxide, and deprives the soil of nutrients it normally would have received from the decomposition of the organic matter. In order to be used sustainably, one tree must be planted for every one cut down; however, trees that are cut for firewood are frequently not replanted. If too much biomass is taken, it can reduce forest and grassland contributions to ecosystem services. Each type of biomass energy source, therefore, must be evaluated for its full life-cycle impact in order to determine if it is really advancing sustainability and reducing environmental impacts.
Summary
Energy and mineral resources are vital to modern society, and it is the role of the geologist to locate these resources for human benefit. As environmental concerns have become more prominent, the value of the geologist has not decreased, as they are still vital in locating the deposits and identifying the least intrusive methods of extraction.
Energy resources are generally grouped as being renewable or nonrenewable. Geologists can aid in locating the best places to exploit renewable resources (e.g., locating a dam) but are commonly tasked with finding nonrenewable fossil fuels. Mineral resources are also grouped in two categories: metallic and nonmetallic. Minerals have a wide variety of processes that concentrate them to economic levels and are usually mined via surface or underground methods.

Take this quiz to check your comprehension of this chapter.
If you are using an offline version of this text, access the quiz for Chapter 16 via the QR code.
Text References
- Ague, J.J., and Brimhall, G.H. (1989). Geochemical modeling of steady state fluid flow and chemical reaction during supergene enrichment of porphyry copper deposits. Economic Geology and the Bulletin of the Society of Economic Geologists, 84(3), 506–28. http://economicgeology.org.
- Arndt, N.T. (1994). Chapter 1: Archean Komatiites, in Condie, K.C. (ed.), Developments in Precambrian geology: Elsevier, 11–74.
- Bárdossy, György, and Aleva, G.J.J. (1990). Lateritic Bauxites, Vol. 27: Elsevier Science Ltd.
- Barrie, C.T. (1999). Volcanic-associated massive sulfide deposits: Processes and examples in modern and ancient settings. Reviews in Economic Geology, 8. https://www.researchgate.net/pro.le/Michael_Per.t/publication/241276560_Geologic_petrologic_and_geochemical_relationships_between_magmatism_and_massive_sul.de_mineralization_along_the_eastern_Galapagos_Spreading_Center/links/02e7e51c8707bbfe9c000000.pdf.
- Barrie, L. A., and Ho, R.M. (1984). The oxidation rate and residence time of sulphur dioxide in the Arctic atmosphere.” Atmospheric Environment, 18(12), 2711–22.
- Bauquis, P.-R. (1998). What future for extra heavy oil and bitumen: The Orinoco case, in paper presented by TOTAL at the World Energy Congress, 13:18.
- Belloc, H. (1913). The servile state: T.N. Foulis.
- Blander, M., Sinha, S., Pelton, A., and Eriksson, G. (2011). Calculations of the influence of additives on coal combustion deposits. Argonne National Laboratory, Lemont, Illinois, 315.
- Boudreau, A.E. (2016). The Stillwater Complex, Montana–Overview and the significance of volatiles. Mineralogical Magazine, 80(4), 585–637.
- Bromfield, C.S., Erickson, A.J., Haddadin, M.A., and Mehnert, H.H. (1977). Potassium-argon ages of intrusion, extrusion, and associated ore deposits, Park City Mining District, Utah. Economic Geology and the Bulletin of the Society of Economic Geologists, 72(5), 837–48.
- Brown, V.J. (2007). Industry issues: Putting the heat on gas. Environmental Health Perspectives, 115(2), A76.
- Cabri, L.J., Harris, D.C., and Weiser, T.W. (1996). Mineralogy and distribution of platinum-group mineral (PGM) placer deposits of the world. Exploration and Mining Geology, 2(5), 73–167.
- Crutzen, P.J., and Lelieveld, J. (2001). Human impacts on atmospheric chemistry. Annual Review of Earth and Planetary Sciences, 29(1), 17–45.
- Delaney, M.L. (1998). Phosphorus accumulation in marine sediments and the oceanic phosphorus cycle. Global Biogeochemical Cycles, 12(4), 563–72.
- Demaison, G.J., and Moore, G.T. (1980). Anoxic environments and oil source bed genesis. Organic Geochemistry, 2(1), 9–31.
- Dott, R.H., and Reynolds, M.J. (1969). Sourcebook for petroleum geology: American Association of Petroleum Geologists. http://archives.datapages.com/data/specpubs/methodo1/data/a072/a072/0001/0000/vi.htm.
- Duffield, W.A. (2005). Volcanoes, Geothermal Energy, and the Environment, in Volcanoes and the environment: Cambridge University Press, 304.
- Einaudi, M.T., and Burt, D.M. (1982). Introduction: Terminology, classification, and composition of skarn deposits. Economic Geology and the Bulletin of the Society of Economic Geologists, 77(4), 745–54.
- Gandossi, L. (2013). An overview of hydraulic fracturing and other formation stimulation technologies for shale gas production.” Eur. Commission Jt. Res. Cent. Tech. Reports. http://skalunudujos.lt/wp-content/uploads/an-overview-of-hydraulic-fracturing-and-other-stimulation-technologies.pdf.
- Gordon, M., Jr., Tracey, J.I. Jr., and Ellis, M.W. (1958). Geology of the Arkansas bauxite region. http://pubs.er.usgs.gov. https://pubs.er.usgs.gov/publication/pp299.
- Gordon, W.A. (1975). Distribution by latitude of Phanerozoic evaporite deposits. The Journal of Geology, 83(6), 671–84.
- Haber, F. (2002). The synthesis of ammonia from its elements – Nobel lecture, June 2, 1920. Resonance, 7(9), 86–94.
- Hawley, C.C. (2014). A Kennecott story: Three mines, four men, and one hundred years, 1887-1997: University of Utah Press.
- Hirsch, R.L., Bezdek, R., and Wendling, R. (2006). Peaking of world oil production and its mitigation. AIChE Journal. American Institute of Chemical Engineers, 52(1), 2–8.
- Hitzman, M., Kirkham, R., Broughton, D., Thorson, J., and Selley, D. (2005). The sediment-hosted stratiform copper ore system. Economic Geology and the Bulletin of the Society of Economic Geologists. http://eprints.utas.edu.au/705.
- Hofstra, A.H., and Cline, J.S. (2000). Characteristics and models for Carlin-type gold deposits. Reviews in Economic Geology, 13, 163–220.
- James, L.P. (1979). Geology, ore deposits, and history of the Big Cottonwood Mining District, Salt Lake County, Utah. Utah Geological and Mineral Survey. Utah Department of Natural Resources.
- Kim, W-Y. (2013). Induced seismicity associated with fluid injection into a deep well in Youngstown, Ohio. Journal of Geophysical Research, [Solid Earth], 118(7), 3506–18.
- Klein, C. (2005). Some Precambrian banded iron-formations (BIFs) from around the world: Their age, geologic setting, mineralogy, metamorphism, geochemistry, and origins. The American Mineralogist, 90(10), 1473–99.
- Laylin, J.K. (1993). Nobel Laureates in Chemistry, 1901-1992: Chemical Heritage Foundation.
- Leach, D. L., and Sangster, D.F. (1993). Mississippi Valley-type lead-zinc deposits. Mineral Deposit Modeling: Geological. https://www.researchgate.net/pro.le/Elisabeth_Rowan/publication/252527999_Genetic_link_between_Ouachita_foldbelt_tectonism_and_the_Mississippi_Valley-type_Leadzinc_deposits_of_the_Ozarks/links/00b7d53c97ac2d6fe7000000.pdf.
- Lehmann, B. (2008). Uranium ore deposits. Rev. Econ. Geol. AMS Online 2008, 16–26.
- London, D., and Kontak, D.J. (2012). Granitic pegmatites: Scientific wonders and economic bonanzas. Elements, 8(4), 257–61.
- Mancuso, J.J., and Seavoy, R.E. (1981). Precambrian coal or anthraxolite: A source for graphite in high-grade schists and gneisses. Economic Geology and the Bulletin of the Society of Economic Geologists, 76(4), 951–54.
- McKenzie, H., and Moore, B. (1970). Social origins of dictatorship and democracy. JSTOR. http://www.jstor.org/stable/27856441.
- Needham, J., Wang, L., and Lu, G.D. (1963). Science and Civilisation in China, Vol. 5: Cambridge University Press.
- Nuss, P., and Eckelman, M.J. (2014). Life cycle assessment of metals: A scientific synthesis. PloS One, 9(7), e101298.
- Orton, E. (1889). The Trenton limestone as a source of petroleum and inflammable gas in Ohio and Indiana: U.S. Government Printing Office.
- Palmer, M.A., Bernhardt, E.S., Schlesinger, W.H., Eshleman, K.N., Foufoula-Georgiou, E., Hendryx, M.S., Lemly, A.D., et al. (2010). Science and regulation. Mountaintop mining consequences. Science, 327(5962), 148–49.
- Pratt, W.E. (1942). Oil in the Earth: University of Kansas Press.
- Quéré, C. Le, Andres, R.J., Boden, T., Conway, T., Houghton, R.A., House, J.I., Marland, G., et al. (2013). The global carbon budget 1959–2011. Earth System Science Data, 5(1), 165–85.
- Richards, J. P. (2003). Tectono-magmatic precursors for porphyry Cu-(Mo-Au) deposit formation. Economic Geology and the Bulletin of the Society of Economic Geologists, 98(8), 1515–33.
- Rui-Zhong, H., Wen-Chao, S., Xian-Wu, B., Guang-Zhi, T., and Hofstra, A.H. (2002). Geology and geochemistry of Carlin-type gold deposits in China. Mineralium Deposita, 37(3-4), 378–92.
- Schröder, K-P, and Smith, R.C. (2008). Distant future of the Sun and Earth revisited. Monthly Notices of the Royal Astronomical Society, 386(1), 155–63.
- Semaw, S., Rogers, M.J., Quade, J., Renne, P.R., Butler, R.F., Dominguez-Rodrigo, M., Stout, D., Hart, W.S., Pickering, T., and Simpson, S.W. (2003). 2.6-million-year-old stone tools and associated bones from OGS-6 and OGS-7, Gona, Afar, Ethiopia.” Journal of Human Evolution, 45(2), 169–77.
- Tappan, H., and Loeblich, A.R. (1970). Geobiologic implications of fossil phytoplankton evolution and time-space distribution.” Geological Society of America Special Papers, 127(January), 247–340.
- Taylor, E.L., Taylor, T.N., and Krings, M. (2009). Paleobotany: The biology and evolution of fossil plants: Elsevier Science.
- Tissot, B. (1979). Effects on prolific petroleum source rocks and major coal deposits caused by sea-level changes. Nature, 277, 463–65.
- Vail, P.R., Mitchum, R.M., Jr, Thompson, S. III, Todd, R.G., Sangree, J.B., Widmier, J.M., Bubb, J.N., and Hatelid, W.G. (1977). Seismic stratigraphy and global sea level changes, in Seismic stratigraphy-applications to hydrocarbon exploration (Payton, C.E., ed.): American Association of Petroleum Geologists Memoir 26, 49–212.
- Vogel, J.C. (1970). Groningen radiocarbon dates IX. Radiocarbon, 12(2), 444–71.
- Willemse, J. (1969). The geology of the Bushveld igneous complex, the largest repository of magmatic ore deposits in the world.” Economic Geology Monograph 4, 1–22.
- Wrigley, E.A. (1990). Continuity, chance and change: The character of the Industrial Revolution in England. Ellen McArthur lectures: Cambridge University Press.
- Youngquist, W. (1998). Shale oil–The elusive energy.” Hubbert Center Newsletter 4.
- Harris, E.P. (2023). Introduction to environmental sciences and sustainability. Creative Commons Attribution 4.0 International License. https://pressbooks.uwf.edu/envrioscience.
- Zehnder, C. Manoylov, K., Mutiti, S., Mutiti, C., VandeVoort, A., and Bennett, D. (2018). Introduction to environmental science: 2nd edition: University System of Georgia. Creative Commons Attribution-NonCommercial-Share Alike 4.0 International License. https://alg.manifoldapp.org/projects/introduction-to-environmentalscience.
- Environmental and Energy Study Institute (EESI). Accessed July 12, 2024. Solar Energy. Creative Commons Attribution License. https://www.eesi.org/topics/solar/description#:~:text=There%20are%20two%20ways%20to,as%20hot%20water%20or%20electricity.
Figure References
Figure 16.1: A Mode 1 Oldowan tool used for chopping. José-Manuel Benito Álvarez. 2007. Public domain. https://commons.wikimedia.org/wiki/File:Canto_tallado_2-Guelmim-Es_Semara.jpg
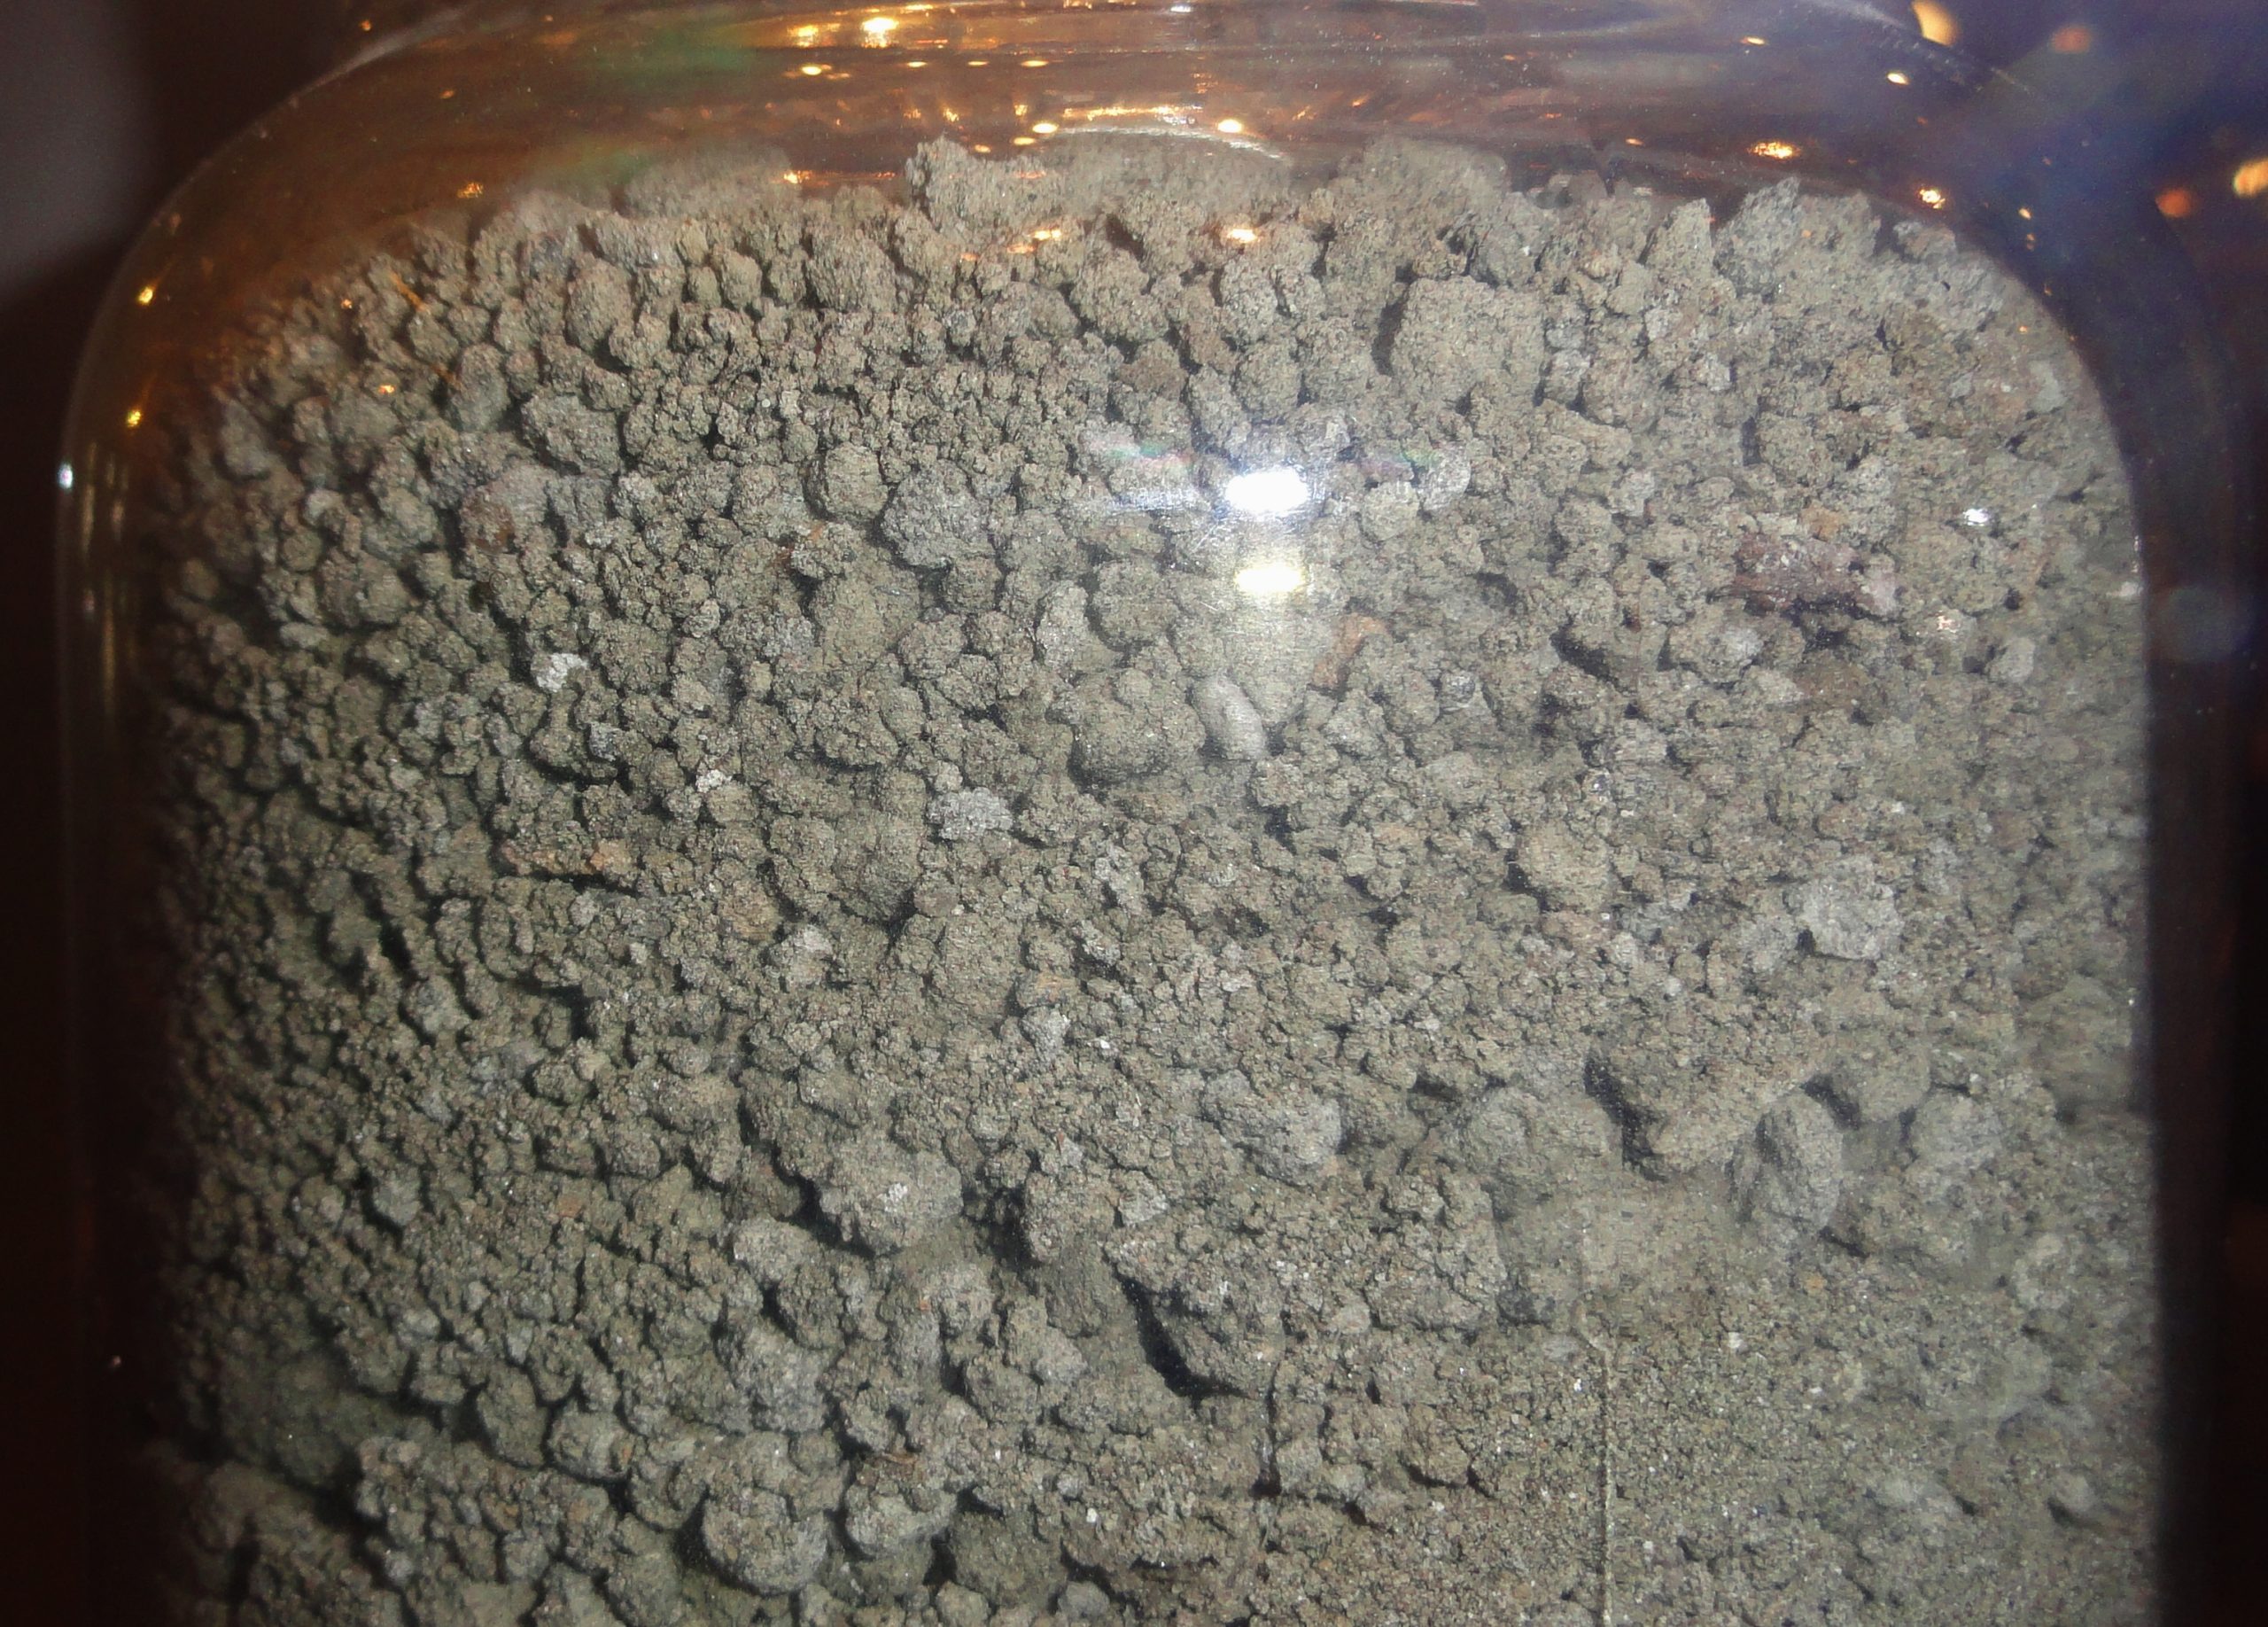
Figure 16.2: A container of phosphate from the Aurora mine in North Carolina. Melissa MB Wilkins. 2012. CC BY-NC 2.0. https://www.flickr.com/photos/melissambwilkins/8444130793
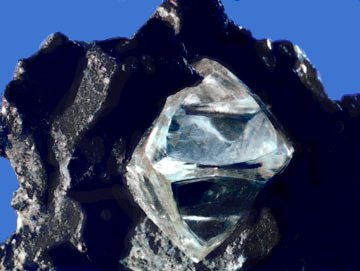
Figure 16.3: Natural octahedral shape of diamond. United States Geological Survey (USGS). 2003. Public domain. https://commons.wikimedia.org/wiki/File:Rough_diamond.jpg
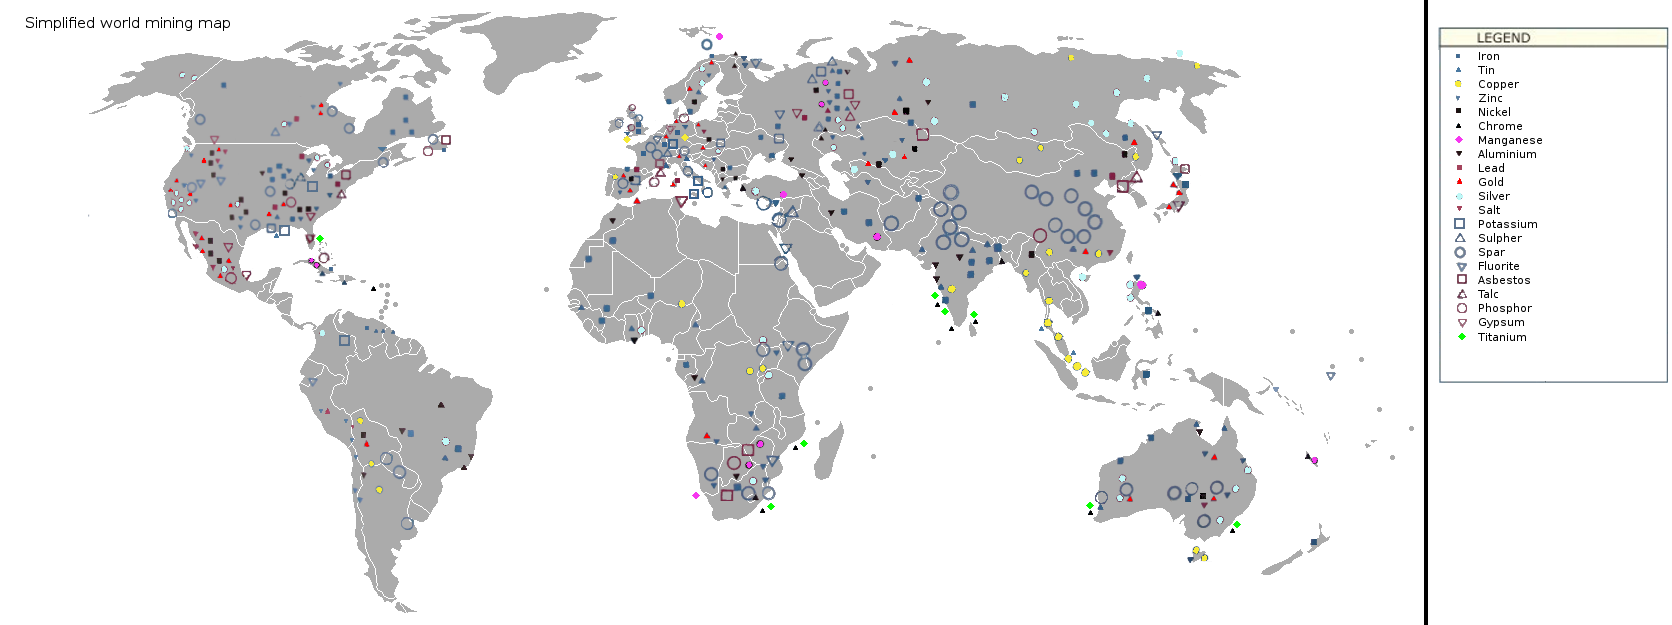
Figure 16.4: Map of world mining areas. KVDP. 2009. Public domain. https://commons.wikimedia.org/wiki/File:Simplified_world_mining_map_1.png
Figure 16.5: Banded-iron formations are an important ore of iron (Fe). Laura Neser. September 2024. CC BY-NC.
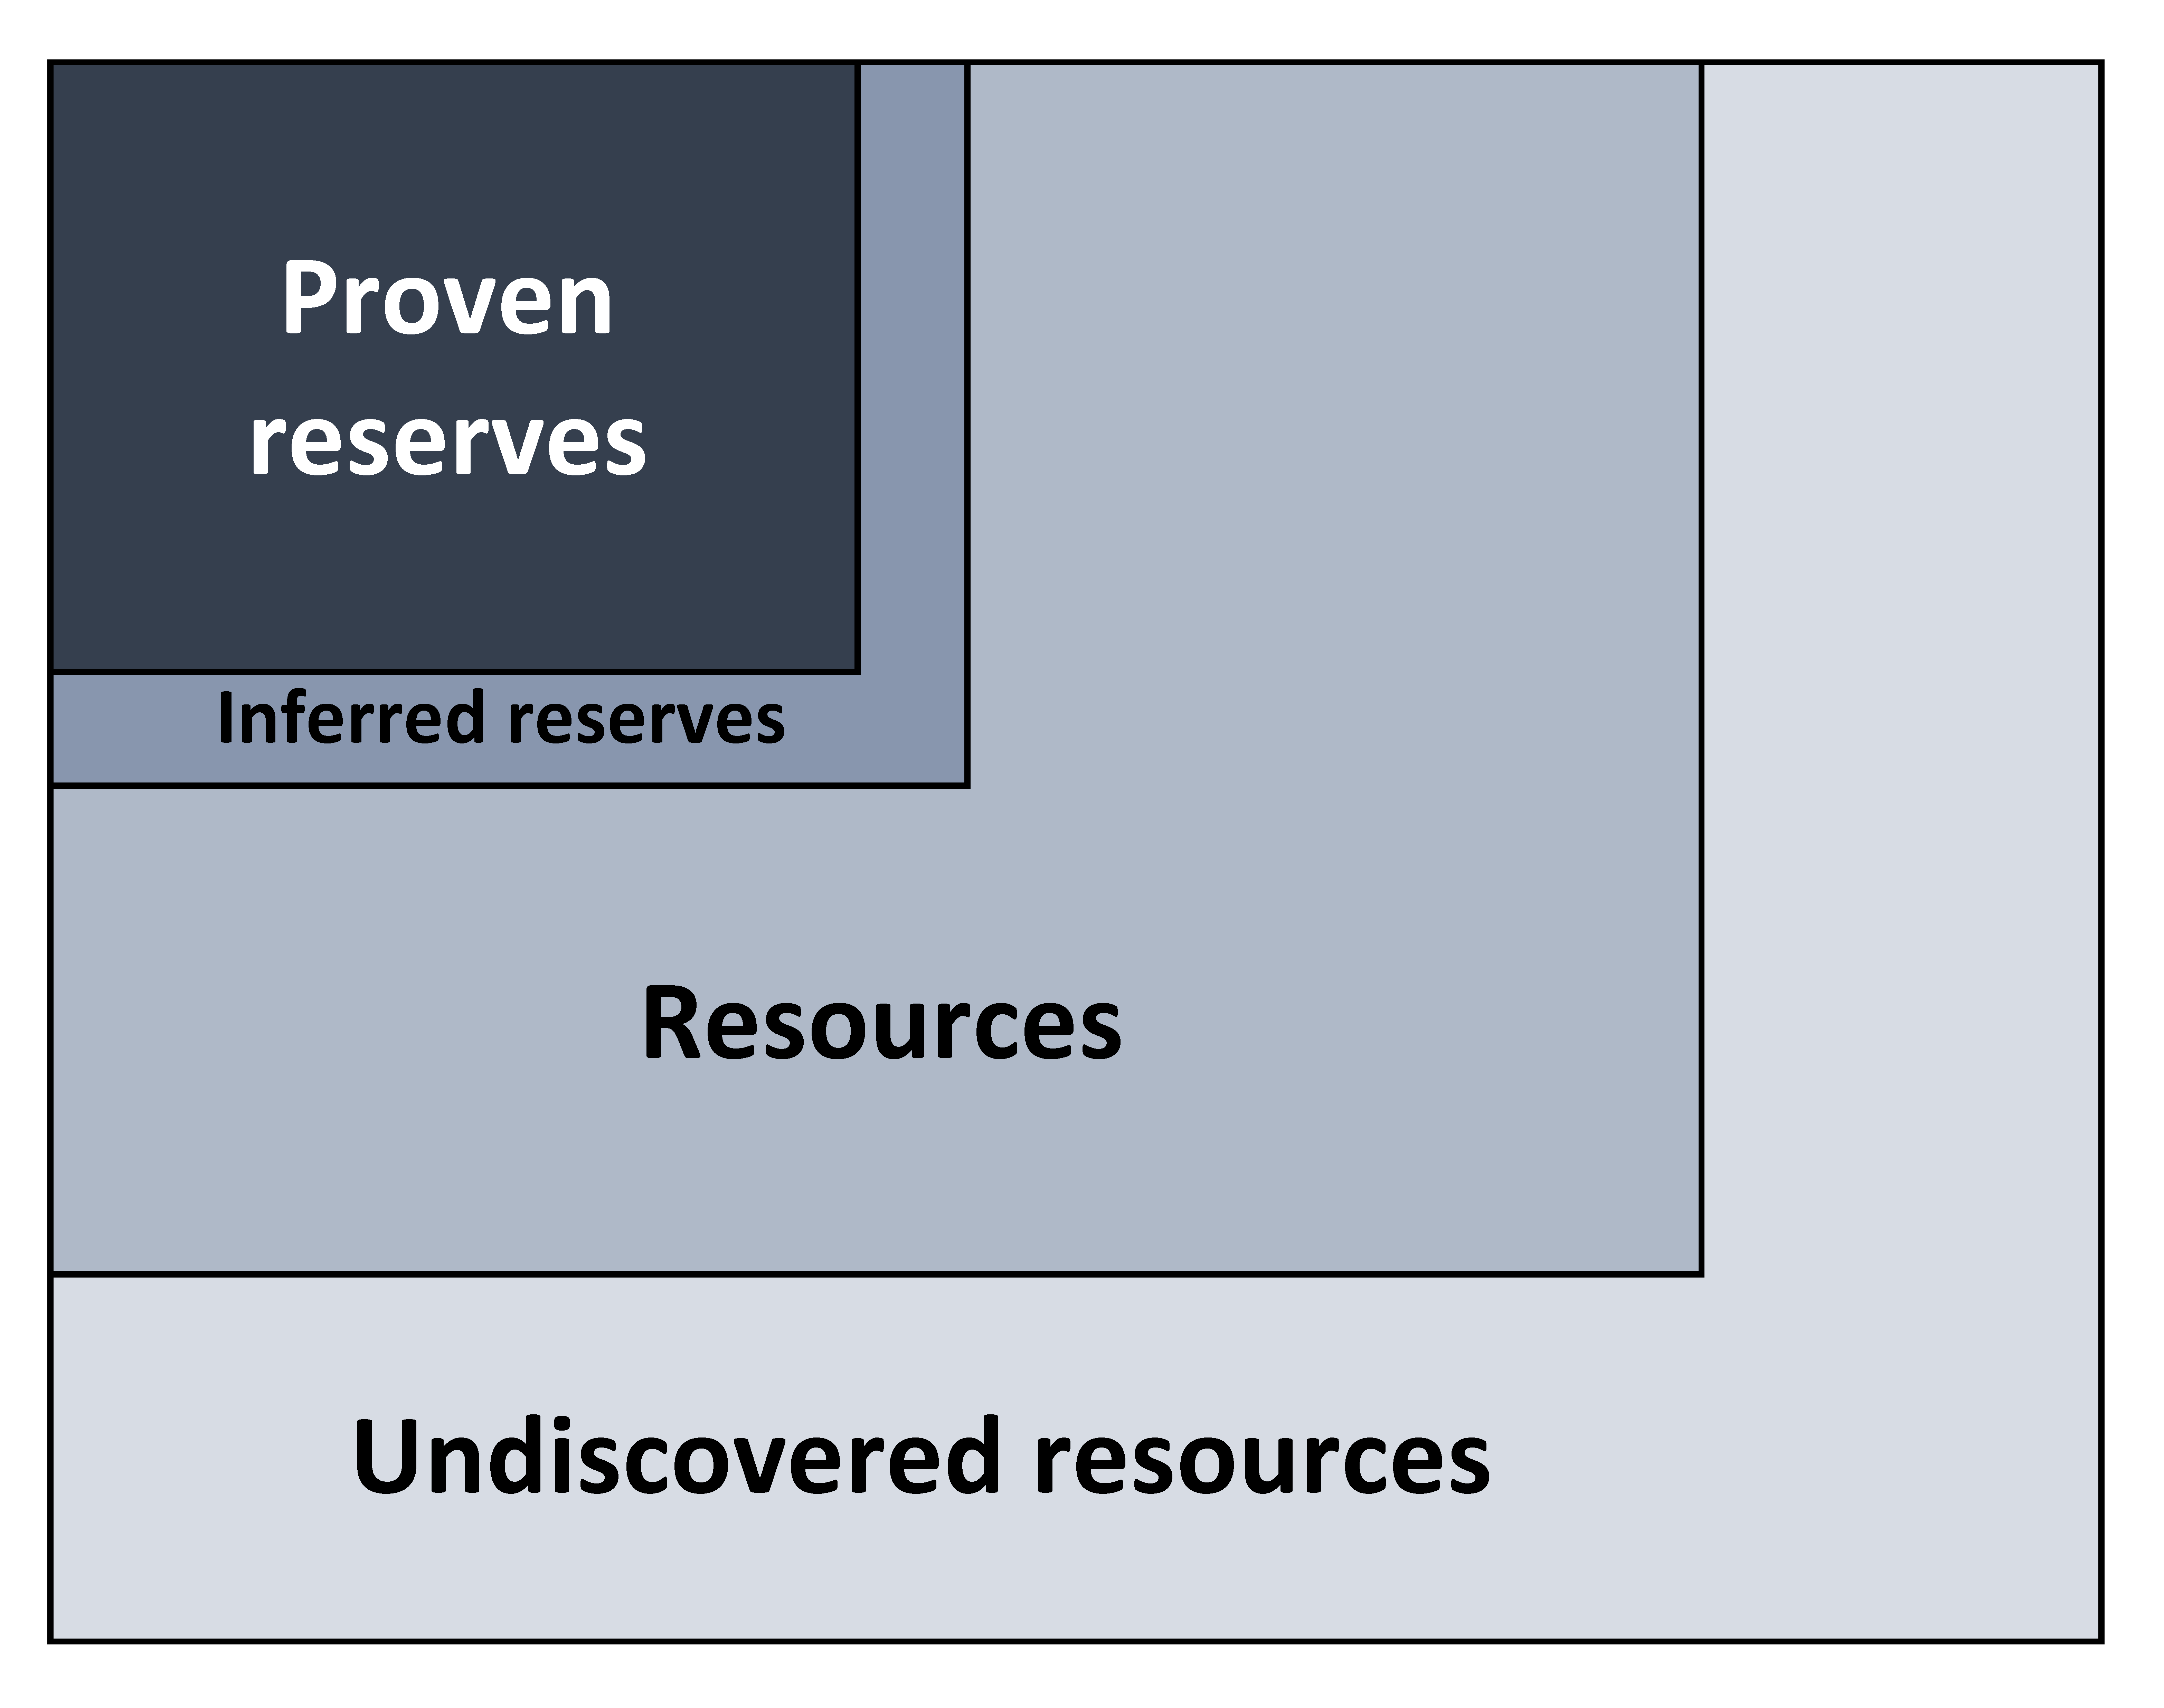
Figure 16.6: Diagram illustrating the relative abundance of proven reserves, inferred reserves, resources, and undiscovered resources. Kindred Grey. 2022. CC BY 4.0.
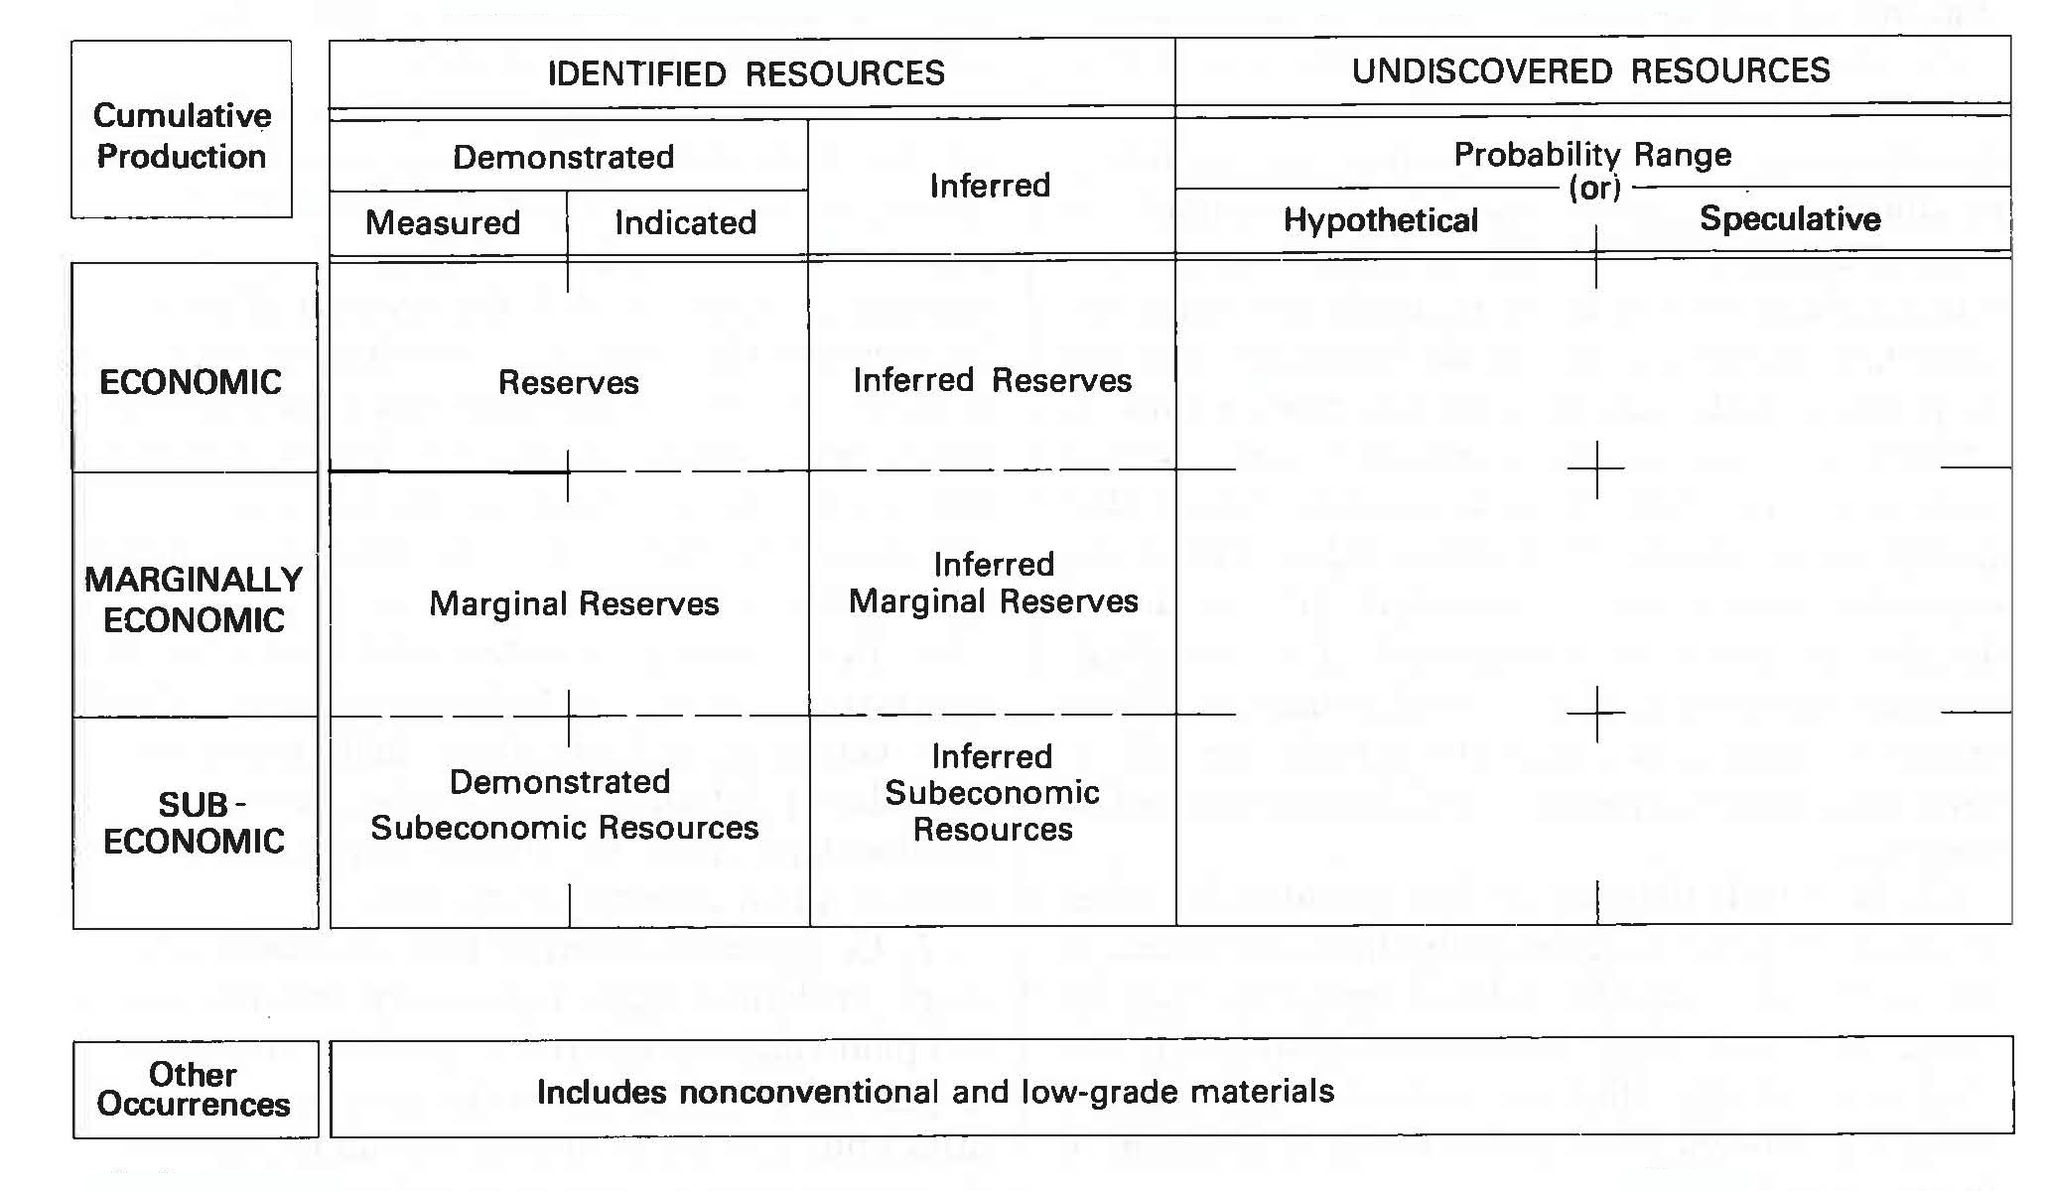
Figure 16.7: McKelvey diagram showing different definitions for different degrees of concentration and understanding of mineral deposits. USGS. 1980. Public domain. https://commons.wikimedia.org/wiki/File:McKelveyDiagram.jpg
Figure 16.8: Bingham Canyon Mine, Utah. Doc Searls. 2016. CC BY 2.0. https://commons.wikimedia.org/wiki/File:Bingham_Canyon_mine_2016.jpg
Figure 16.9: A surface coal mine in Wyoming. Bureau of Land Management. Unknown date. Public domain. https://www.usgs.gov/news/science-snippet/earthword-thermal-maturity
Figure 16.10: Underground oil shale mining in Estonia. Kaupo Kikkas. 2011. CC BY-SA 4.0. https://commons.wikimedia.org/wiki/File:VKG_Ojamaa_kaevandus.jpg
Figure 16.11: A phosphate smelting operation in Alabama, 1942. Alfred T. Palmer. 1942. Public domain. https://commons.wikimedia.org/wiki/File:TVA_phosphate_smelting_furnace.jpg
Figure 16.12: Coal power plant in Helper, Utah. David Jolley. 2007. CC BY-SA 3.0. https://commons.wikimedia.org/wiki/File:Castle_Gate_Power_Plant,_Utah_2007.jpg
Figure 16.13: Modern coral reefs and other highly productive shallow marine environments are thought to be the sources of most petroleum resources. Toby Hudson. 2010. CC BY-SA 3.0. https://commons.wikimedia.org/wiki/File:Coral_Outcrop_Flynn_Reef.jpg
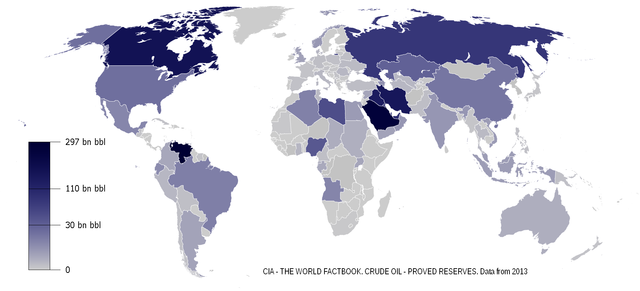
Figure 16.14: World oil reserves in 2013. GunnMap; generated with settings from Emilfaro and A5b. 2014. CC BY-SA 1.0. https://commons.wikimedia.org/wiki/File:Oil_Reserves.png
Figure 16.15: Examples of different forms of hydrocarbon traps in the core region of anticlines. MagentaGreen. 2014. CC BY-SA 4.0. https://commons.wikimedia.org/wiki/File:Anticlinal_Oil_trap.png
Figure 16.16: The rising sea levels of transgressions create onlapping sediments, and regressions create offlapping. Woudloper. 2009. CC BY-SA 1.0. https://commons.wikimedia.org/wiki/File:Offlap_%26_onlap_EN.svg
Figure 16.17: Tar sandstone from the Miocene Monterey Formation of California. James St. John. 2015. CC BY 2.0. https://flic.kr/p/rECMTD
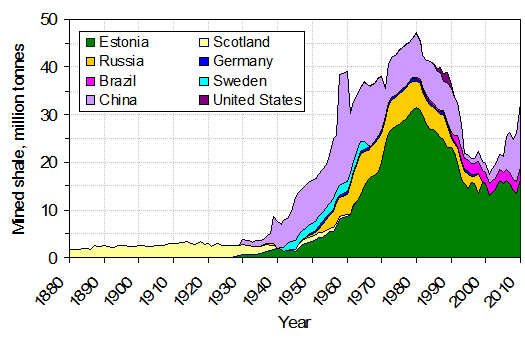
Figure 16.18: Global production of oil shale, 1880–2010. USGS. 2011. Public domain. https://commons.wikimedia.org/wiki/File:Production_of_oil_shale.png
Figure 16.19: Schematic diagram of fracking. Mikenorton. 2012. CC BY-SA 3.0. https://en.wikipedia.org/wiki/File:HydroFrac.png
Figure 16.20: USGS diagram of different coal rankings. USGS. 2009. Public domain. https://commons.wikimedia.org/wiki/File:Coal_Rank_USGS.png
Figure 16.21: Peat (also known as turf) consists of partially decayed organic matter. David Stanley. 2019. CC BY 2.0. https://commons.m.wikimedia.org/wiki/File:Peat_(49302157252).jpg
Figure 16.22: Anthracite coal, the highest grade of coal. USGS. 2007. Public domain. https://commons.wikimedia.org/wiki/File:Coal_anthracite.jpg
Figure 16.23: Gold-bearing quartz vein from California. James St. John. 2014. CC BY 2.0. https://commons.wikimedia.org/wiki/File:Mother_Lode_Gold_OreHarvard_mine_quartz-gold_vein.jpg
Figure 16.24: Layered intrusion of dark chromium-bearing minerals, Bushveld Complex, South Africa. kevinzim/Kevin Walsh. 2006. CC BY 2.0. https://commons.wikimedia.org/wiki/File:Chromitite_Bushveld_South_Africa.jpg
Figure 16.25: This pegmatite contains lithium-rich green elbaite (a tourmaline) and purple lepidolite (a mica). Parent Géry. 2011. CC BY-SA 3.0. https://commons.wikimedia.org/wiki/File:Elba%C3%AFte_et_mica_(Br%C3%A9sil)_1.JPG
Figure 16.26: Schematic diagram of a kimberlite pipe. Asbestos. 2005. CC BY-SA 3.0. https://commons.wikimedia.org/wiki/File:VolcanicPipe.jpg
Figure 16.27: The complex chemistry around mid-ocean ridges. NOAA. 2011. Public domain. https://commons.wikimedia.org/wiki/File:Deep_Sea_Vent_Chemistry_Diagram.svg
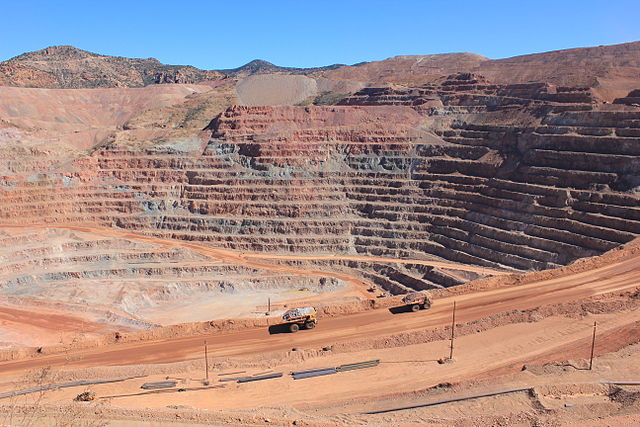
Figure 16.28: The Morenci porphyry is oxidized toward its top (as seen in red rocks in the wall of the mine), creating supergene enrichment. Stephanie Salisbury. 2012. CC BY 2.0. https://commons.wikimedia.org/wiki/File:Morenci_Mine_2012.jpg
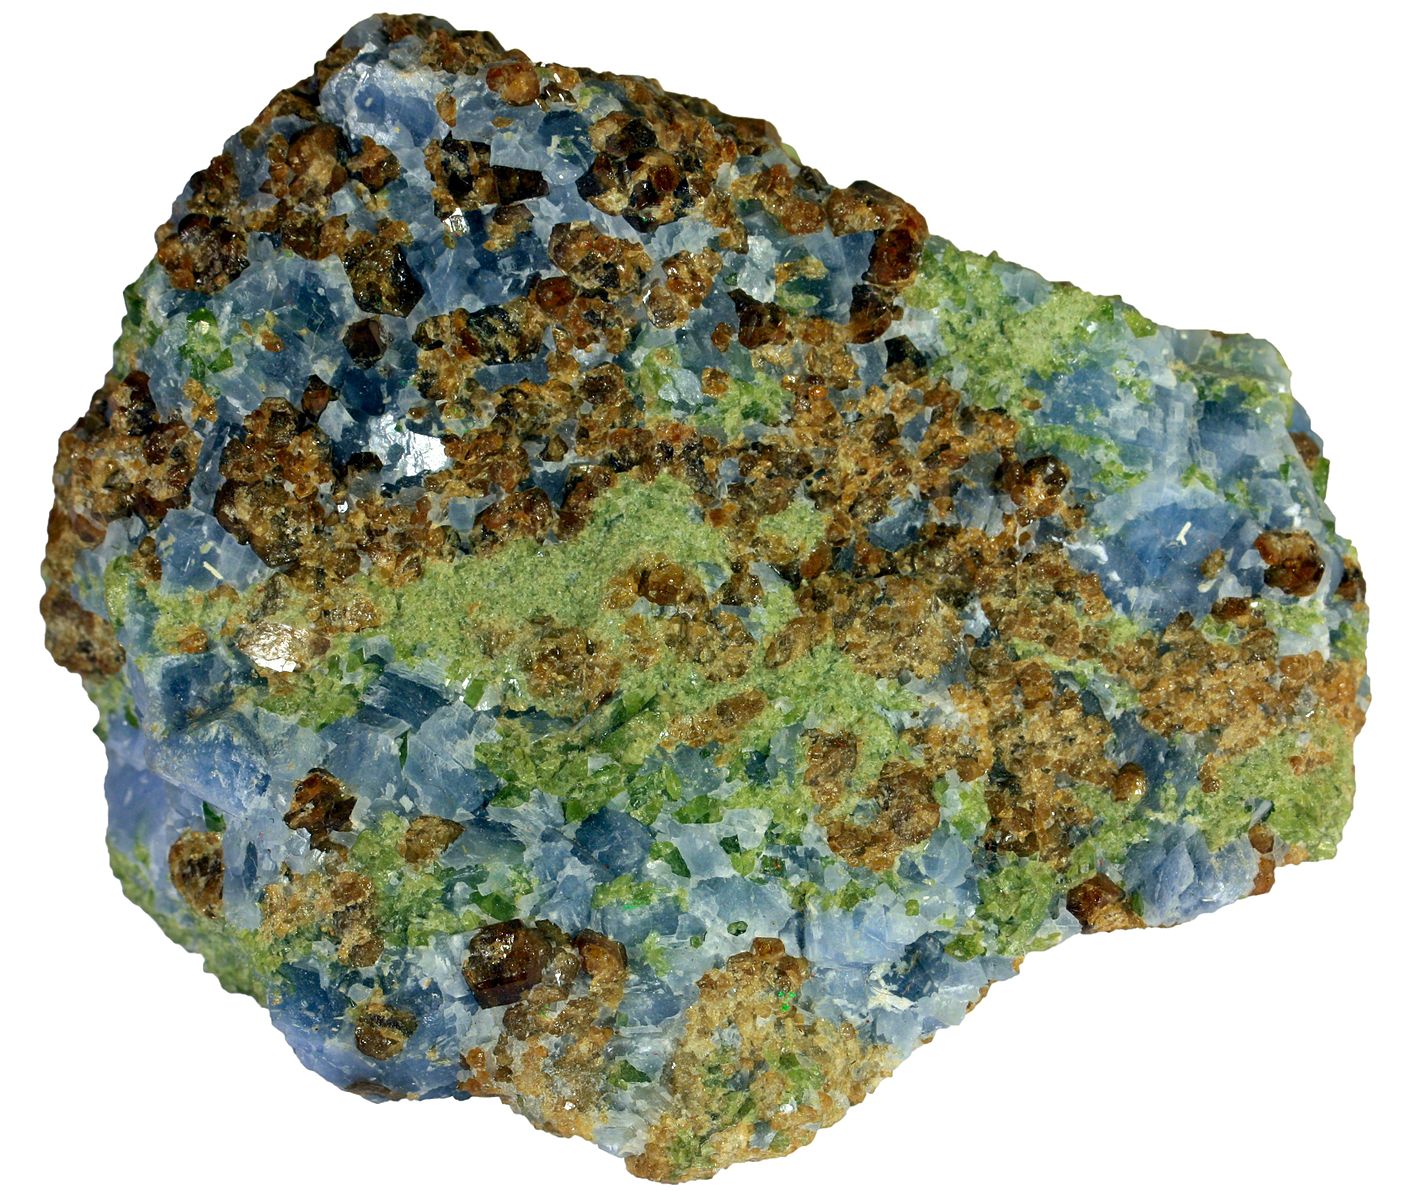
Figure 16.29: Garnet-augite skarn from Italy. Siim Sepp. 2012. CC BY-SA 3.0. https://commons.wikimedia.org/wiki/File:00031_6_cm_grossular_calcite_augite_skarn.jpg
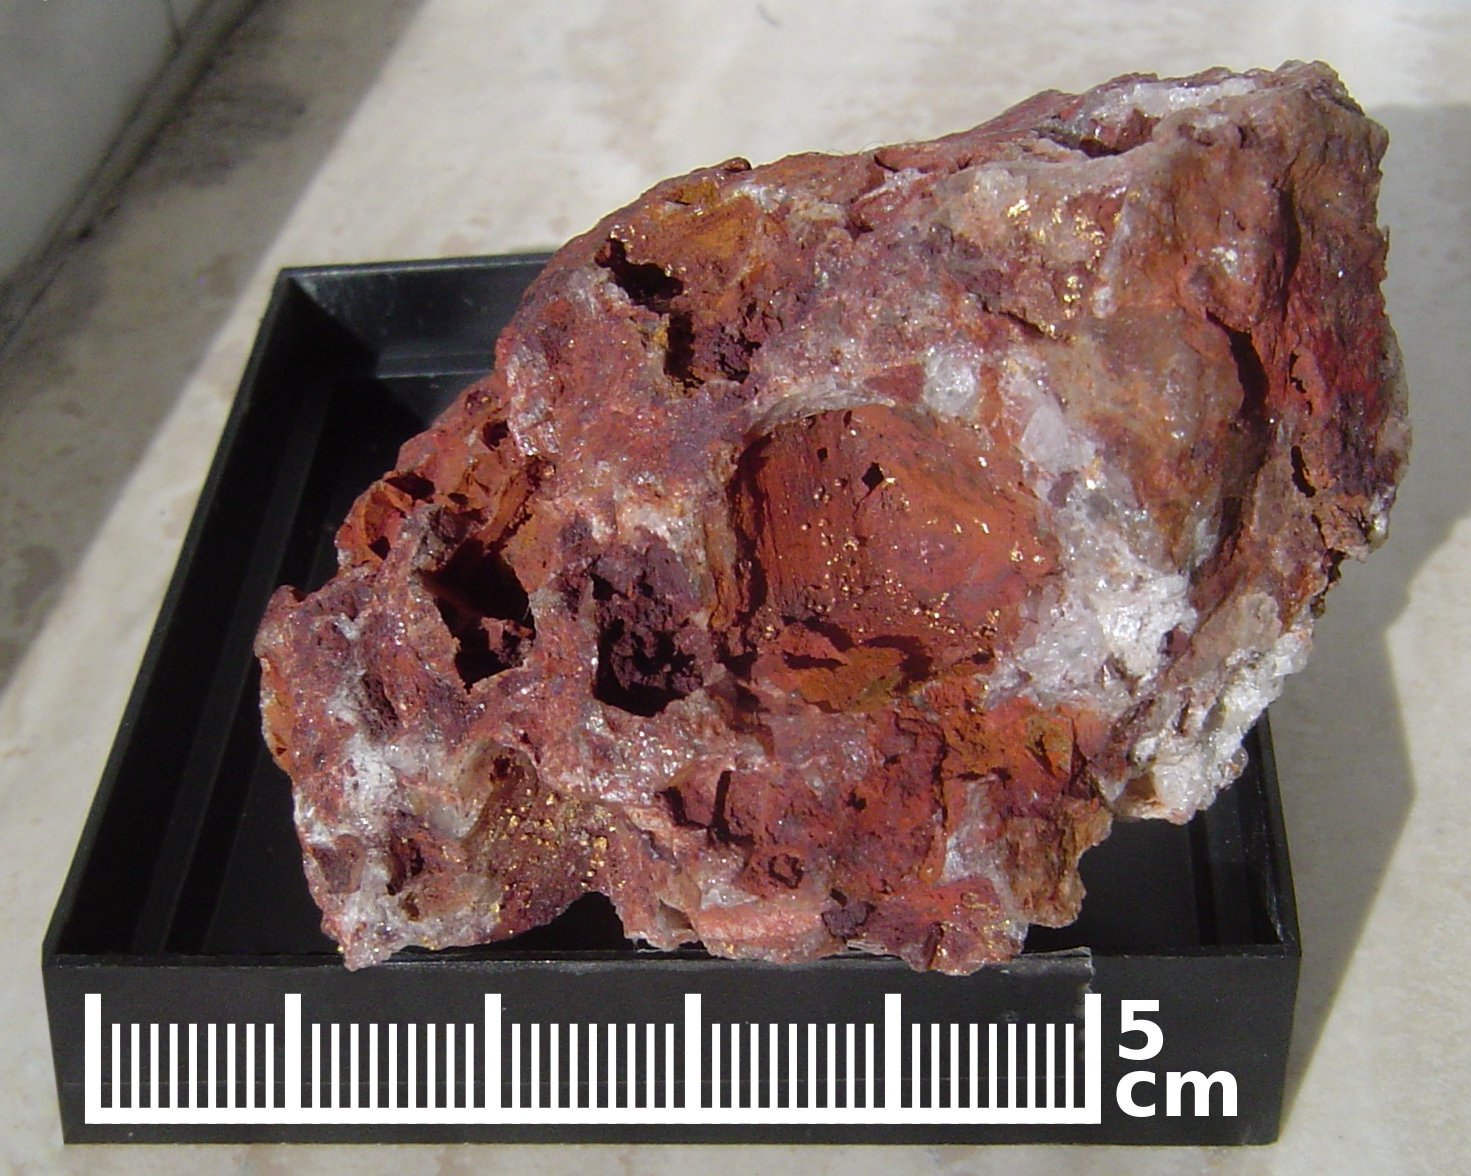
Figure 16.30: In this rock, a pyrite cube has dissolved (as shown by the negative “corner” impression in the rock), leaving behind small specks of gold. Matt Affolter (QFL247). 2009. CC BY-SA 3.0. https://commons.wikimedia.org/wiki/File:GoldinPyriteDrainage_acide.JPG
Figure 16.31: Underground uranium mine near Moab, Utah. Matt Affolter. 2010. CC BY-SA 3.0. https://commons.wikimedia.org/wiki/File:UraniumMineUtah.JPG
Figure 16.32: Map of Mississippi Valley-type ore deposits. Kbh3rd. 2010. CC BY 3.0. https://commons.wikimedia.org/wiki/File:MV-Type_and_clastic_sediment-hosted_lead-zinc_deposits.svg
Figure 16.33: A sample of bauxite. Werner Schellmann. 1965. CC BY-SA 2.5. https://commons.wikimedia.org/wiki/File:Bauxite_with_unweathered_rock_core._C_021.jpg
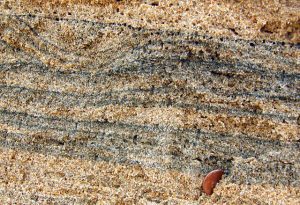
Figure 16.34: Lithified heavy mineral sand (dark layers) from a beach deposit in India. Photograph taken by Mark A. Wilson (Department of Geology, The College of Wooster). 2008. Public domain. https://commons.wikimedia.org/wiki/File:HeavyMineralsBeachSand.jpg
Figure 16.35: Acid mine drainage continues today from a coal mine that was shut down in 1935 near Blacksburg, Virginia, along the Coal Mining Heritage Loop Trail. Laura Neser. September 2021. CC BY-NC.
Figure 16.36: Carrara marble quarry in Italy, source to famous sculptures like Michelangelo’s David. Michele~commonswiki. 2006. CC BY-SA 3.0. https://commons.wikimedia.org/wiki/File:Carrara_Marble_quarry.jpg
Figure 16.37: Crystallized salts compose the formations at Devils Golf Course in Death Valley National Park in the Western United States. Laura Neser. March 2022. CC BY-NC.
Figure 16.38: Hanksite, Na22K(SO4)9(CO3)2Cl, one of the few minerals that is considered a carbonate and a sulfate. Matt Affolter(QFL247). 2009. CC BY-SA 3.0.
Figure 16.39: Apatite from Mexico. Robert M. Lavinsky. Before March 2010. CC BY-SA 3.0. https://commons.wikimedia.org/wiki/File:Apatite-(CaF)-280343.jpg
Figure 16.40: Hoover Dam provides hydroelectric energy and stores water for Southern Nevada. Ubergirl. 2012. CC BY-SA 3.0. https://commons.wikimedia.org/wiki/File:Hoover_Dam,_Colorado_River.jpg
Figure 16.41: (Top) Aerial view of Apple Park, the corporate headquarters of Apple Inc., located in Cupertino, California, one of the biggest solar roofs in the world as of 2018. Daniel L. Lu. 2018. CC BY-SA. https://en.m.wikipedia.org/wiki/File:Aerial_view_of_Apple_Park_dllu.jpg. (Bottom) Closer image of solar panels made of photovoltaic cells on a flat roof. AleSpa. 2012. CC BY-SA.
Figure 16.42: This solar resource map provides a summary of the estimated solar energy available for power generation and other energy applications. Solargis. 2020. CC BY. https://commons.wikimedia.org/wiki/File:World_GHI_Solar-resource-map_GlobalSolarAtlas_World-Bank-Esmap-Solargis.png
Figure 16.43 (Left) Simplified diagram of a wind turbine. Tennessee Valley Authority. Unknown date. Public domain. https://commons.wikimedia.org/wiki/File:Wind_turbine_diagram.svg. (Right) Wind turbine along the Allegheny Front in Grant County, West Virginia. Famartin. 2016. CC BY. https://commons.wikimedia.org/wiki/File:2016-06-06_18_10_21_Wind_turbine_along_the_Allegheny_Front_near_Bismarck_in_Grant_County,_West_Virginia.jpg
Figure 16.44: The Three Gorges Dam. Sentinel Hub. 2019. CC BY. https://www.flickr.com/photos/sentinelhub/47007987002
Figure 16.45: Fish ladder at the Bonneville Dam along the Columbia River, Oregon. Don Graham. 2006. CC BY-SA. https://www.flickr.com/photos/23155134@N06/6506557507/in/photostream
Figure 16.46: Geothermal energy production diagram. Rxn111130. 2015. CC BY-SA. https://commons.wikimedia.org/wiki/File:Geothermal-energy.png
Figure 16.47: Sources and uses of bioenergy. Laura Neser, adapted from Shunkehe. 2024. CC BY-SA. https://commons.wikimedia.org/wiki/File:Biomass-types.webp
Figure Descriptions
Figure 16.1: A brown smooth rock that has chips flaked off of it on one side, sharpening it.
Figure 16.2: A clear rounded container full of dark gray pebbles and rocks.
Figure 16.3: Clear, glassy diamond with an octahedral shape embedded in a black chunk of rock.
Figure 16.4: A world map showing the locations of certain ores in the world. A specific focus has been put on metals and construction materials. The various resources are unevenly distributed across the globe.
Figure 16.5: A slice of rock, showing red, orange, yellow, and brown wavy layers with some layers being translucent. A thumb is seen at the lower left holding the sample.
Figure 16.6: Diagram shows the small box of “reserves” within a larger box of “resources”. There is also an “inferred resources” box that is slightly larger than “proven reserves” box and an “undiscovered resources” box slightly larger than the resources box.
Figure 16.7: Graphical representation of mineral resource classification with respect to economics and geologic certainty. Three rows are labeled economic, marginally economic, and sub-economic. Two columns are labeled identified resources and undiscovered resources. The identified resources column is split into demonstrated and inferred columns, and the demonstrated column is further divided into measured and indicated columns. At the intersection of the demonstrated column and economic row, the box is labeled reserves; at the intersection of the demonstrated column and marginally economic row, the box is labeled marginal reserves; at the intersection of the demonstrated column and sub- economic row, the box is labeled demonstrated subeconomic resources. At the intersection of the inferred column and economic row, the box is labeled inferred reserves; at the intersection of the inferred column and marginally economic row, the box is labeled inferred marginal reserves; at the intersection of the inferred column and sub-economic row, the box is labeled inferred subeconomic resources. The boxes are blank under the column labeled undiscovered resources.
Figure 16.8: Immense terraced dirt-lined open pit with snow-covered mountains visible around the back of the mine.
Figure 16.9: A large yellow machine is removing black coal from a terraced slope.
Figure 16.10: A photo in an underground mine with horizontal layering visible in the mine walls; there is also a large yellow truck with a bucket attached to its front containing brown rocky material.
Figure 16.11: A man is operating a large machine that looks like a blast furnace.
Figure 16.12: A power plant with steam coming out, surrounded by rocky hills on either side.
Figure 16.13: Colorful coral reef underwater in light blue, shallow water.
Figure 16.14: World map showing oil reserves by nation in various shades of blue: darker blue nations richest in oil include Canada, Venezuela, and Saudi Arabia. Oil reserves vary geographically.
Figure 16.15: Block diagram showing upward-arching layers with petroleum pooling toward the top of the fold beneath the surface; natural gas forms above the petroleum; there is a well at the surface drilled down into the oil deposit.
Figure 16.16: Two cross sectional diagrams; the top diagram shows onlap with layers of sediments being deposited on top of each other, with each successive upper layer being deposited toward inland; there is an arrow pointing toward the right-hand side labeled transgression; the bottom diagram shows offlap with layers of sediments being deposited on top of each other, with each successive upper layer being deposited toward the ocean; there is an arrow pointing toward the left-hand side labeled regression.
Figure 16.17: Blocky chunk of sandstone that is black in color due to being filled with tar.
Figure 16.18: Graph of global production of oil shale: the horizontal axis is labeled Year and goes from 1880 to 2010; the vertical axis is labeled Mined shale, million tonnes and goes from 0 to 50. Eight countries’ oil production is graphed and stacked to show world production: Estonia, Russia, Brazil, China, Scotland, Germany, Sweden, and United States. Total oil production remains low until around the year 1940, when it increases and peaks at 46 million tonnes around the year 1980; past 1980, the production decreases to 15 million tonnes around the year 2000. From 2000 to 2010, production increases again.
Figure 16.19: Block diagram showing fracking: a vertical well is drilled through numerous sedimentary layers until it reaches a layer labeled Gas-bearing Formation. Then, the well turns horizontal where it extends throughout the gas-bearing formation. Fracking fluid is pumped from the surface into the well and cracks are formed along the horizontal portion of the well, labeled hydraulic fractures; methane flows from the cracks into the horizontal well segment and flows toward the surface. A preexisting fault is seen to the right of the end of the horizontal well, and an earthquake is shown labeled Induced seismicity.
Figure 16.20: Chart showing the coal rankings: the vertical axis is labeled percentage of fixed carbon and goes from 40 to 100; the horizontal axis is labeled gross calorific value (BTU/LB) and goes from 16,000 on the left to 5,000 on the right. Lignite is colored yellow and fills the chart from 40 to 60 percent carbon and 8,3000 to 5,000 calorific value; subbituminous is colored green and fills the chart from 40 to 60 percent carbon and around 12,000 to 8,3000 calorific value; high-volatile bituminous is colored lavender and fills the chart from 40 to 69 percent carbon and 16,000 to around 12,000 calorific value; medium-volatile bituminous is also colored lavender and fills the chart from 69 to 78 percent carbon and 16,000 to around 13,500 calorific value; low-volatile bituminous is colored red and fills the chart from 78 to 86 percent carbon and 16,000 to around 14,000 calorific value; semi-anthracite is colored orange and fills the chart from 86 to 92 percent carbon and 16,000 to around 13,500 calorific value; anthracite is also colored orange and fills the chart from 92 to 98 percent carbon and around 15,800 to around 12,500 calorific value; and meta-anthracite is also colored orange and fills the chart from 98 to 100 percent carbon and around 12,500 to around 12,000 calorific value.
Figure 16.21: A hand holding an elongated chunk of dull black peat, with a dirt-like texture and visible plant bits grown into it.
Figure 16.22: Chunk of black, very shiny rock.
Figure 16.23: Chunk of glassy white mineral with thin gold veins running through the sample.
Figure 16.24: Vertical outcrop of alternating tan and black horizontal layers.
Figure 16.25: Closeup view of rock with elongated glassy green crystals intergrown with light purple glassy grains.
Figure 16.26: Cross section of a kimberlite pipe: at depth of 0 (the surface) is a bowl- shaped crater filled with washed-back ejecta; surrounding the crater is a raised deposit labeled tuff ring. Deeper into the ground is a thin pipe of orange material that contains smaller grains labeled xenoliths; a bracket labels this section diatreme from 0.5 to 1.5 km depth. at the deepest part of the pipe, a horizontal intrusion of magma labeled dike feeds the vertical pipe; a bracket labels this section root from 2.0 to 2.6 km depth.
Figure 16.27: Cross section of a deep-sea vent; a bulbous pool of magma is beneath the vent, heating the crust and seawater entering through cracks on either side of the vent; the seawater entering from the sides becomes heated above the pool of magma and leaves the vent, releasing oxyanions, REE, and trace metals. There are complex chemical reactions occurring beneath and above the vent.
Figure 16.28: A large terraced open pit mine that contains both gray and red rocks; a haul truck is seen driving in the foreground.
Figure 16.29: A closeup photo of a chunk of rock made up of glassy amber-colored grains, olive green glassy grains, and a light blue glassy grains.
Figure 16.30: Chunk of brick red rock with flecks of gold left behind in a void. A 5 cm scale bar spans the width of the rock sample.
Figure 16.31: Dark mining shaft with rusted cart tracks leading into it. The shaft is carved into a cliffside composed of alternating red and whitish green sandstone and mudstone.
Figure 16.32: World map showing location of Mississippi Valley-Type and clastic- dominated sediment-hosted lead-zinc deposits. Mississippi Valley-Type locations are marked by red diamonds and are scattered across western Canada, the United States, eastern and western Greenland, western and eastern South America, Europe, southern and northeastern Africa, southern and eastern Asia, and Australia. Clastic-dominated deposits are marked by green squares and are located in western Canada, the United States, northern Greenland, the Caribbean, eastern South America, southwestern Africa, Europe, southern and eastern Asia, and Australia.
Figure 16.33: Chunk of heavily weathered tan and porous rock that has unweathered elongated gray and black crystals in the center.
Figure 16.34: Side view of a sand deposit that has layers of tan sand interbedded with layers of gray and black sand; a penny is stuck into the sand for scale.
Figure 16.35: Orange-colored small stream flowing from left to right, emerging from a hole in a squared grey rock on the left; with small sticks and vegetation throughout the area.
Figure 16.36: A quarry carved into a hillside with large blocks of gray and white marble removed.
Figure 16.37: Two photos; the left photo shows a flat expanse of jagged rocks with a person standing among them; there is a mountain range in the distant background. The right photo shows a hand holding a chunk of rough jagged whitish tan rock.
Figure 16.38: Cream-colored translucent crystal with 6 sides. A marker sits next to the sample for scale.
Figure 16.39: An elongated prismatic crystal of light green apatite with a glassy luster.
Figure 16.40: Aerial view of a large dam. The water level is much higher behind the dam than in front of it, and a road bridge runs across the canyon in front of the dam.
Figure 16.41: Two photos of photovoltaic cells on a roof. The top photo is an aerial photo of a circular series of photovoltaic cells with a large green area in the center of the circle and neighborhoods outside the circle. The bottom photo is a closer image of multiple photovoltaic cells which are dark blue rectangular panels with a checkered appearance.
Figure 16.42: World map with the average horizontal irradiation color coded on the map: red to pink areas experience the highest irradiation, up to 7.4 kilowatthours per square meter, while light to dark green areas experience the lowest irradiation, down to 2.2 kilowatthours per square meter. The areas experiencing the highest irradiation are southwest North America, western and easter South America, north-central Africa and southern Africa, the Arabian Peninsula, southwestern Asia, and a large portion of Australia. The areas experiencing the lowest irradation are located toward the poles.
Figure 16.43: Two images; the left is a simple diagram showing a side view of a wind turbine with the white rotor blades labeled and attached to a gray rectangle labeled nacelle that contains a green gear box and yellow cylindrical generator. The generator is attached to a red wire labeled power cables that runs down inside the white tower to the ground. The red wire ends at a tan box on the ground labeled transformer, which is connected by yellow wires to a series of three connected black power structures labeled switchyard. The right image is a photo of a white wind turbine with three blades rising from a green hillslope with low dark green vegetation covering its base.
Figure 16.44: A satellite image of a large river running from the top left toward the right of the image. A dam is visible as a tan line that runs across the river near the center of the image. On the left side of the dam is a large reservoir and on the right side of the dam is a thinner river. The river is surrounded by green landscape along with tan scarps, and there is a series of blue and tans buildings on the left of the dam alongside the river.
Figure 16.45: Photograph of a wide, very gently dipping waterway with visible small steps along its length. The waterway has metal fencing along its sides with a small group of people leaning along the fence looking at the waterway. There are a few trees on either side of the waterway and the rest of the ground around the waterway is paved.
Figure 16.46: Cross sectional diagram showing a black and white building that has a red line going into the building on the right and a blue line exiting the building on the left. The blue line goes down into the ground with arrows labeled cold water pumped down. The blue line branches into multiple segments and as those segments go toward the right, turn into red segments. A single red line goes up out of the ground with arrows labeled steam and hot water, where they enter a gray cylinder sitting on the surface. The gray cylinder is attached to a black cylinder labeled generating station which is connected to power lines above the surface.
Figure 16.47: A yellow circle at the center containing the text types of biomass. On the upper left of the circle is a green rectangle labeled Biomass for direct combusion of heating. Beneath that label are the terms firewood, charcoal, and manure, with a bracket connecting them pointing toward the yellow circle. On the right of the circle is a blue rectangle labeled Biomass for electricity (burned at power plants). Beneath that label are the terms corne, bagasse grown (ethanol), soybeans, rapeseed (biodiesel), used cooking oil (biodiesel), algae grown (biofuels), and plant matter treated to produce cellulosic ethanol, with a bracket connecting them pointing toward the yellow circle. On the lower left of the circle is a purple rectangle labeled Biofuels for powering vehicles. Above that label are the terms land fill gas, crop, forestry residues, and processing wastes from mills, with a bracket connecting them pointing toward the yellow circle.
A resource that is not able to be replaced on a human timescale.
Place where material is extracted from the Earth for human use.
Data that is out of the ordinary and does not fit previous trends.
Valuable material in the Earth, typically used for metallic mineral resources.
Material that is potentially (but not proven to be) extractable and valuable.
A proven commodity of profitable material that could be mined.
Mining that occurs near the Earth's surface.
Large surface mine with opening carved into the ground.
A surface mining technique that involves removing large strips of soil and rock to access underlying mineral deposits.
A form of surface mining that involves removing the top of a mountain to expose a desired resource underneath.
Mining that occurs within tunnels and shafts inside the Earth.
Material found around ore that is less valuable and needs to be removed in order to obtain the ore.
A process that chemically separates desired element(s) from ore minerals.
Removing trace elements from desired elements.
A form of potential energy stored in the bonds of chemical compounds and released during a chemical reaction.
A liquid fossil fuel derived from shallow marine rocks; also known as crude oil.
Sands or sandstones that contain high-viscosity petroleum.
Oil found in low-permeability, high-porosity rocks such as shale.
Relating to movement brought about by water.
Metallic mineral deposit consisting of mafic plutonic rocks, typically containing platinum-group elements, chromium, copper and nickel.
An ultramafic rock from deep volcanic vents that can contain diamonds.
Metallic mineral deposit that forms near mid-ocean ridges.
Large metallic mineral deposit that forms near magma bodies like plutons. Commonly contains copper, lead, zinc, molybdenum, and gold.
Oxidation occurring in sulfide deposits that can concentrate valuable elements like copper.
Carbonate rock that reacts with hot magmatic fluids, creating concentrated ore deposits, which can include copper, iron, zinc, and gold.
Broad, low-grade deposits of microscopic gold found in sedimentary rocks with diagenetic alteration.
Reactions that are related to the availability of oxygen. Many minerals or ions change their solubility based on redox conditions.
A half-reaction in which a chemical species decreases its oxidation number, usually by gaining electrons.
A process in which certain metallic elements (like iron) take in oxygen, causing reactions like rust.
Original water trapped inside a forming rock.
Metallic mineral deposit of mainly lead and zinc from groundwater movements within sedimentary rocks.
Diagenetic copper deposit within sedimentary rocks.
Deposit of heavy ores in stream or beach sediments.
Toxic waters rich in heavy metals and often of low pH that come from unregulated mining districts.
A process inside stars in which smaller atoms combine and form larger atoms.
A form of renewable energy that harnesses the power of the wind to generate electricity.
Radiation from the Sun that is capable of producing heat, causing chemical reactions, or generating electricity.
An energy system that uses a building's design, materials, and placement to capture solar energy to heat and cool living spaces without relying on mechanical or electrical devices.
A system using mechanical and electrical equipment to collect, store, or distribute solar energy for various uses.
An electronic device that converts the energy of light directly into electricity by means of the photovoltaic effect.
A rotary mechanical device that converts the kinetic energy of fluids, such as water, steam, or air, into mechanical energy or electricity by rotating a series of blades.
The energy an object possesses due to its motion.
A renewable energy source that uses the kinetic energy of moving water to generate electricity.
A renewable energy source that uses the kinetic energy of moving water to generate electricity.
The energy stored within an object or system that has the potential to do work based on its position, configuration, or state.
A rock that allows petroleum resources to collect or move inside it.
Matter from recently living organisms, which is used for bioenergy production.
Liquid fuels produced from renewable biological sources, including plants and algae.
