12 Earth’s Coastlines and Oceans
Learning Objectives
By the end of this chapter, students should be able to:
- Describe how waves occur, move, and carry energy.
- Describe shoreline features and zones.
- Describe wave refraction and its contribution to longshore currents and longshore drift.
- Distinguish between submergent and emergent coasts, and describe coastal features associated with each.
- Describe the pattern of the main ocean currents, and explain the different factors involved in surface currents and deep ocean currents.
- Explain how ocean tides occur, and distinguish among diurnal, semidiurnal, and mixed tide patterns.
- Summarize ocean water properties and the reasons they may vary.
- Summarize the major ocean floor properties along with the methods scientists use to observe them.
Our planet is dominated by oceans, earning it the nickname “the blue planet.” Approximately 71% of Earth’s surface is covered in oceans, including marginal seas. The remaining 29% is all the land we know: continents and islands. Oceanography is an interdisciplinary study of all aspects of the world ocean. Oceanographers generally recognize five major ocean basins: the Pacific, Atlantic, Indian, Arctic, and Southern Ocean. Coastlines are the interfaces between land and ocean and, as such, are the longest visible boundaries on Earth. To understand the processes that occur at these boundaries, it is important to first understand wave energy.
12.1 Waves and Wave Processes
Wind blowing over the surface of water transfers energy to the water through friction. The energy transferred from wind to water causes waves to form. Waves move as individual oscillating particles of water. As the wave crest passes, the water is moving forward. As the wave trough passes, the water is moving backward. To see wave movement in action, watch a cork or any floating object as a wave passes.
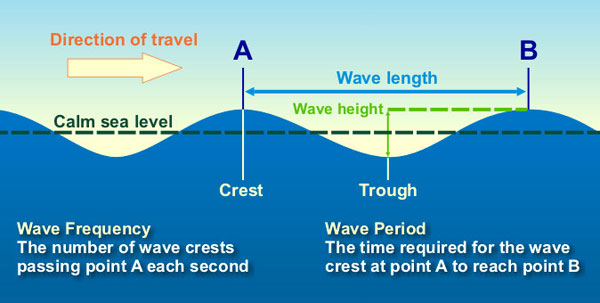
There are several important terms to understand about the operation of waves. The wave crest is the highest point of the wave. The trough is the lowest point of the wave. Wave height is the vertical distance from the trough to the crest and is determined by wave energy. Wave amplitude is half the wave height, or the distance from either the crest or trough to the still water line. Wavelength is the horizontal distance between consecutive wave crests. Wave velocity is the speed at which a wave crest moves forward and is related to the wave’s energy. Wave period is the time interval it takes for adjacent wave crests to pass a given point.
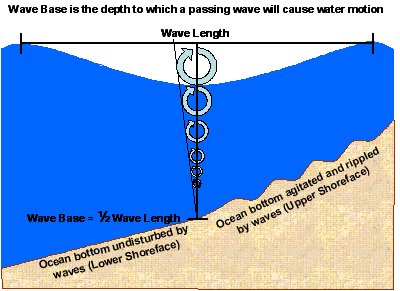
The circular motion of water particles diminishes with depth and is negligible at about one half-wavelength, an important dimension to remember in connection with waves. Wave base is the vertical depth at which water ceases to be disturbed by waves. In water shallower than the wave base, waves will disturb the bottom and ripple shore sand. Wave base is measured at a depth of about one half-wavelength, where the water particles’ circular motion diminishes to zero. If waves approaching a beach have crests with intervals of about 6 m (~20 ft), this wave motion disturbs water to about 3 m (~10 ft) deep. This motion is known as fair-weather wave base. In strong storms such as hurricanes, both wavelength and wave base increase dramatically to a depth known as the storm wave base, which is approximately 91 m (~300 ft).
Waves are generated by wind blowing across the ocean surface. The amount of energy imparted to the water depends on wind velocity and the distance across which the wind is blowing. This distance is called fetch. Waves striking a shore are typically generated by storms hundreds of miles from the coast and have been traveling across the ocean for days.
Winds blowing in a relatively constant direction generate waves moving in that direction. Such a group of approximately parallel waves traveling together is called a wave train. A wave train coming from one fetch can produce various wavelengths. Longer wavelengths travel at a faster velocity than shorter wavelengths, so they arrive first at a distant shore. Thus, there is a wavelength-sorting process that takes place during the wave train’s travel. This sorting process is called wave dispersion.
A rogue wave is an unusual and rarer type of wave that is large, unexpected, and dangerous. Rogue, freak, or killer waves have been part of marine folklore for centuries but have only been accepted as real by scientists over the past few decades.
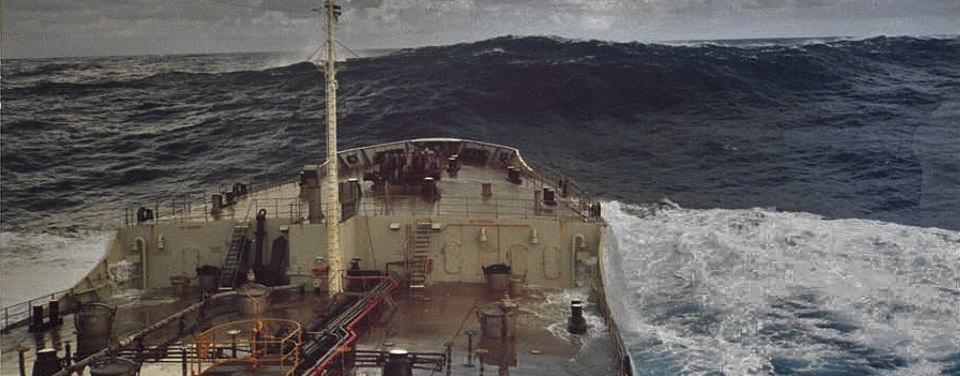
Known as extreme storm waves by scientists, rogues are waves that are more than twice the size of surrounding waves, are very unpredictable, and often come unexpectedly from directions other than prevailing wind and waves. Most reports of extreme storm waves say they look like “walls of water.” They are often steep-sided, with unusually deep troughs. Since these waves are uncommon, measurement and analysis of this phenomenon is extremely rare. Exactly how and when rogue waves form is still under investigation, but there are several known causes, including constructive interference and focusing of wave energy.
Extreme waves often form because swells travel across the ocean at different speeds and directions. As these swells pass through one another, their crests, troughs, and lengths sometimes coincide and reinforce each other. This process can form unusually large, towering waves that quickly disappear, a type of constructive interference. If the swells are travelling in the same direction, these mountainous waves may last for several minutes before subsiding.
When waves formed by a storm develop in a water current against the normal wave direction, an interaction can take place that results in a shortening of the wave frequency, focusing the wave energy. This can cause the waves to dynamically join together, forming very big rogue waves. The currents where these are sometimes seen are the Gulf Stream and the Agulhas current. Extreme waves developed in this fashion tend to be longer lived.
12.1.1 Behavior of Waves Approaching Shore

On the open sea, waves generally appear choppy because wave trains from many directions interact with each other, a process called wave interference. Constructive interference occurs where crests align with other crests. The aligned wave height is the sum of the individual wave heights, a process referred to as wave amplification. Constructive interference also produces hollows where troughs align with other troughs. Destructive interference occurs where crests align with troughs and cancel each other out. As waves approach shore and begin to make frictional contact with the seafloor at a depth of about one half-wavelength or less, they begin to slow down. However, the energy carried by the wave remains the same, so the waves build up higher. Remember that water moves in a circular motion as a wave passes, and each circle is fed from the trough in front of the advancing wave. As the wave encounters shallower water at the shore, there is eventually insufficient water in the trough in front of the wave to supply a complete circle, so the crest pours over, creating a breaker.
A special type of wave is called a tsunami, sometimes incorrectly called a tidal wave. Tsunamis are generated by energetic events affecting the seafloor, such as earthquakes, submarine landslides, and volcanic eruptions (see Chapters 4 and 9). During earthquakes, for example, tsunamis can be produced when the moving crustal rocks below the sea abruptly elevate a portion of the seafloor. Water is suddenly lifted, creating a bulge at the surface and a wave train spreads out in all directions, traveling at tremendous speeds—over 322 kph (200 mph)—and carrying enormous energy. Tsunamis may pass unnoticed in the open ocean because they move so fast, the wavelength is very long, and the wave height is very low. But, as the wave train approaches shore and each wave begins to interact with the shallow seafloor, friction increases and the wave slows down. Still carrying its enormous energy, wave height builds up, and the wave strikes the shore as a wall of water that can be over 30 m (~100 ft) high. The massive wave, called a tsunami runup, may sweep inland well beyond the beach, destroying structures far inland. Tsunamis can deliver a catastrophic blow to people at the beach. As the trough water in front of the tsunami wave is drawn back, the seafloor is exposed. Curious and unsuspecting people on the beach may run out to see exposed offshore sea life only to be overwhelmed when the breaking crest hits.

Take this quiz to check your comprehension of this section.
If you are using an offline version of this text, access the quiz for Section 12.1 via the QR code.
12.2 Shoreline Features
Coastlines are dynamic, high energy, and geologically complicated places where many different erosional and depositional features exist (see Chapter 5). They include all parts of the land-sea boundary directly affected by the sea, including land far above high tide and seafloor well below normal wave base. But the shoreline itself is the direct interface between water and land that shifts with the tides. This shifting interface at the shoreline is called the littoral zone. The combination of waves, currents, climate, coastal morphology, and gravity, acts on this land-sea boundary to create shoreline features.
12.2.1 Shoreline Zones
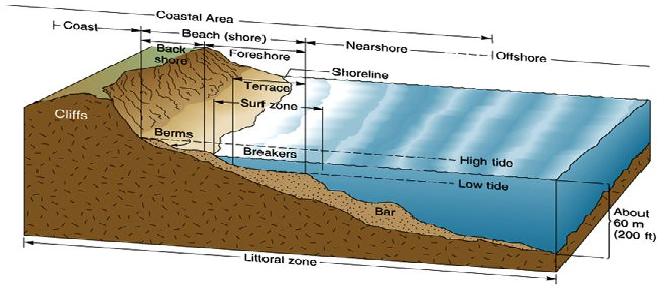
Shorelines are divided into five primary zones—offshore, nearshore, surf, foreshore, and backshore. The offshore zone is below water, but it is still geologically active due to flows of turbidity currents that cascade over the continental slope and accumulate in the continental rise. The nearshore zone is the area of the shore affected by the waves where water depth is one half-wavelength or less. The width of this zone depends on the maximum wavelength of the approaching wave train and the slope of the seafloor. The nearshore zone includes the shoreface, which is where sand is disturbed and deposited. The shoreface is divided into upper and lower shoreface. Upper shoreface is affected by everyday wave action and consists of finely laminated and cross-bedded sand. The lower shoreface is the only area moved by storm waves and consists of hummocky cross-stratified sand. The surf zone is where the waves break.
The foreshore zone overlaps the surf zone and is periodically wet and dry due to waves and tides. The foreshore zone is where planer-laminated, well-sorted sand accumulates. The beach face is the part of the foreshore zone where the breaking waves swash up and the backwash flows back down. Low ridges above the beach face in the foreshore zone are called berms. During the summer in North America, the part of the beach where people spread their towels and umbrellas is the summer berm. Wave energy is typically lower in the summer, which allows sand to pile onto the beach. Behind the summer berm is a low ridge of sand called the winter berm. In winter, higher storm energy moves the summer berm sand off the beach and piles it in the nearshore zone. The next year, that sand is replaced on the beach and moved back onto the summer berm. The backshore zone is the area always above sea level in normal conditions. In the backshore zone, onshore winds may blow sand behind the beach and the berms, creating dunes.
12.2.2 Refraction, Longshore Currents, and Longshore Drift
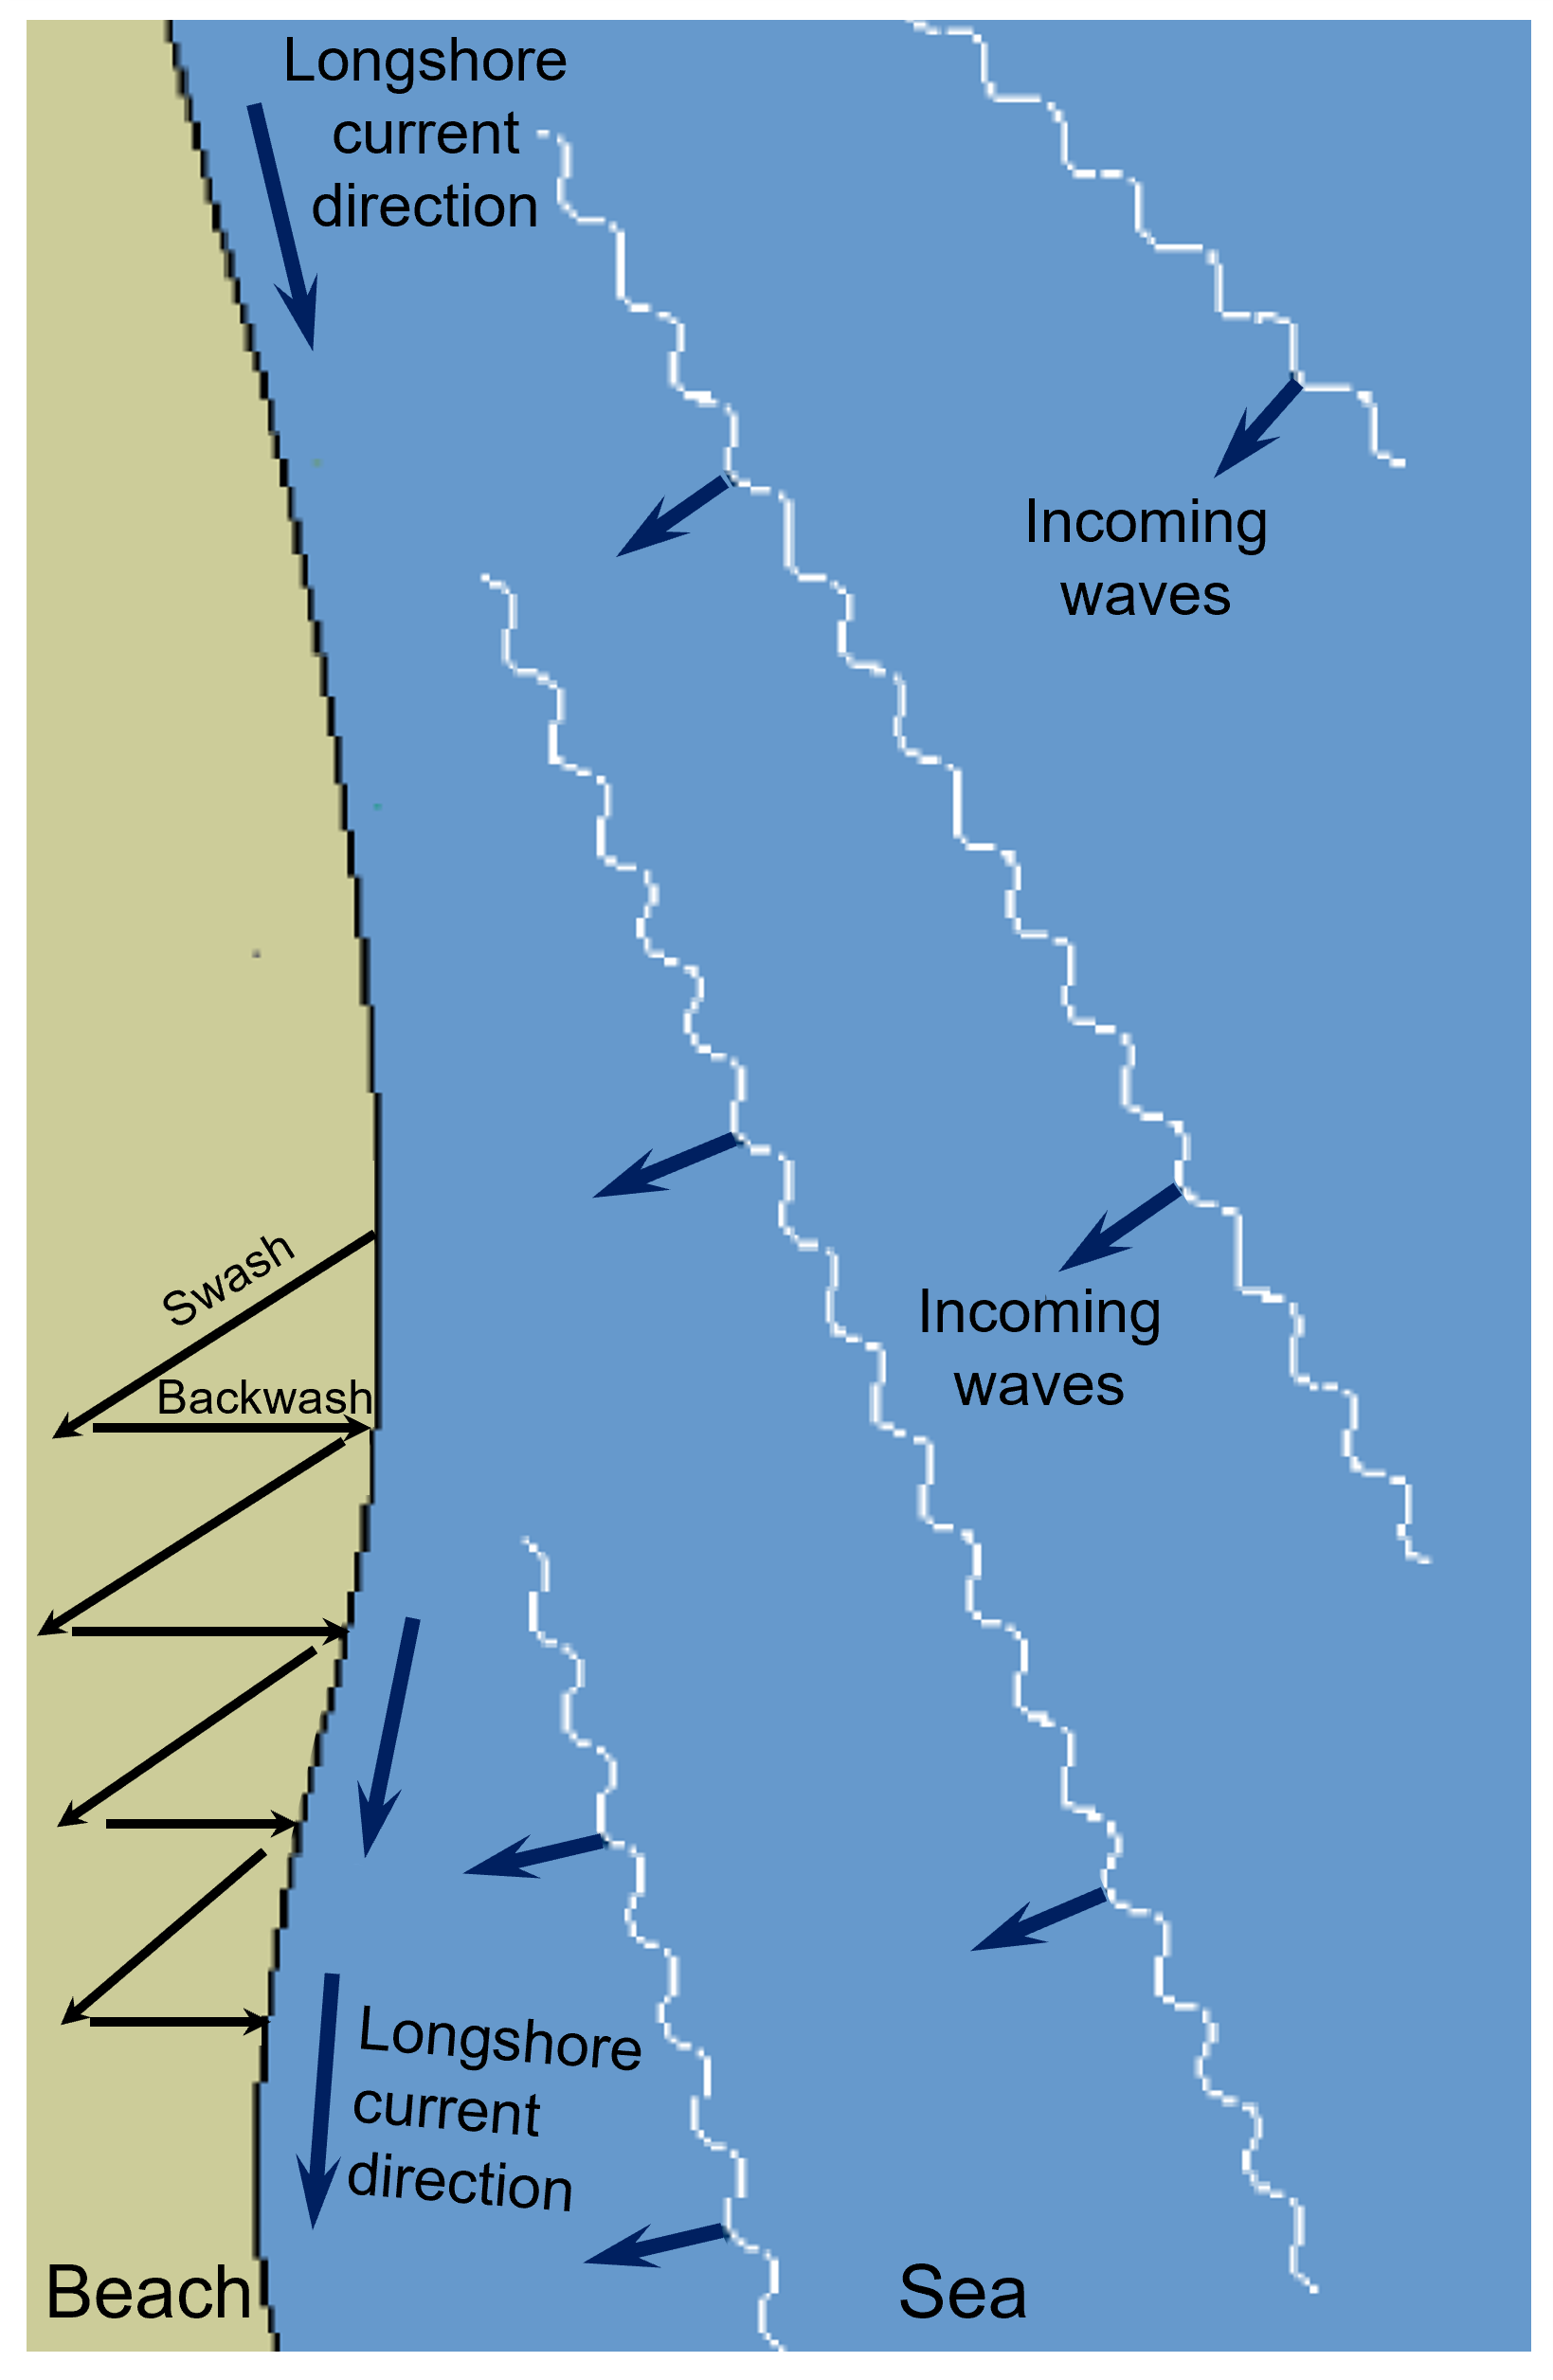
As waves enter shallower water less than one half-wavelength depth, they slow down. Waves usually approach the shoreline at an angle, with the end of the waves nearest the beach slowing down first. This causes the wave crests to bend in a process called wave refraction. From the beach face, it looks like waves are approaching the beach straight on, parallel to the beach. However, as refracted waves actually approach the shoreline at a slight angle, they create a slight difference between the swash as it moves up the beach face at a slight angle and the backwash as it flows straight back down under gravity. This slight angle between swash and backwash along the beach causes beach sand to move down the beach in a sawtooth fashion referred to as beach drift. Parallel to the beach is an ocean current called the longshore current. Waves stir up sand in the surf zone and move it along the shore. Longshore drift along both the west and east coasts of North America moves sand north to south on average.
Longshore currents can carry longshore drift down a coast until it reaches a bay or inlet where it will deposit sand in the quieter water (see Chapter 11). Here, a spit can form. As the spit grows, it may extend across the mouth of the bay, forming a barrier called a baymouth bar. Where bays and inlets serve as boat anchorage, spits and baymouth bars are a severe inconvenience. Often, inconvenienced communities create methods to keep their bays and harbors open.
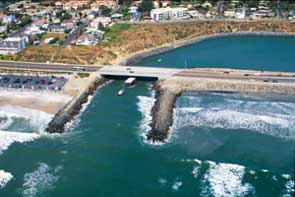
One way to keep a harbor open is to build a jetty, a long concrete or stone barrier constructed to deflect the sand away from a harbor mouth or other ocean waterway. If the jetty does not deflect the sand far enough out, sand may continue to flow along the shore, forming a spit around the end of the jetty. A more expensive but effective method to keep a bay mouth open is to dredge the sand from the growing spit, put it on barges, and deliver it back to the drift downstream of the harbor mouth. An even more expensive but more effective option is to install large pumps and pipes to draw in the sand upstream of the harbor, pump it through pipes, and discharge it back into the drift downstream of the harbor mouth. Because natural processes work continuously, human efforts to mitigate inconvenient spits and baymouth bars require ongoing modifications. For example, the community of Santa Barbara, California, tried several methods to keep their harbor open before settling on pumps and piping.
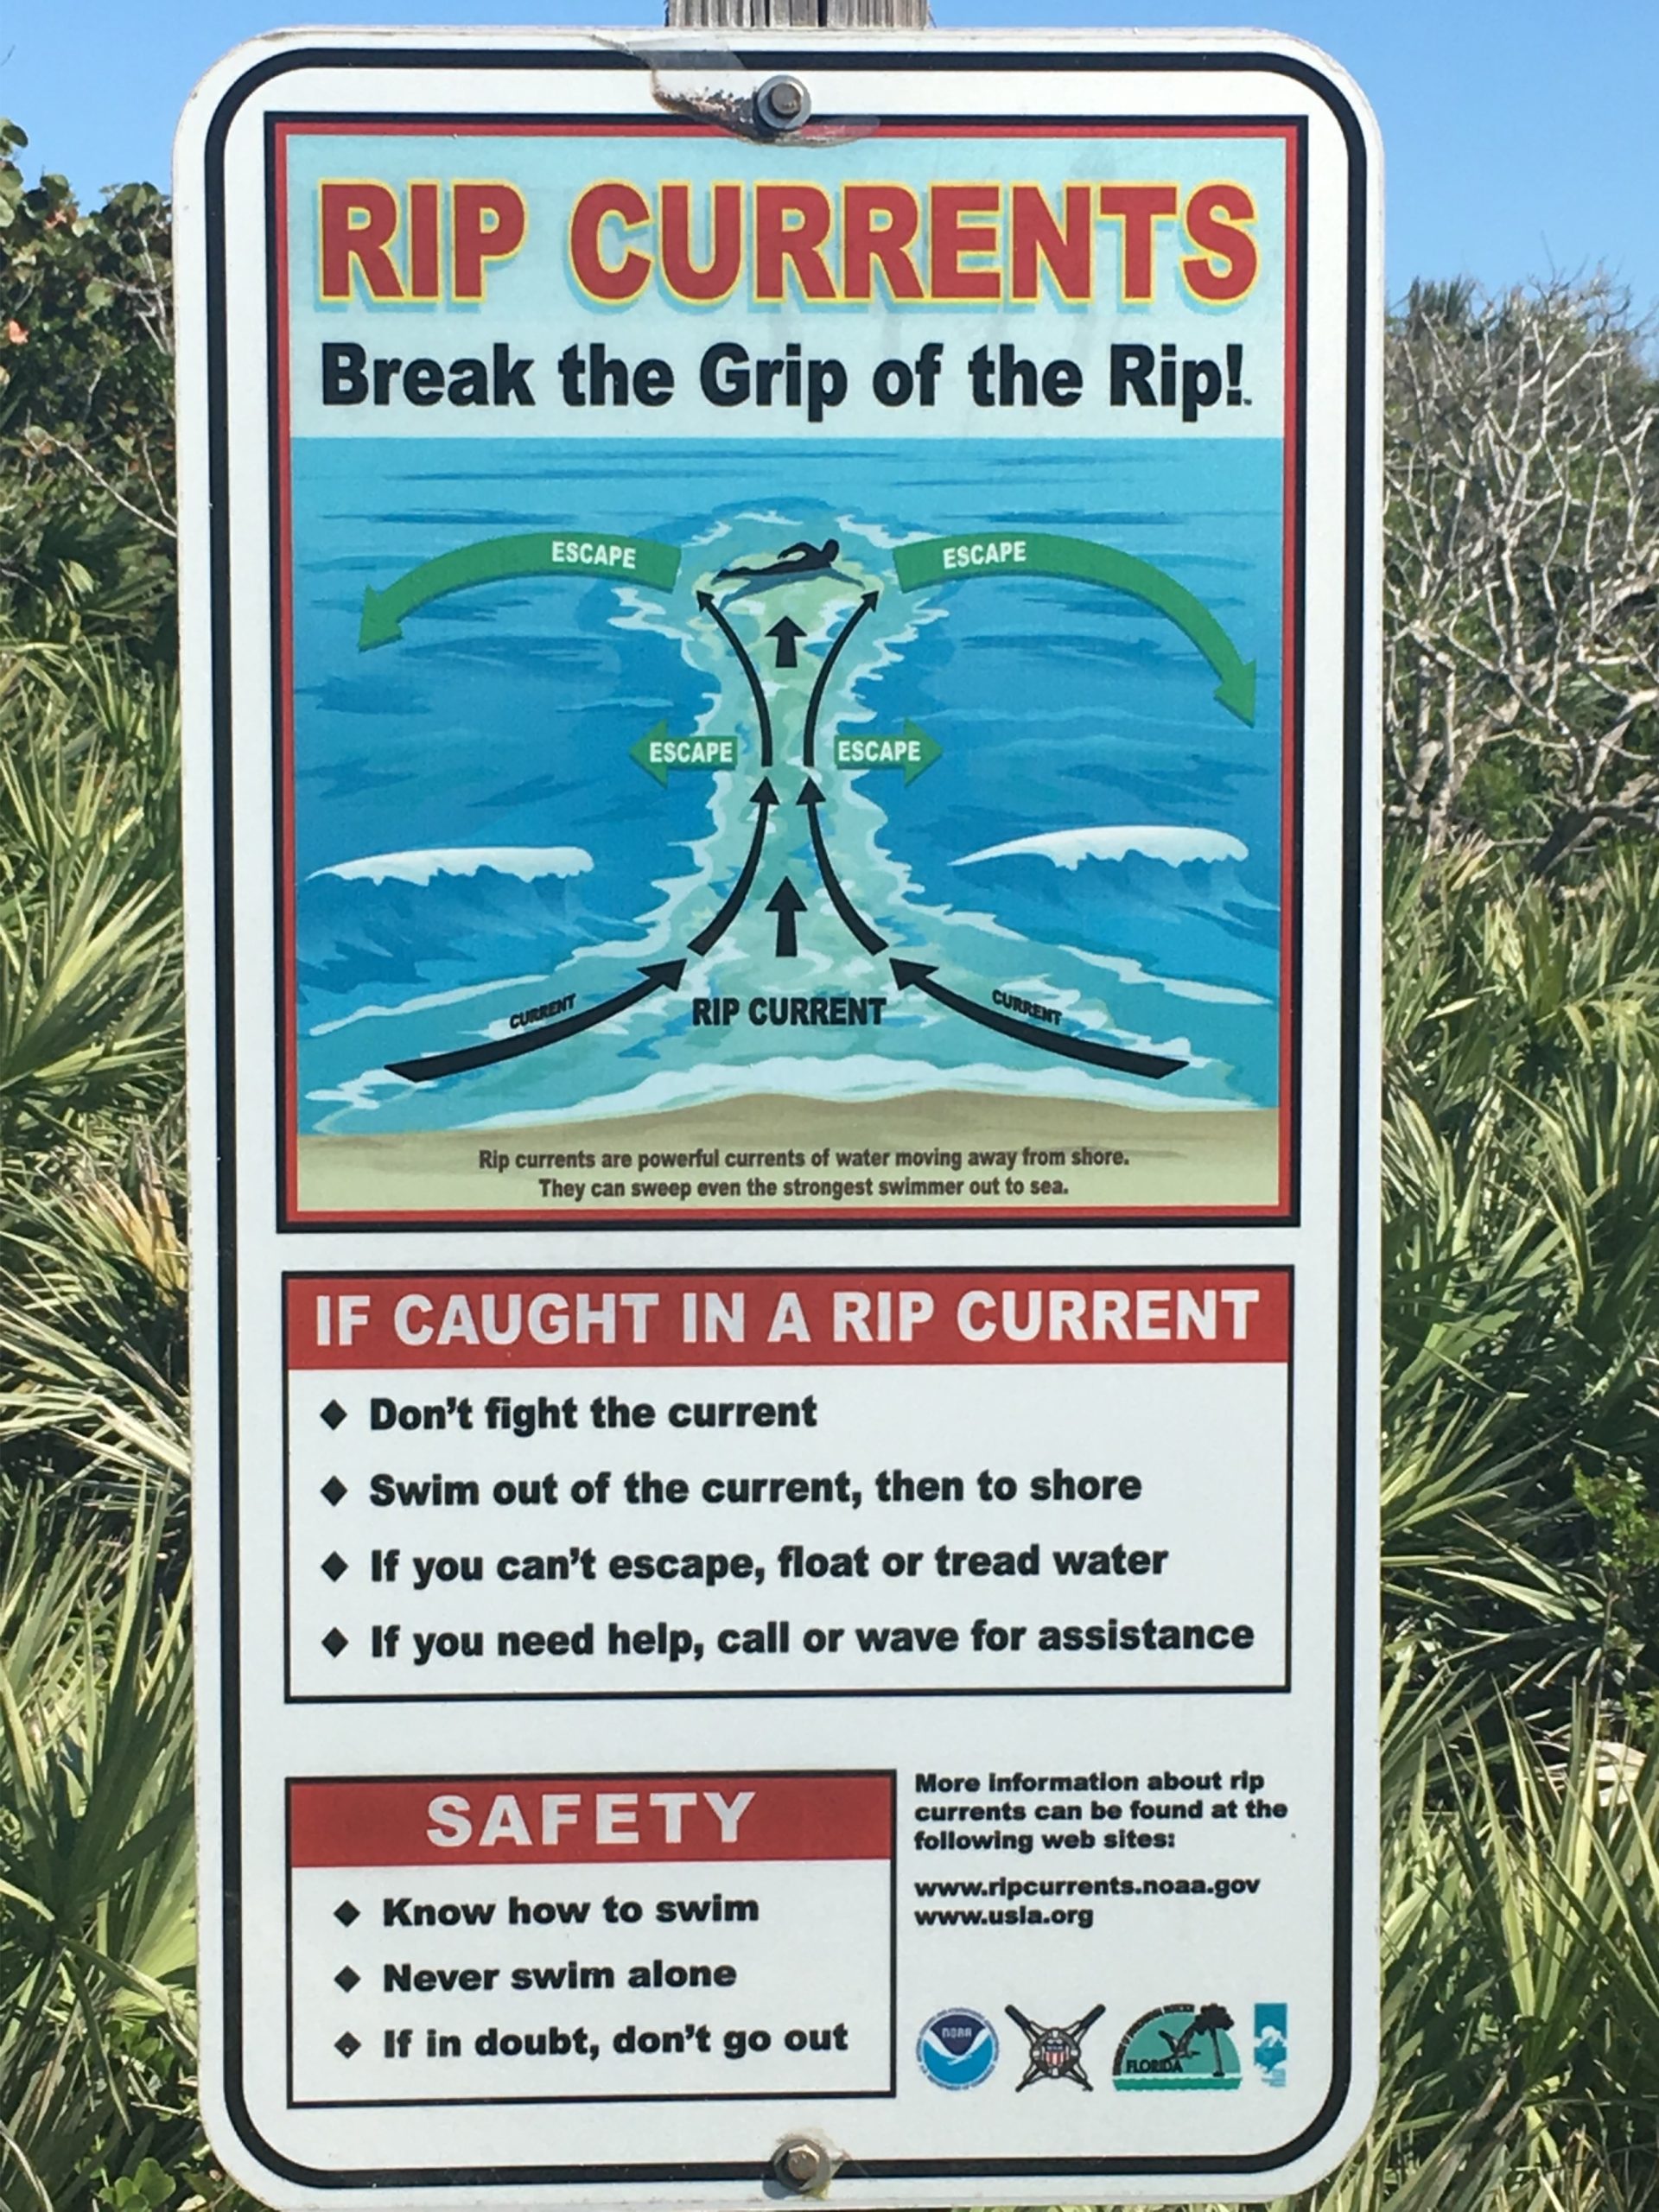
Rip currents are another coastal phenomenon related to longshore currents. Rip currents occur in the nearshore seafloor when wave trains come straight onto the shoreline. In areas where wave trains push water directly toward the beach face or where the shape of the nearshore seafloor refracts waves toward a specific point on the beach, the water piles up on the shore. But this water must find an outlet back to the sea. The outlet is relatively narrow, and rip currents carry the water directly away from the beach. Swimmers caught in rip currents are carried out to sea. Swimming back to shore directly against the strong current is fruitless. A solution for good swimmers is to ride out the current to where it dissipates, swim around it, and return to the beach. Another solution for average swimmers is to swim parallel to the beach until out of the current, then to return to the beach. Where rip currents are known to exist, warning signs are often posted. The best solution is to understand the nature of rip currents, have a plan before entering the water, or watch the signs and avoid them all together.
Like rip currents, undertow is a current that moves away from the shore. However, unlike rip currents, undertow occurs underneath the approaching waves and is strongest in the surf zone, where waves are high and water is shallow. Undertow is another return flow for water transported onshore by waves.
12.2.3 Emergent and Submergent Coasts

Emergent coasts occur where sea levels fall relative to land level. Submergent coasts occur where sea levels rise relative to land level. Tectonic shifts and sea-level changes cause the long-term rise and fall of sea level relative to land. Some features associated with emergent coasts include high cliffs, headlands, exposed bedrock, steep slopes, rocky shores, arches, stacks, tombolos, wave-cut platforms, and wave notches.
In emergent coasts, wave energy, wind, and gravity erode the coastline. The erosional features are elevated relative to the wave zone. Sea cliffs are persistent features formed by waves cutting away at their base and higher rocks calving off by mass wasting. Refracted waves that attack bedrock at the base of headlands may erode or carve out a sea arch, which can extend below sea level in a sea cave. When a sea arch collapses, it leaves one or more rock columns called stacks.
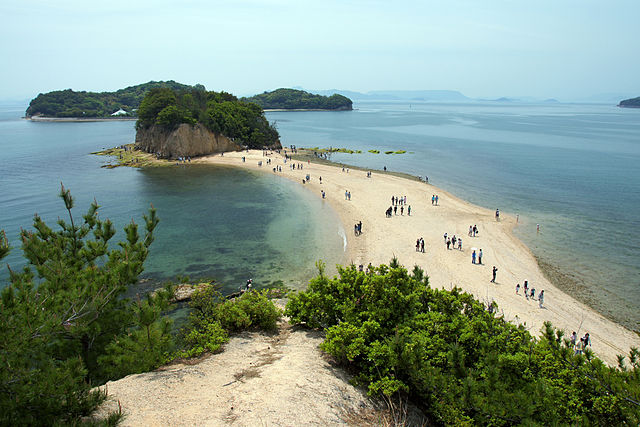
A stack or nearshore island creates a quiet water zone behind it. Sand moving in the longshore drift accumulates in this quiet zone, forming a tombolo: a sand strip that connects the island or stack to the shoreline. Where sand supply is low, wave energy may erode a wave-cut platform across the surf zone, exposed as bare rock with tidal pools at low tide. This benchlike terrace extends to the cliff’s base. When wave energy cuts into the base of a sea cliff, it creates a wave notch.
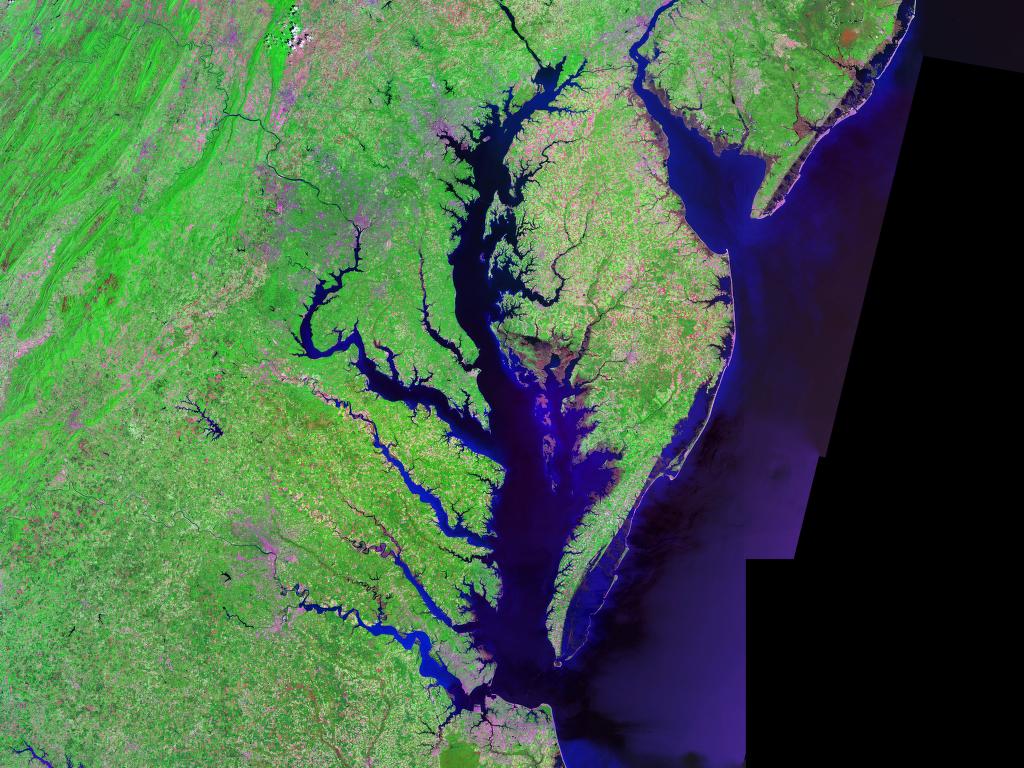
Submergent coasts occur where sea levels rise relative to land. This may be due to tectonic subsidence—when the Earth’s crust sinks—or when sea levels rise due to glacier melt. Features associated with submergent coasts include flooded river mouths, fjords, barrier islands, lagoons, estuaries, bays, tidal flats, and tidal currents. In submergent coastlines, river mouths are flooded by the rising water, as is the case with the Chesapeake Bay. Fjords are glacial valleys flooded by post-ice age sea-level rise (see Chapter 14). Barrier islands are elongated bodies of sand that formed from old beach sands that used to parallel the shoreline. Often, lagoons lie behind barrier islands. Barrier island formation is controversial; some scientists believe that they formed when ice sheets melted after the last ice age, raising sea levels. Another hypothesis is that barrier islands formed from spits and bars accumulating far offshore.
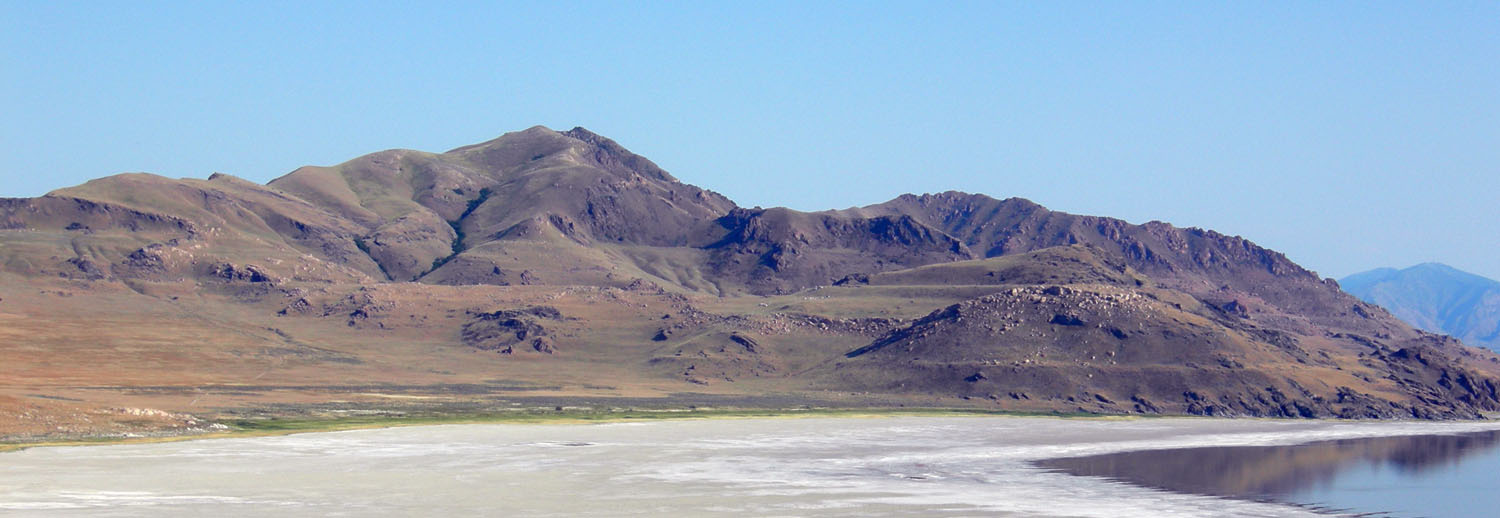
Tidal flats, or mudflats, form where tides alternately flood and expose low areas along the coast. Tidal currents create combinations of symmetrical and asymmetrical ripple marks on mudflats, and drying mud creates mud cracks. In the central Wasatch Mountains of Utah, ancient tidal flat deposits are exposed in the Precambrian strata of the Big Cottonwood Formation. These ancient deposits provide an example of applying Hutton’s principle of uniformitarianism (see Chapter 1). Sedimentary structures common on modern tidal flats indicate that these ancient deposits were formed in a similar environment; there were shorelines, tides, and shoreline processes acting at that time, yet the ancient age indicates that there were no land plants to hold products of mechanical weathering in place (see Chapter 5), so erosion rates would have been different.
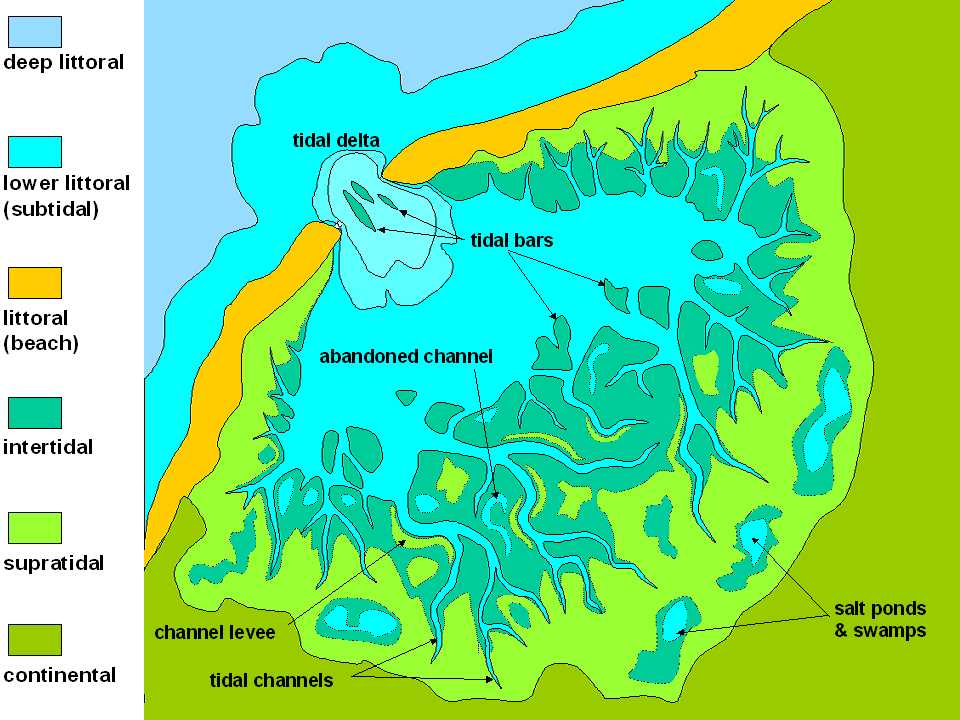
Geologically, tidal flats are broken into three different sections: barren zones, marshes, and salt pans. These zones may be present or absent in each individual tidal flat. Barren zones are areas with strong flowing water and coarser sediment, with ripple marks and cross-bedding common. Marshes are vegetated with sand and mud. Salt pans or flats, less often submerged than the other zones, are the finest-grained parts of tidal flats, with silty sediment and mud cracks (see Chapter 5).
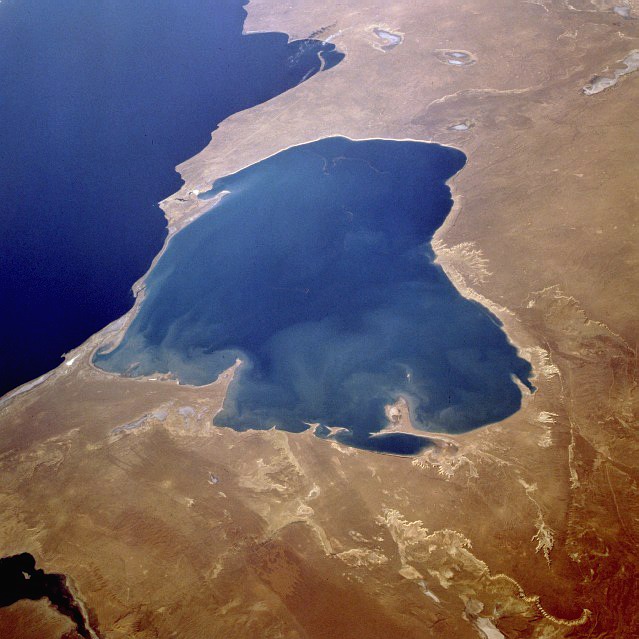
Lagoons are locations where spits, barrier islands, or other features partially cut off a body of water from the ocean. Estuaries are a vegetated type of lagoon where fresh water flows into the area, making the water brackish—a salinity between salt and fresh water. However, terms like lagoon, estuary, and even bay are often loosely used in place of one another. Lagoons and estuaries are certainly transitional between land and water environments where littoral (shallow shorelines), lacustrine (lakes or lagoons), and fluvial rivers or currents can overlap. For more information on lagoons and estuaries, see Chapter 5.
12.2.4 Human Impact on Coastal Beaches
Humans impact coastal beaches when they build homes, condominiums, hotels, businesses, and harbors—and then again when they try to manage the natural processes of erosion. Waves, currents, longshore drift, and dams at river mouths deplete sand from expensive beachfront property and expose once calm harbors to high-wave energy. To protect their investment, keep sand on their beach, and maintain calm harbors, cities and landowners find ways to mitigate the damage by building jetties, groins, dams, and breakwaters.

Jetties are large manmade piles of boulders or concrete barriers built at river mouths and harbors. A jetty is designed to divert the current or tide, to keep a channel to the ocean open, and to protect a harbor or beach from wave action. Groins are similar but smaller than jetties. Groins are fences of wire, wood, or concrete built across the beach perpendicular to the shoreline and downstream of a property. Unlike jetties, groins are used to preserve sand on a beach rather than to divert it. Sand erodes on the downstream side of the groin and collects against the upstream side. Every groin on one property thus creates a need for another one on the property downstream. A series of groins along a beach develops a scalloped appearance along the shoreline.
Inland streams and rivers flow to the ocean, carrying sand to the longshore current, which distributes it to beaches. When dams are built, they trap sand and keep sediment from reaching beaches. To replenish beaches, sand may be hauled in from other areas by trucks or barges and then dumped on the depleted beach. Unfortunately, this can disrupt the ecosystem that exists along the shoreline by exposing native creatures to foreign ecosystems and microorganisms and by introducing foreign objects to humans. For example, visitors to one replenished East Coast beach found munitions and metal shards in the sand, which had been dredged from abandoned military test ranges.

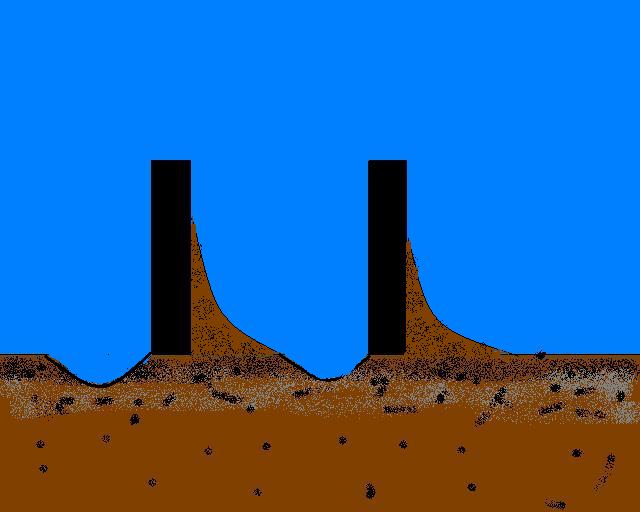
An approach to protect harbors and moorings from high-energy wave action is to build a breakwater—an offshore structure against which the waves break, leaving calmer waters behind it. Unfortunately, breakwaters keep waves from reaching the beach and stop sand moving with longshore drift. When longshore drift is interrupted, sand is deposited in quieter water, and the shoreline builds out, forming a tombolo behind the breakwater. The tombolo eventually fills in the area behind the breakwater with sand. When the city of Venice, California, built a breakwater to create a quiet water harbor, longshore drift created a tombolo behind the breakwater, as seen in the image. The tombolo now acts as a large groin in the beach drift.
12.2.5 Submarine Canyons
Submarine canyons are narrow, deep underwater canyons located on continental shelves. Submarine canyons typically form at the mouths of large landward river systems. They form when rivers cut down into the continental shelf during periods of low sea level and when material continually slumps or flows down from the mouth of a river or a delta. Underwater currents rich in sediment and more dense than seawater can flow down the canyons, even eroding and deepening them, then drain onto the ocean floor. Underwater landslides, called turbidity flows, occur when steep delta faces and underwater sediment flows are released down the continental slope. Turbidity flows in submarine canyons can continue to erode the canyon, and eventually, fan-shaped deposits develop at the mouth of the canyon on the continental rise. See Chapter 5 for more information on turbidity flows.

Take this quiz to check your comprehension of this section.
If you are using an offline version of this text, access the quiz for Section 12.2 via the QR code.
12.3 Currents and Tides
Ocean water moves as waves, currents, and tides. Ocean currents are driven by persistent global winds blowing over the water’s surface and by water density. Ocean currents are part of Earth’s heat engine, in which solar energy is absorbed by ocean water and distributed by ocean currents. Water has another unique property, high specific heat, that relates to ocean currents. Specific heat is the amount of heat necessary to raise a unit volume of a substance one degree. For water, it takes one calorie per cubic centimeter to raise its temperature one degree Celsius. This means the oceans, covering 71% of the Earth’s surface, soak up solar heat with little temperature change and distribute that heat around the Earth by ocean currents.
12.3.1 Surface Currents
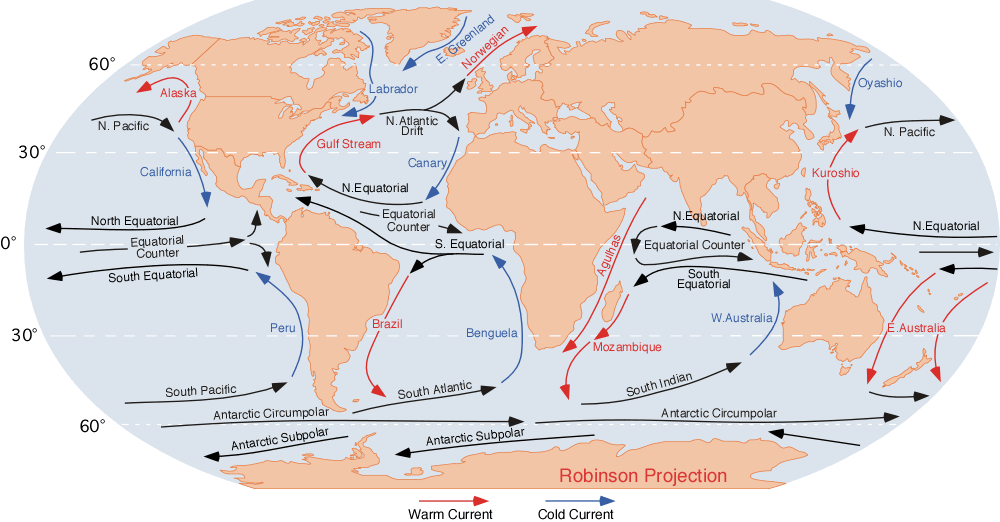
The Earth’s rotation and the Coriolis effect exert significant influence on ocean currents (see Chapter 13). In the figure, the black arrows show global surface currents. Notice the large circular currents in the Northern and Southern Hemispheres in the Atlantic, Pacific, and Indian Oceans. These currents are called gyres and are driven by atmospheric circulation—air movement. Gyres rotate clockwise in the Northern Hemisphere and counterclockwise in the Southern Hemisphere because of the Coriolis effect. Western boundary currents flow from the equator toward the poles, carrying warm water. They are key contributors to local climate. Western boundary currents are narrow and move poleward along the east coasts of adjacent continents. The Gulf Stream and the Kuroshio Currents in the Northern Hemisphere and the Brazil, Mozambique, and Australian Currents in the Southern Hemisphere are western boundary currents. Currents returning cold water toward the equator are broad and diffuse along the western coasts of adjacent land masses. These warm western boundary and cold eastern boundary currents affect climate of nearby lands, making them warmer or colder than other areas at equivalent latitudes. For example, the warm Gulf Stream makes Northern Europe much milder than similar latitudes in northeastern Canada and Greenland. Another example is the cool Humboldt Current, also called the Peru Current, flowing north along the west coast of South America. Cold currents limit evaporation in the ocean, which is one reason the Atacama Desert in Chile is cool and arid.
12.3.2 Deep Currents
Whether an ocean current moves horizontally or vertically depends on its density. The density of seawater is determined by temperature and salinity.
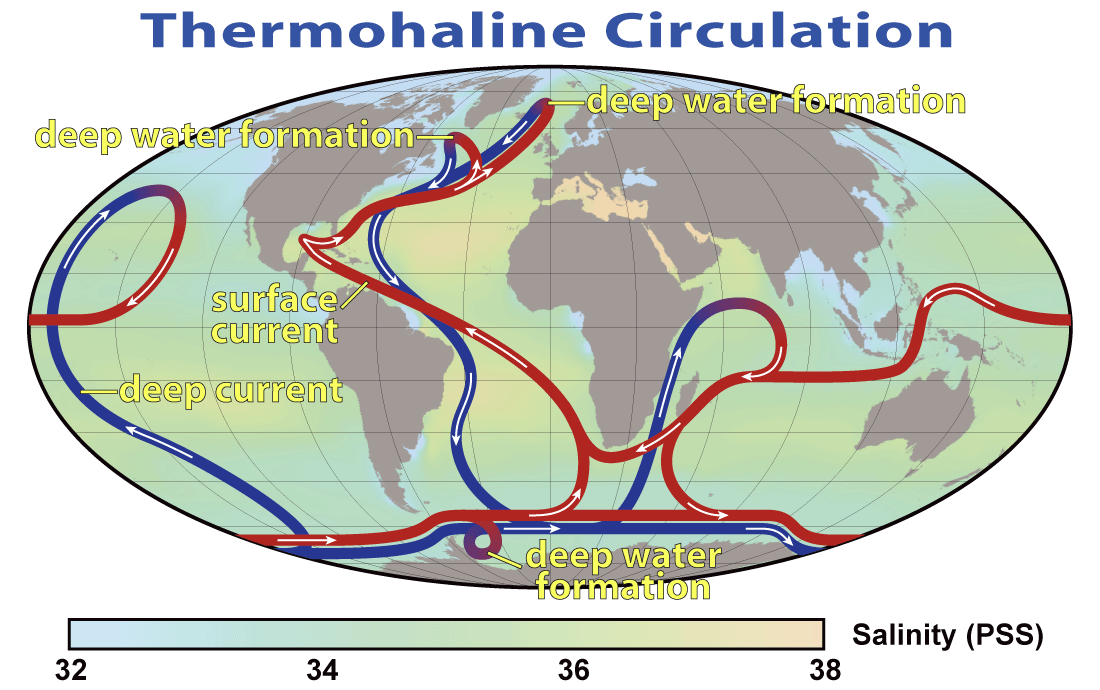
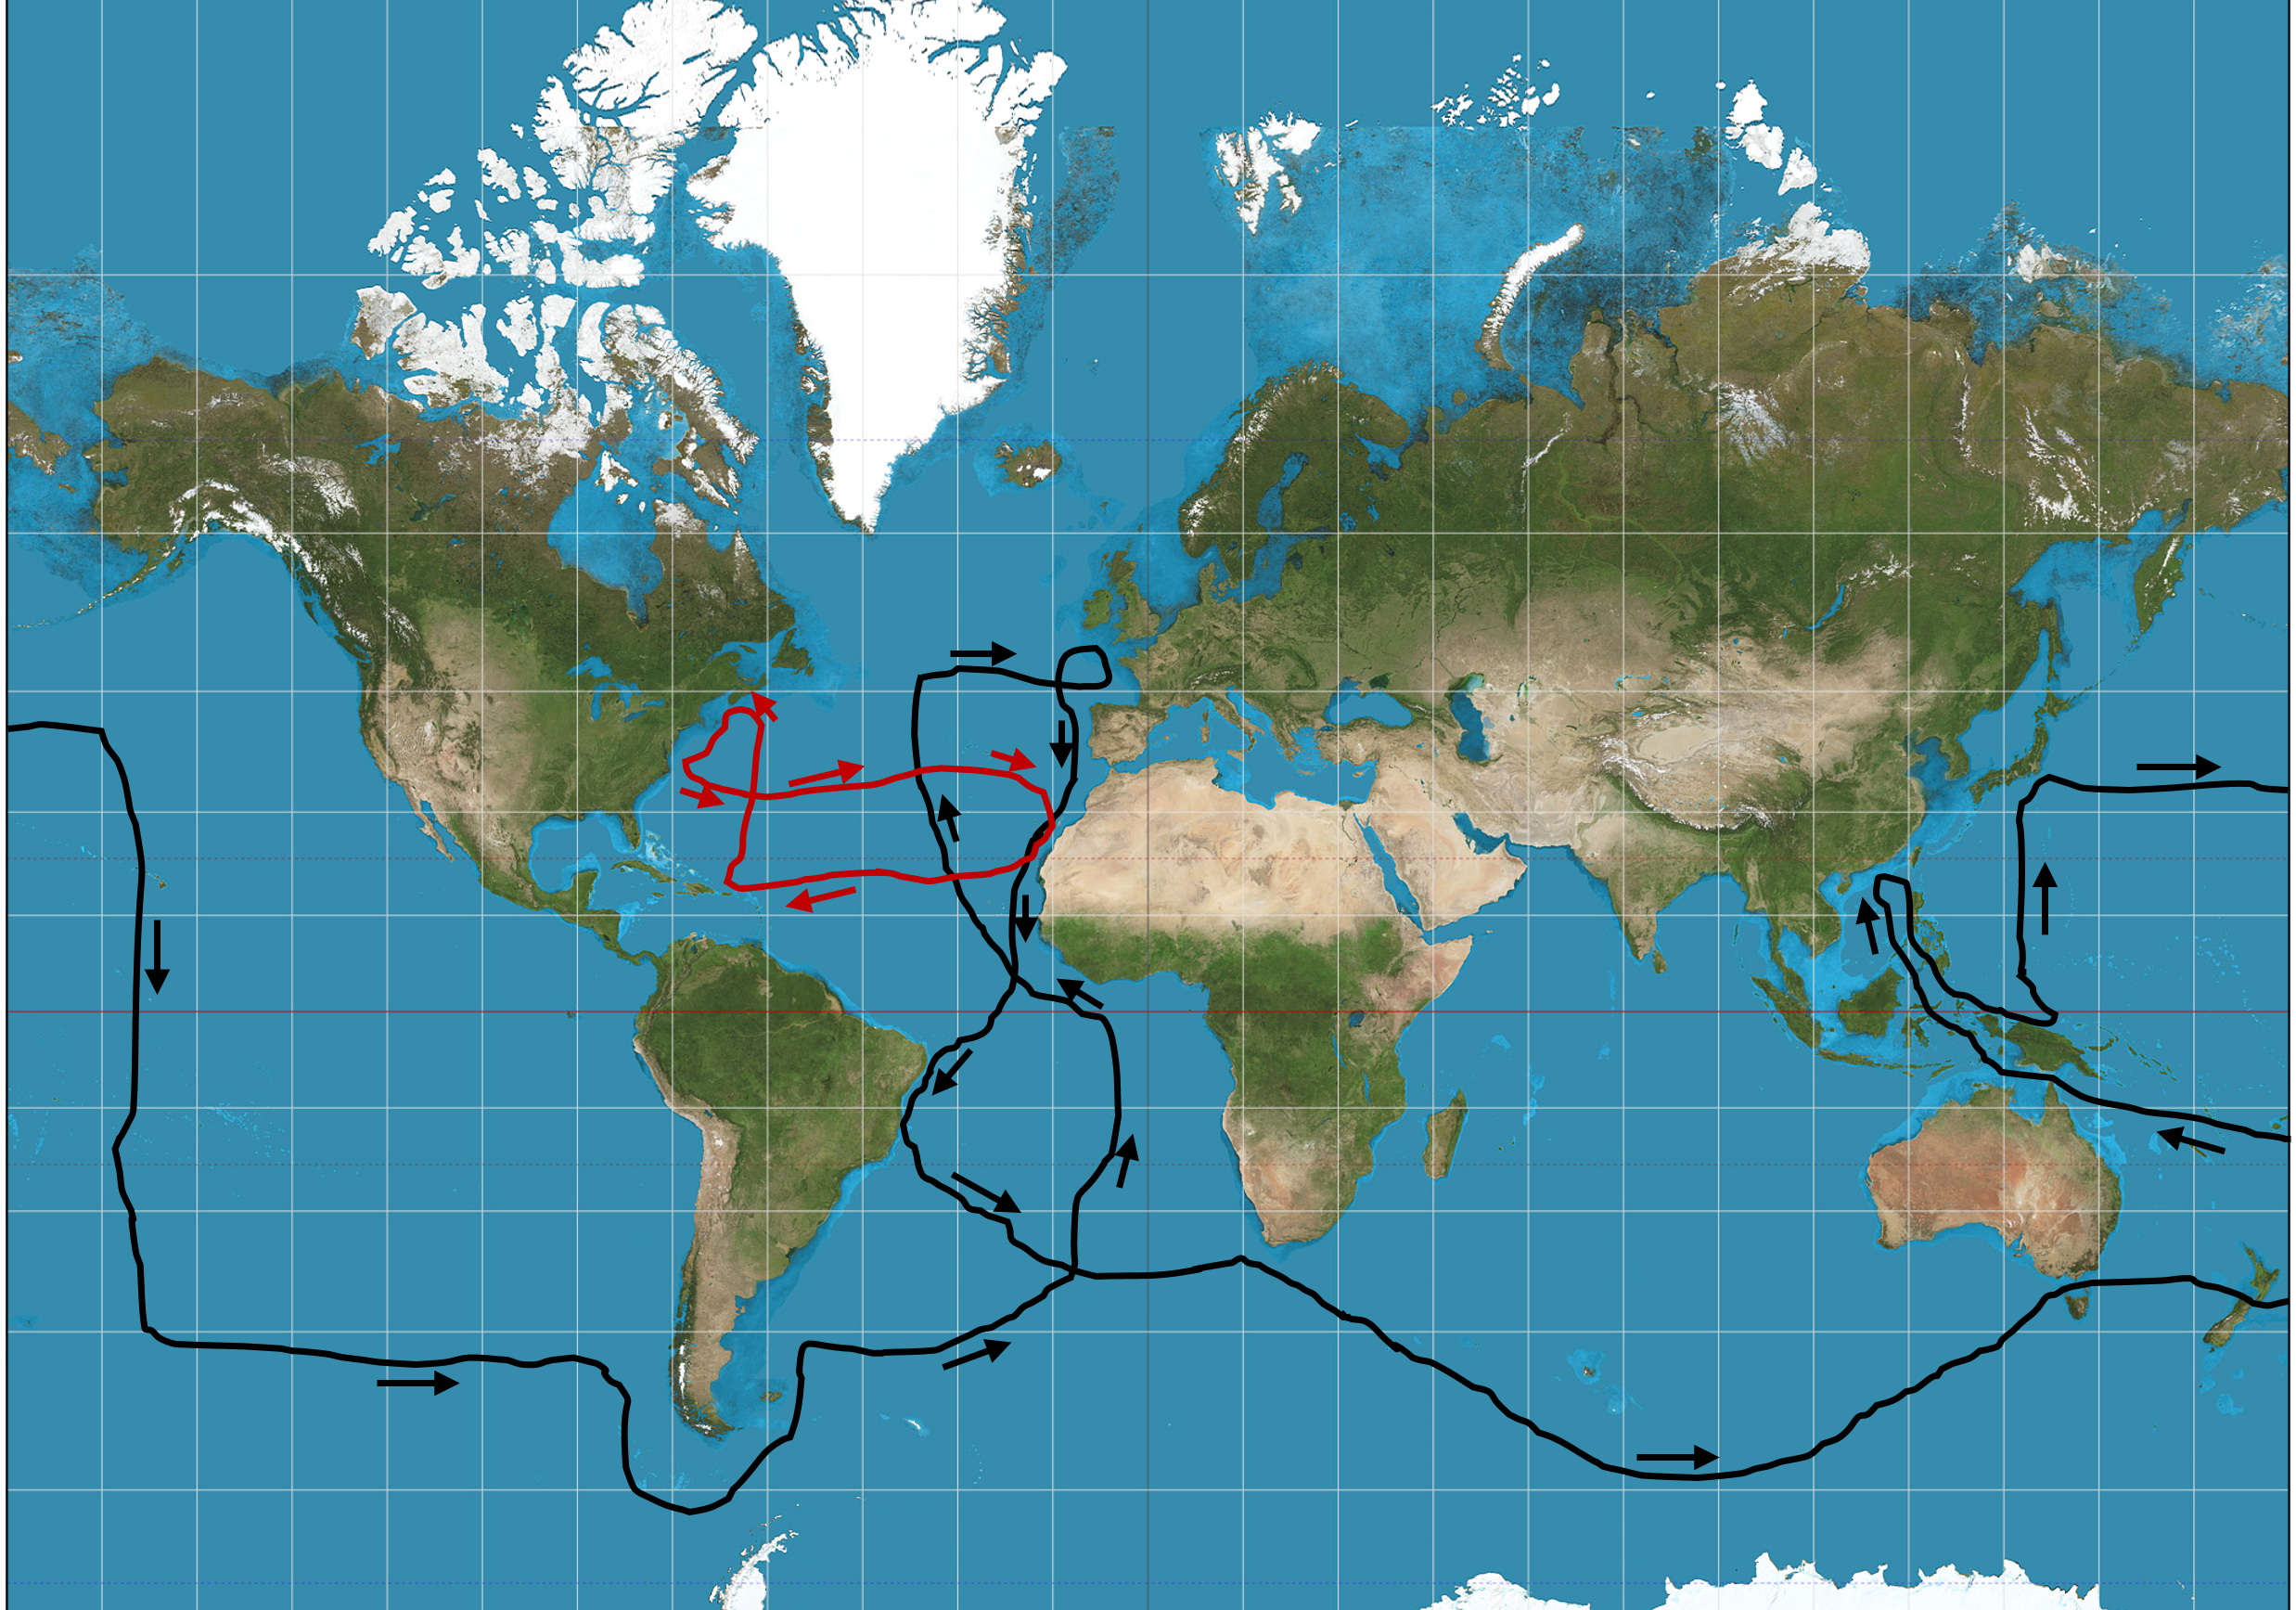
Evaporation and freshwater influx from rivers affect salinity and, therefore, the density of seawater. As the western boundary currents cool at high latitudes, salinity increases due to evaporation and ice formation (recall that ice floats; water is densest just above its freezing point). So the cold, denser water sinks to become the ocean’s deep waters. Deep-water movement is called thermohaline circulation (thermo- referring to temperature and -haline referring to salinity). This circulation connects the world’s deep ocean waters. Movement of the Gulf Stream illustrates the beginning of thermohaline circulation. Heat in the warm poleward-moving Gulf Stream promotes evaporation, which takes heat from the water, and as heat thus dissipates, the water cools. The resulting water is much colder, saltier, and denser. As the denser water reaches the North Atlantic and Greenland, it begins to sink and becomes a deep-water current. As shown in the illustration above, this worldwide connection between shallow and deep-ocean circulation overturns and mixes the entire world ocean, bringing nutrients to marine life with what is sometimes referred to as the global conveyor belt.
12.3.3 Tides
Tides are the rising and lowering of sea level during the day and are caused by the gravitational effects of the Sun and Moon on the oceans. The Earth rotates daily within the Moon and Sun’s gravity fields. Although the Sun is much larger and its gravitational pull is more powerful, the Moon is closer to Earth; hence, the Moon’s gravitational influence on tides is dominant. The magnitude of the tide at a given location and the difference between high and low tide—the tidal range—depends primarily on the configuration of the Moon and Sun with respect to the Earth orbit and rotation.
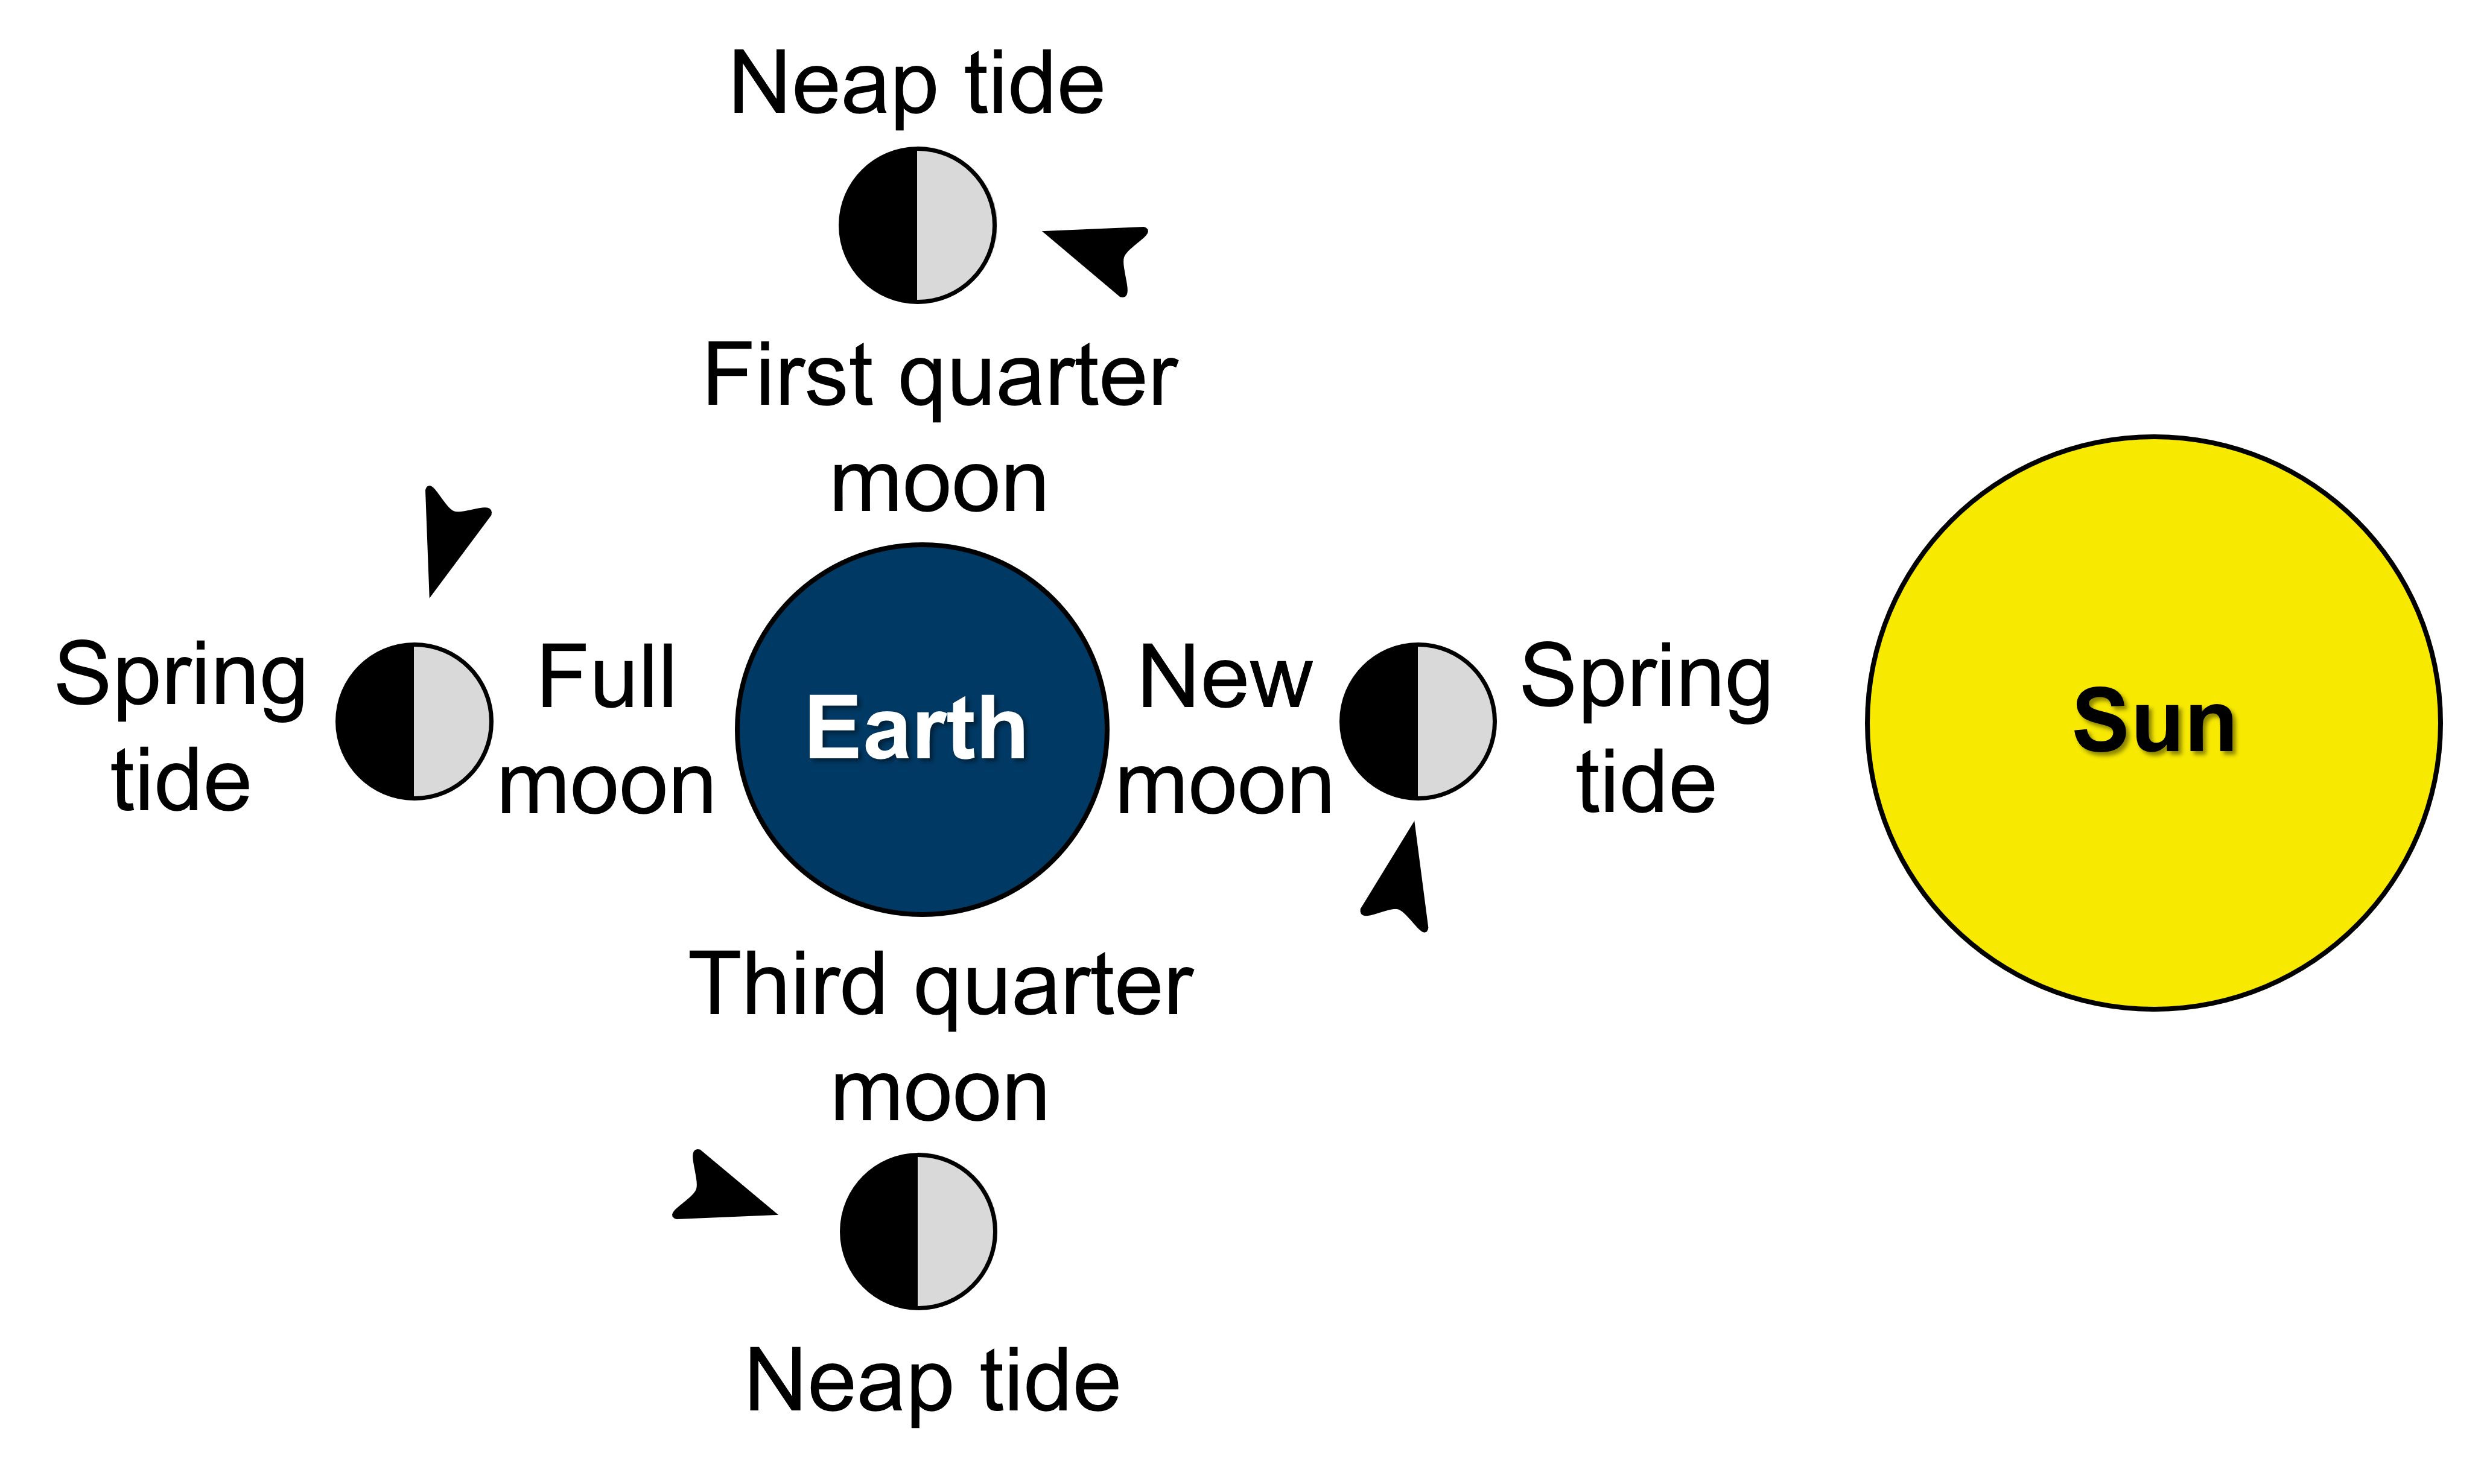
Spring tide occurs when the Sun, Moon, and Earth line up with each other at the full or new Moon; this is when the tidal range is at a maximum. Neap tide occurs approximately two weeks later, when the Moon and Sun are at right angles with the Earth, and the tidal range is at this point.
The Earth rotates within a tidal envelope, so tides rise and ebb daily. Tides are measured at coastal locations. These measurements and the tidal predictions based on them are published on the NOAA website. Tides rising and falling create tidal patterns at any given shore location. The three types of tidal patterns are diurnal, semidiurnal, and mixed.

Diurnal tides go through one complete cycle each tidal day. A tidal day is the amount of time it takes for the Moon to align with a point on the Earth as the Earth rotates, which is slightly longer than 24 hours. Semidiurnal tides go through two complete cycles in each tidal day—occurring approximately every 12 hours and 50 minutes, with the tidal range typically varying in each cycle. Mixed tides are a combination of diurnal and semidiurnal patterns and show two tidal cycles per tidal day, but the relative amplitudes of each cycle and their highs and lows vary during the tidal month. For example, there is a high-high tide and a high-low tide. The next day, there is a low-high tide and a low-low tide.
It is complicated to forecast the tidal pattern and the times tidal phases arrive at a given shore location and can be done for only a few days at a time.

Tidal phases are determined by bathymetry—the depth of ocean basins and the continental obstacles that are in the way of the tidal envelope within which the Earth rotates. Local tidal experts make 48-hour tidal forecasts using tidal charts based on daily observations, as can be seen in the chart of different tide types. A typical tidal range is approximately 1 m (3 ft). Extreme tidal ranges occur where the tidal wave enters a narrow restrictive zone that funnels the tidal energy. An example is the English Channel between Great Britain and the European continent where the tidal range is 7 to 9.75 m (23 to 32 ft). The Earth’s highest tidal ranges occur at the Bay of Fundy, the funnel-like bay between Nova Scotia and New Brunswick, Canada, where the average range is nearly 12 m (40 ft) and the extreme range is around 18 m (60 ft). At extreme tidal range locations, a person who ventures out onto the seafloor exposed during ebb tide may not be able to outrun the advancing water during flood tide. NOAA has additional information on tides.
Tidal forces push seawater into two tidal bulges on opposite sides of the Earth. These tidal bulges lag behind as Earth rotates, which causes friction between Earth’s crust (the ocean floor) and the ocean itself, and that friction acts to slow down Earth’s rotation. This process, known as tidal braking, occurs because the gravitational pull between the Earth and Moon creates resistance, gradually reducing Earth’s rotational speed. This friction is slowing the Earth’s rotation down by some 1.7 milliseconds every century, and in geologic time, this adds up; in fact, it’s estimated that Earth began with a day lasting only four modern hours. Another consequence of this is that the Moon’s distance from Earth is gradually increasing. As it moves farther away, it will orbit less quickly (just as planets farther from the Sun move more slowly in their orbits). Both the day and the month on Earth will continue to get longer, although bear in mind that the effects are very gradual. This has been confirmed by mirrors placed on the Moon by Apollo 11 astronauts, which show that the Moon is moving away by 3.8 centimeters per year. Ultimately, billions of years in the future, the day and the month will be the same length (about 47 of our present days).

Take this quiz to check your comprehension of this section.
If you are using an offline version of this text, access the quiz for Section 12.3 via the QR code.
12.4 Ocean Water Properties
Ocean water has several unique properties: it freezes at a slightly lower temperature than fresh water, has a slightly higher density than fresh water, conducts electricity significantly better than fresh water, and is mildly basic on the pH scale. Ocean water is also, of course, salty. By weight, it consists of about 3.5% dissolved mineral substances that are collectively termed salts. Salinity is the total amount of solid material dissolved in water. Temperature and density are basic ocean water properties that influence such things as deep-ocean circulation and the distribution and types of life forms.
12.4.1 Ocean Water Salinity
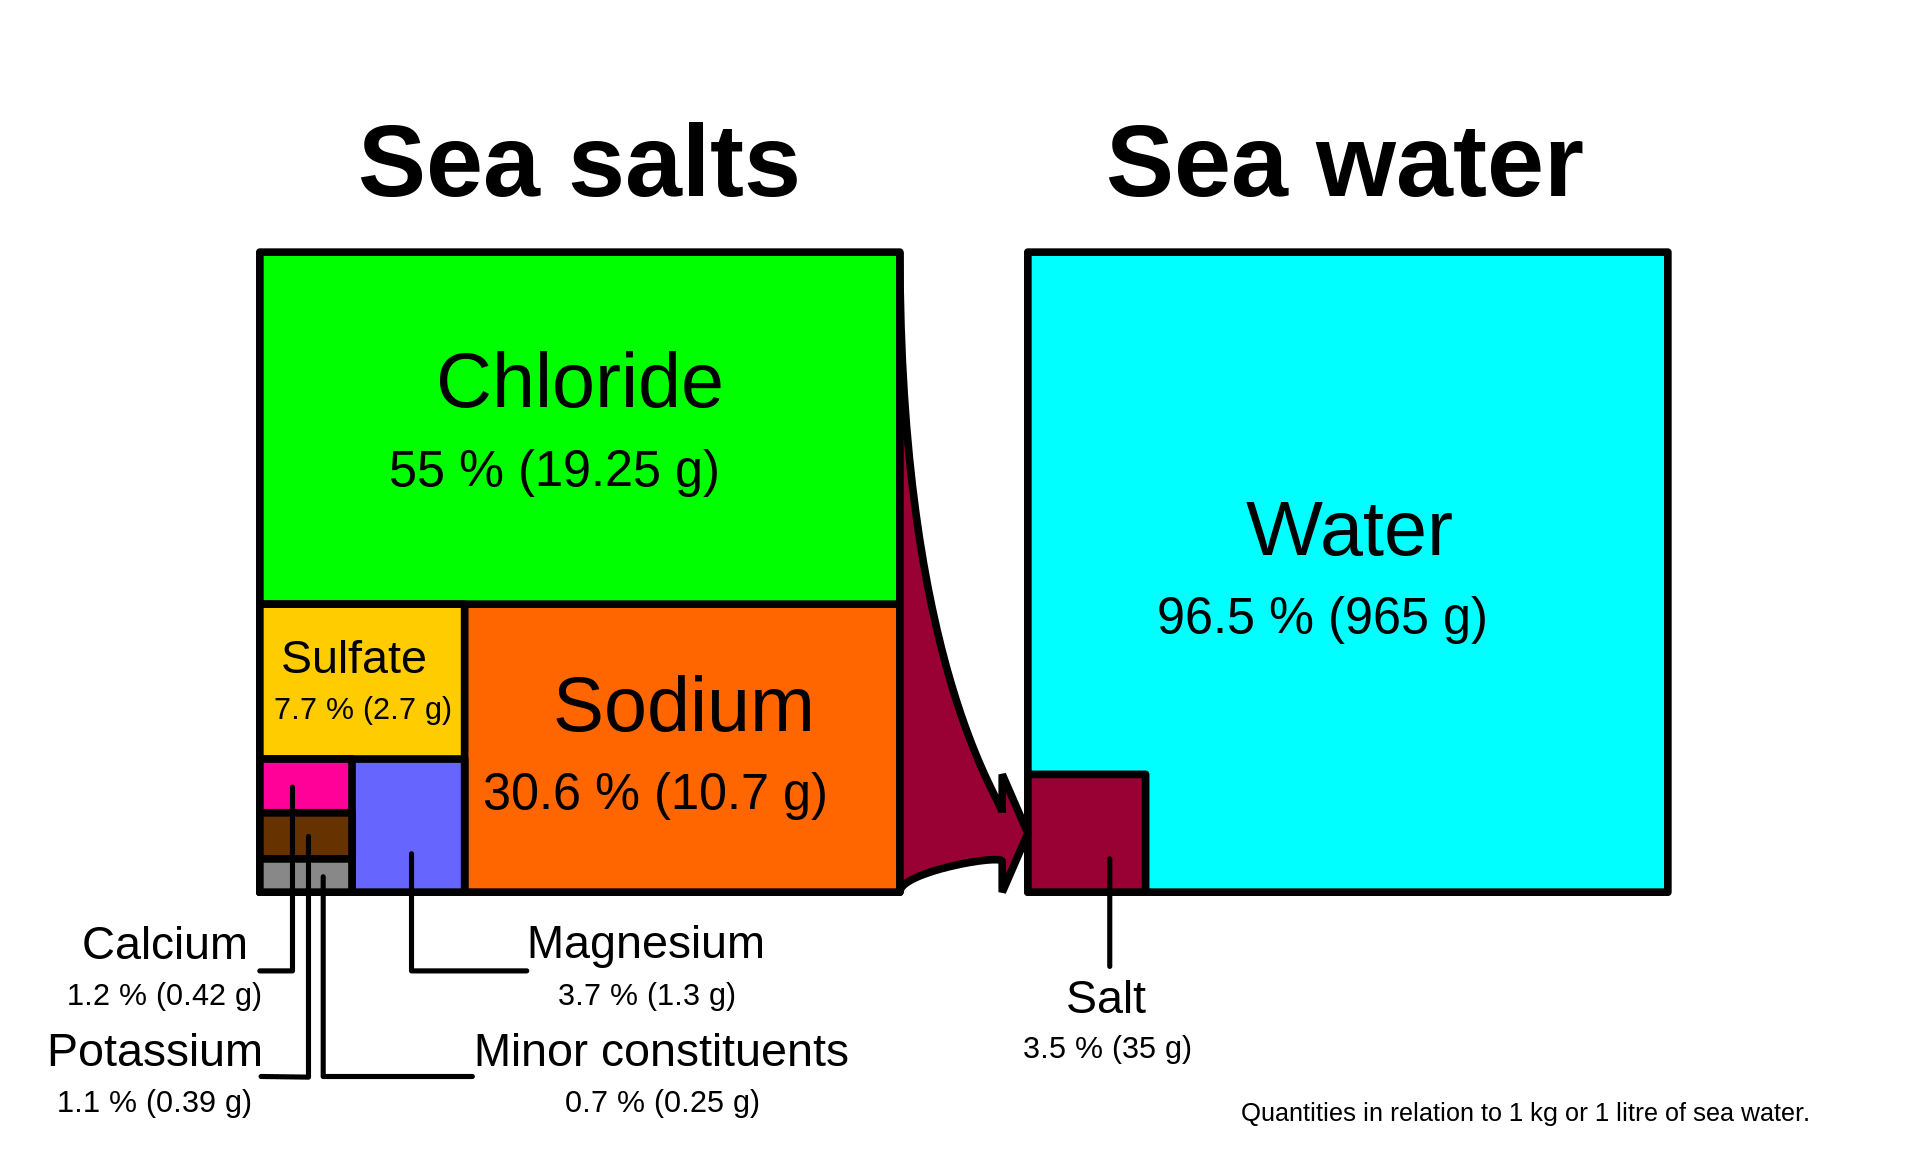
Oceanographers typically use parts per thousand (‰) to express salinity because dissolved substances in ocean water are present in such minute quantities. This means that for every 1,000 grams of seawater, on average, 35 grams are made up of dissolved salts. Consequently, the average salinity of seawater is 35‰. Most salt in seawater is sodium chloride (NaCl).
The salts in the ocean are delivered from two main sources. The first is chemical weathering of rocks on the continents, carried to the oceans via streams. A second major source of dissolved elements found in ocean water is from Earth’s interior through volcanic eruptions in a process called outgassing. Despite rivers and volcanoes constantly adding new material to ocean water, the ocean’s composition remains relatively stable. This stability is achieved because salt from seawater is continually deposited as sediment on the ocean floor, creating a balanced input and output system in the oceans.
Various surface processes alter the salinity of ocean water regionally. Processes that add large amounts of fresh water to seawater, thereby decreasing salinity, include precipitation, runoff from land, icebergs melting, and sea-ice melting. Processes that remove large amounts of fresh water from seawater, increasing salinity, include evaporation and the formation of sea ice.
Latitude and seasons both affect seawater salinity as well. Salinity levels in the open ocean are higher at subtropical latitudes because these areas experience high evaporation rates. In contrast, regions with significant precipitation experience lower salinity levels due to the dilution of ocean waters. This occurs near the equator and in the midlatitudes between 35 and 60 degrees latitude. Seasonally, seawater freezes in the winter at the poles, and when it freezes, the ice itself is practically fresh water. That’s because only the water molecules freeze out, leaving the salt behind and increasing the salinity of the remaining liquid seawater. During the summer, sea ice melts, thereby decreasing salinity.
12.4.2 Ocean Water Density
Density is an important property of ocean water because it determines the water’s vertical position in the ocean. Ocean water density is influenced by two main factors: salinity and temperature. An increase in salinity adds dissolved substances and results in an increase in seawater density. An increase in temperature, on the other hand, causes water to expand and results in a decrease in seawater density. Therefore, temperature and density have an inverse relationship: one variable decreases as the result of the other variable’s increase. A sampling of the open ocean from the surface to the seafloor shows that both temperature and density change with depth and that the changes are not the same everywhere.
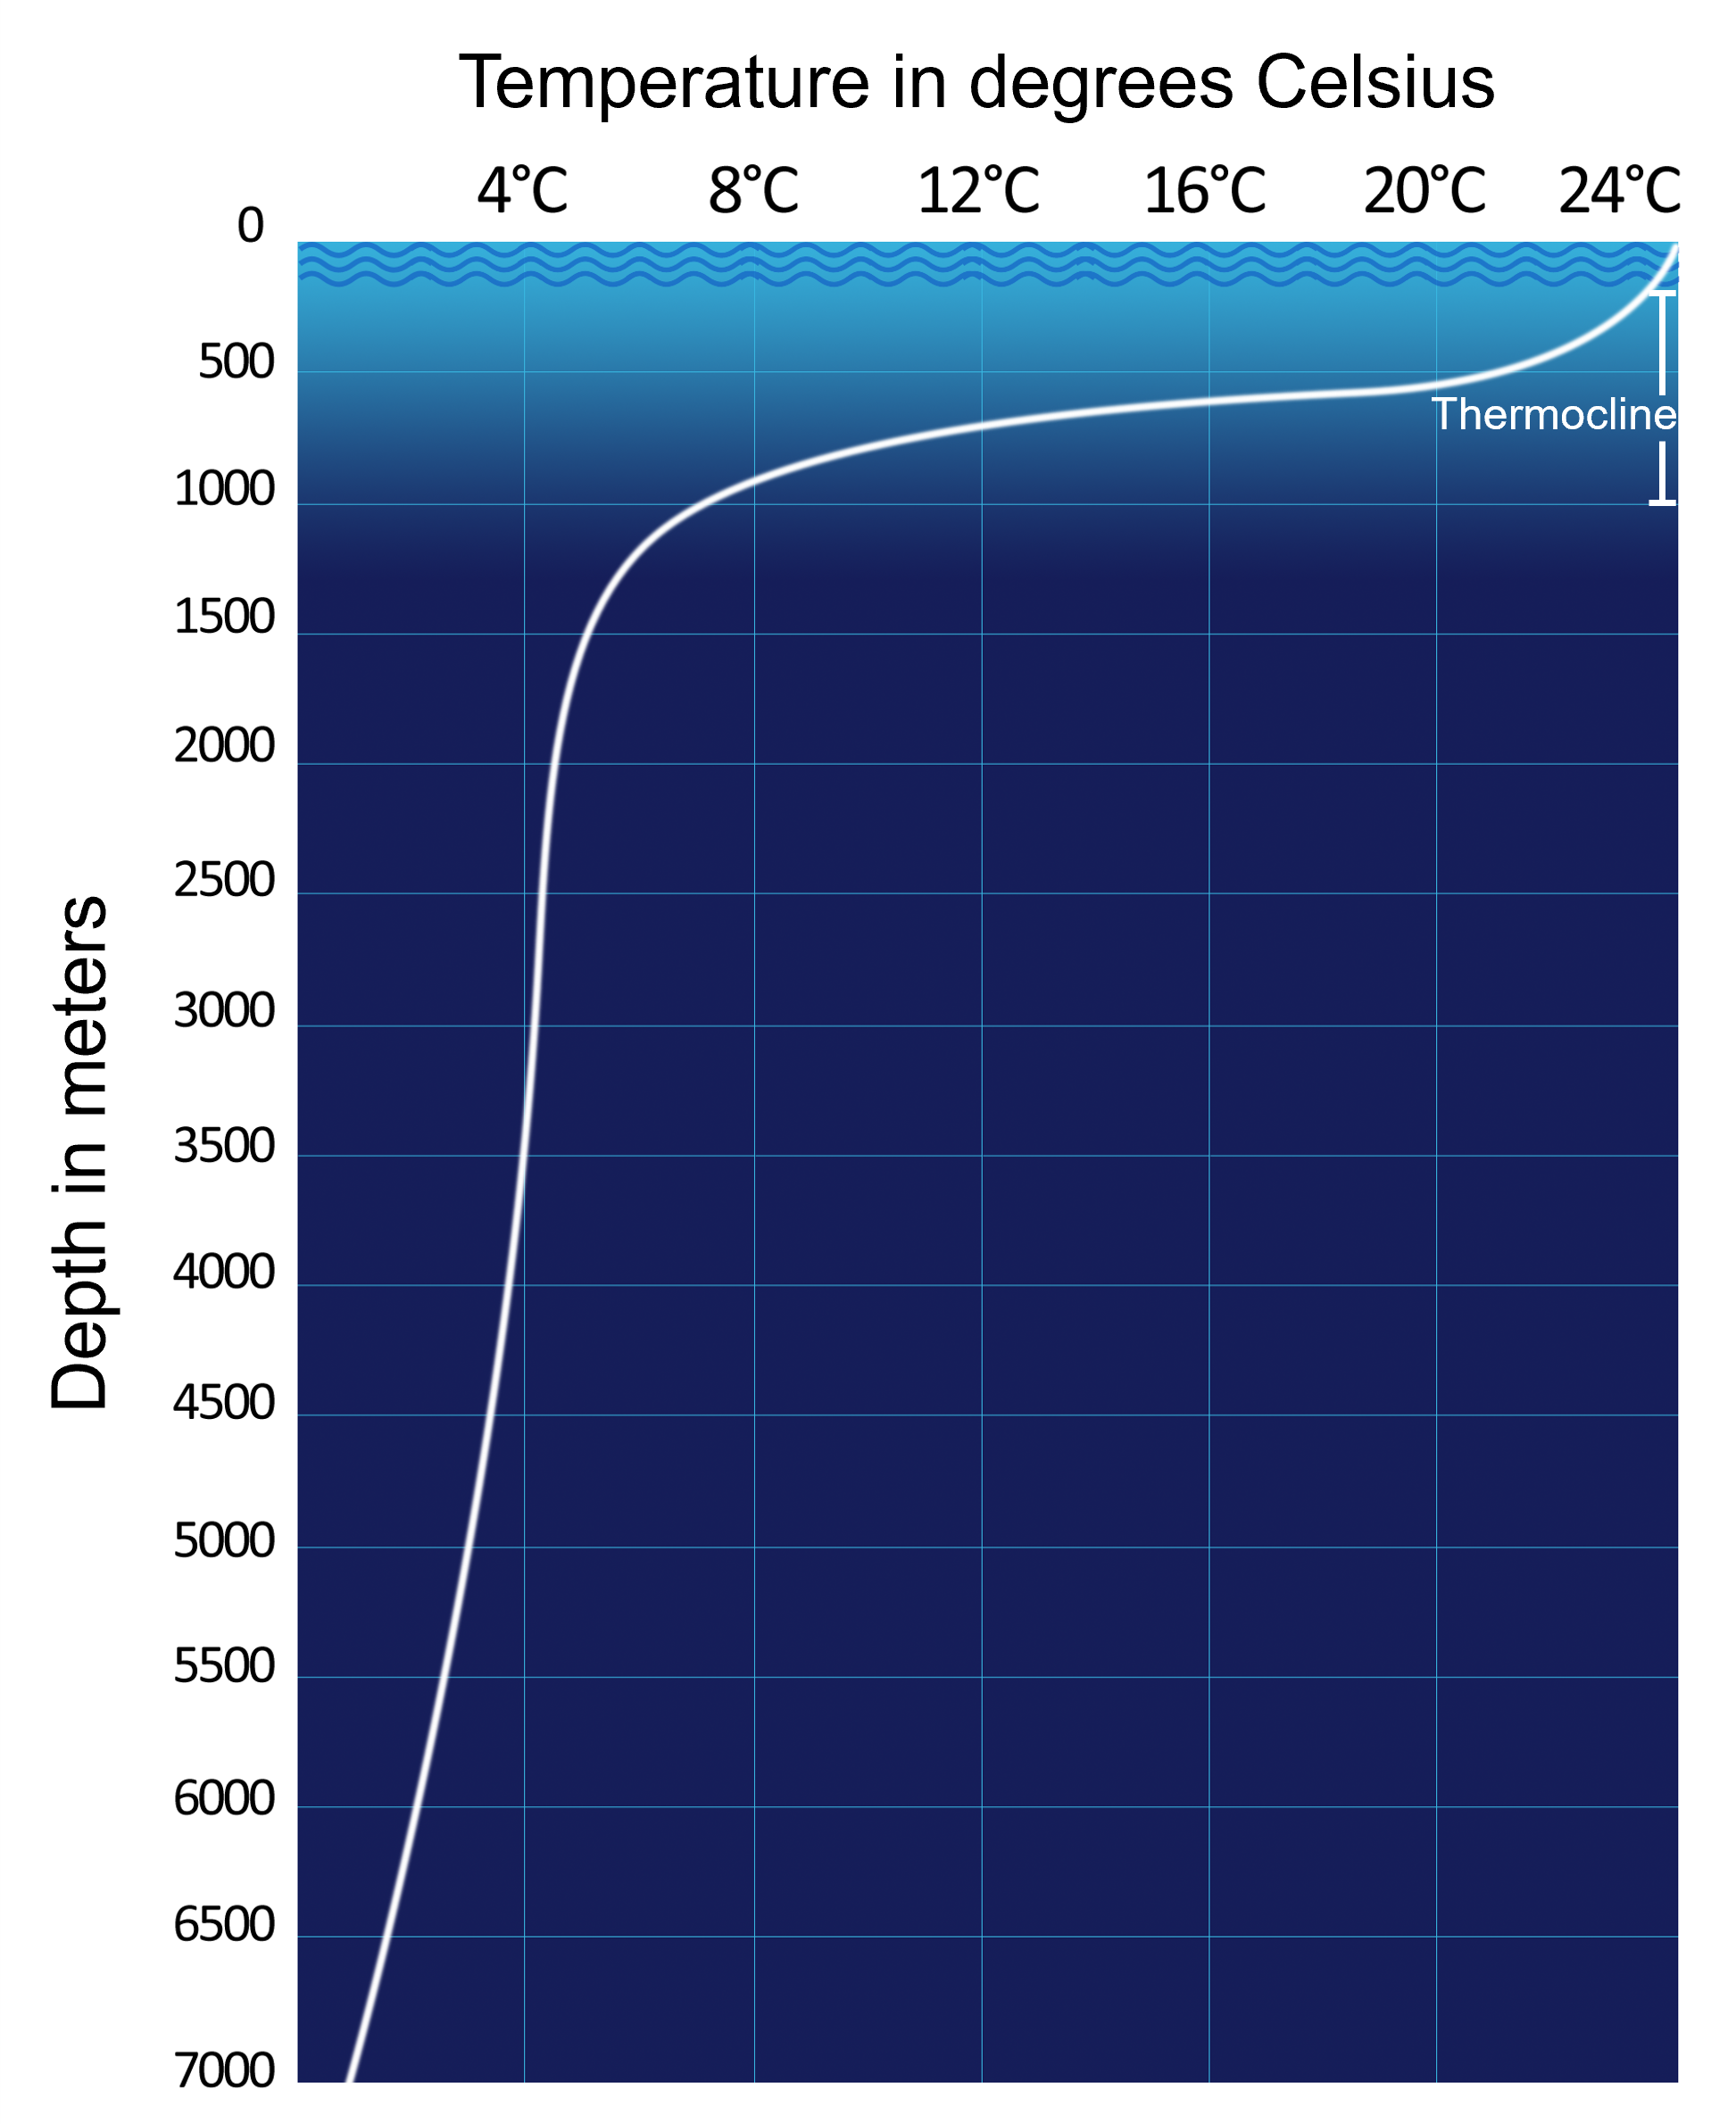
In regions closer to the equator, surface ocean water tends to have warmer temperatures, with temperature rapidly declining as depth increases due to limited penetration of sunlight into the ocean. The transition layer where temperature changes swiftly with depth is termed the thermocline. Conversely, in higher latitudes, where surface temperatures remain consistently cold, the thermocline is nonexistent.
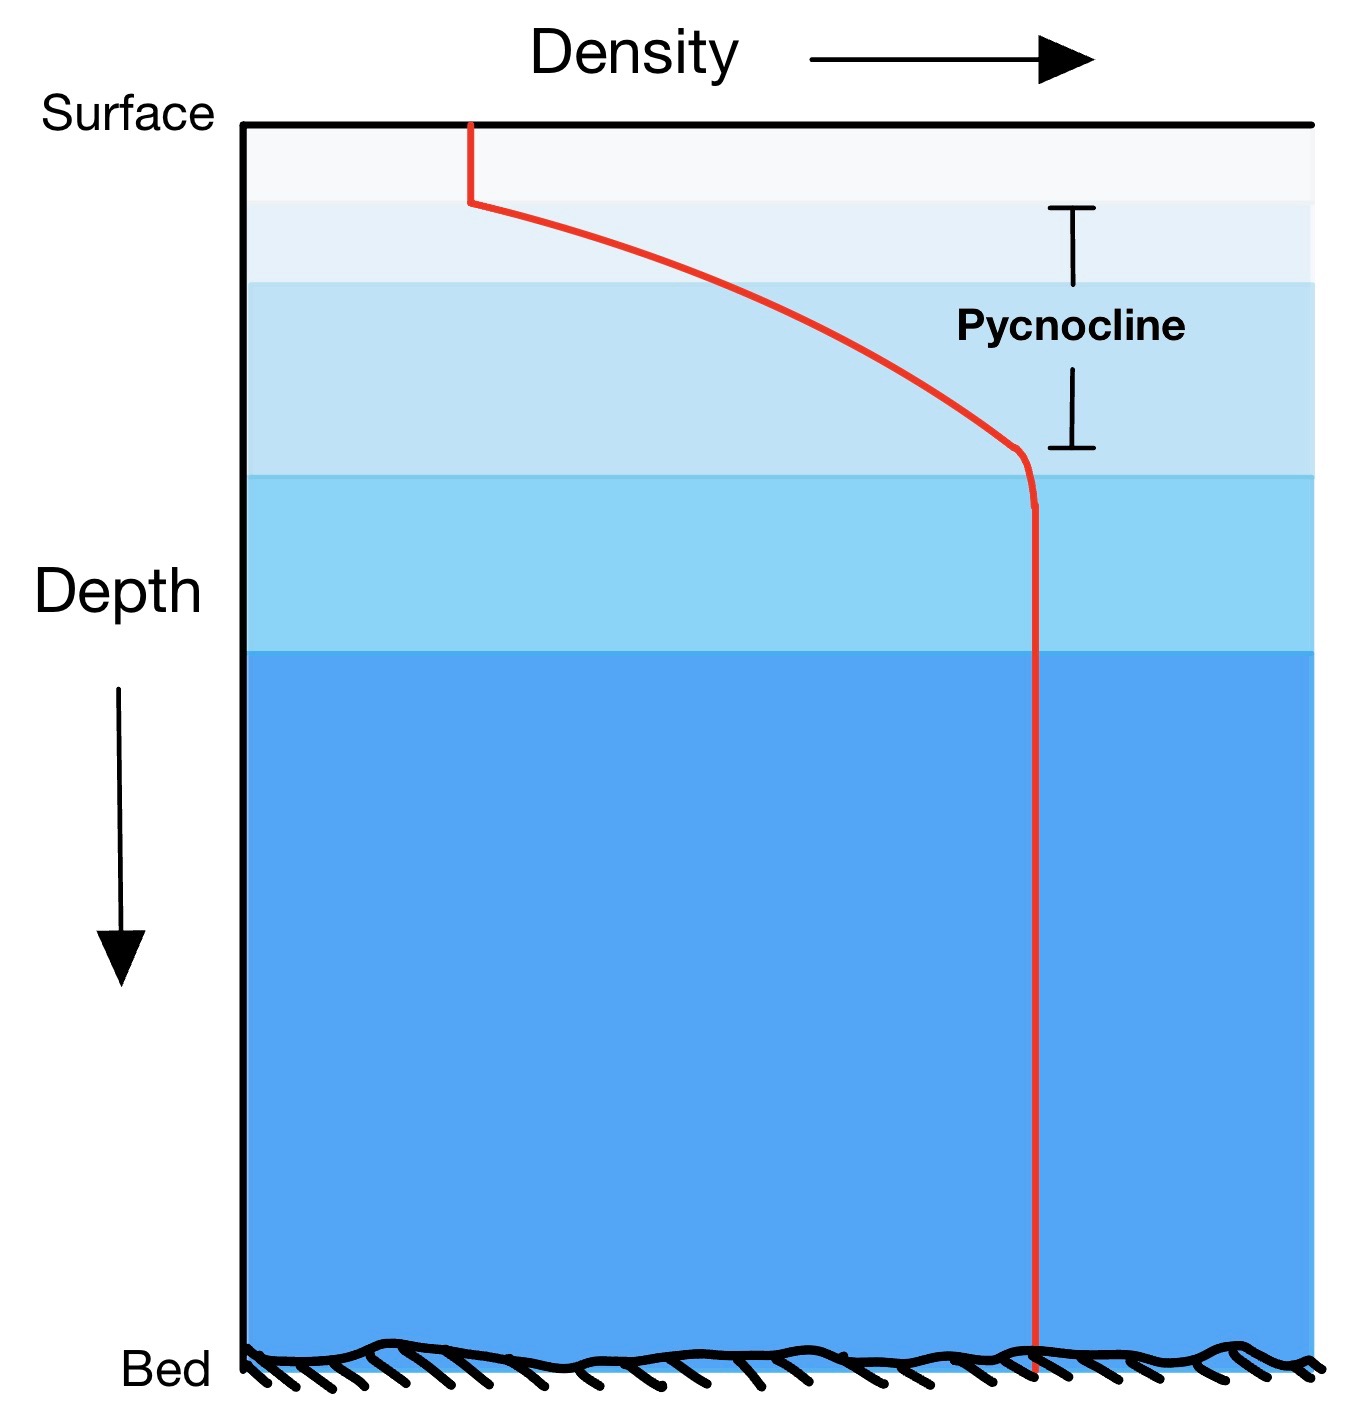
The density of ocean water is also influenced by latitude. In equatorial regions, surface ocean water exhibits lower density due to higher surface temperatures. Similar to temperature trends, density increases with depth. The pycnocline is the layer of ocean water between approximately 300 meters and 1,000 meters, characterized by a rapid change in density with depth. The presence of a pycnocline serves as a barrier to the mixing of low-density water above and high-density water below. Conversely, in polar regions, where temperature gradients are less pronounced, there is no rapid density change with depth, resulting in the absence of a pycnocline.
12.4.3 Ocean Layering
Similar to Earth’s interior, the ocean exhibits vertical zonation based on water density. Lower-density water occupies the surface layers, transitioning to denser water with increasing depth, with the densest seawater at the greatest depths. In the open ocean, a three-tiered structure can be recognized: a shallow surface mixed zone, transition zone, and deep zone.
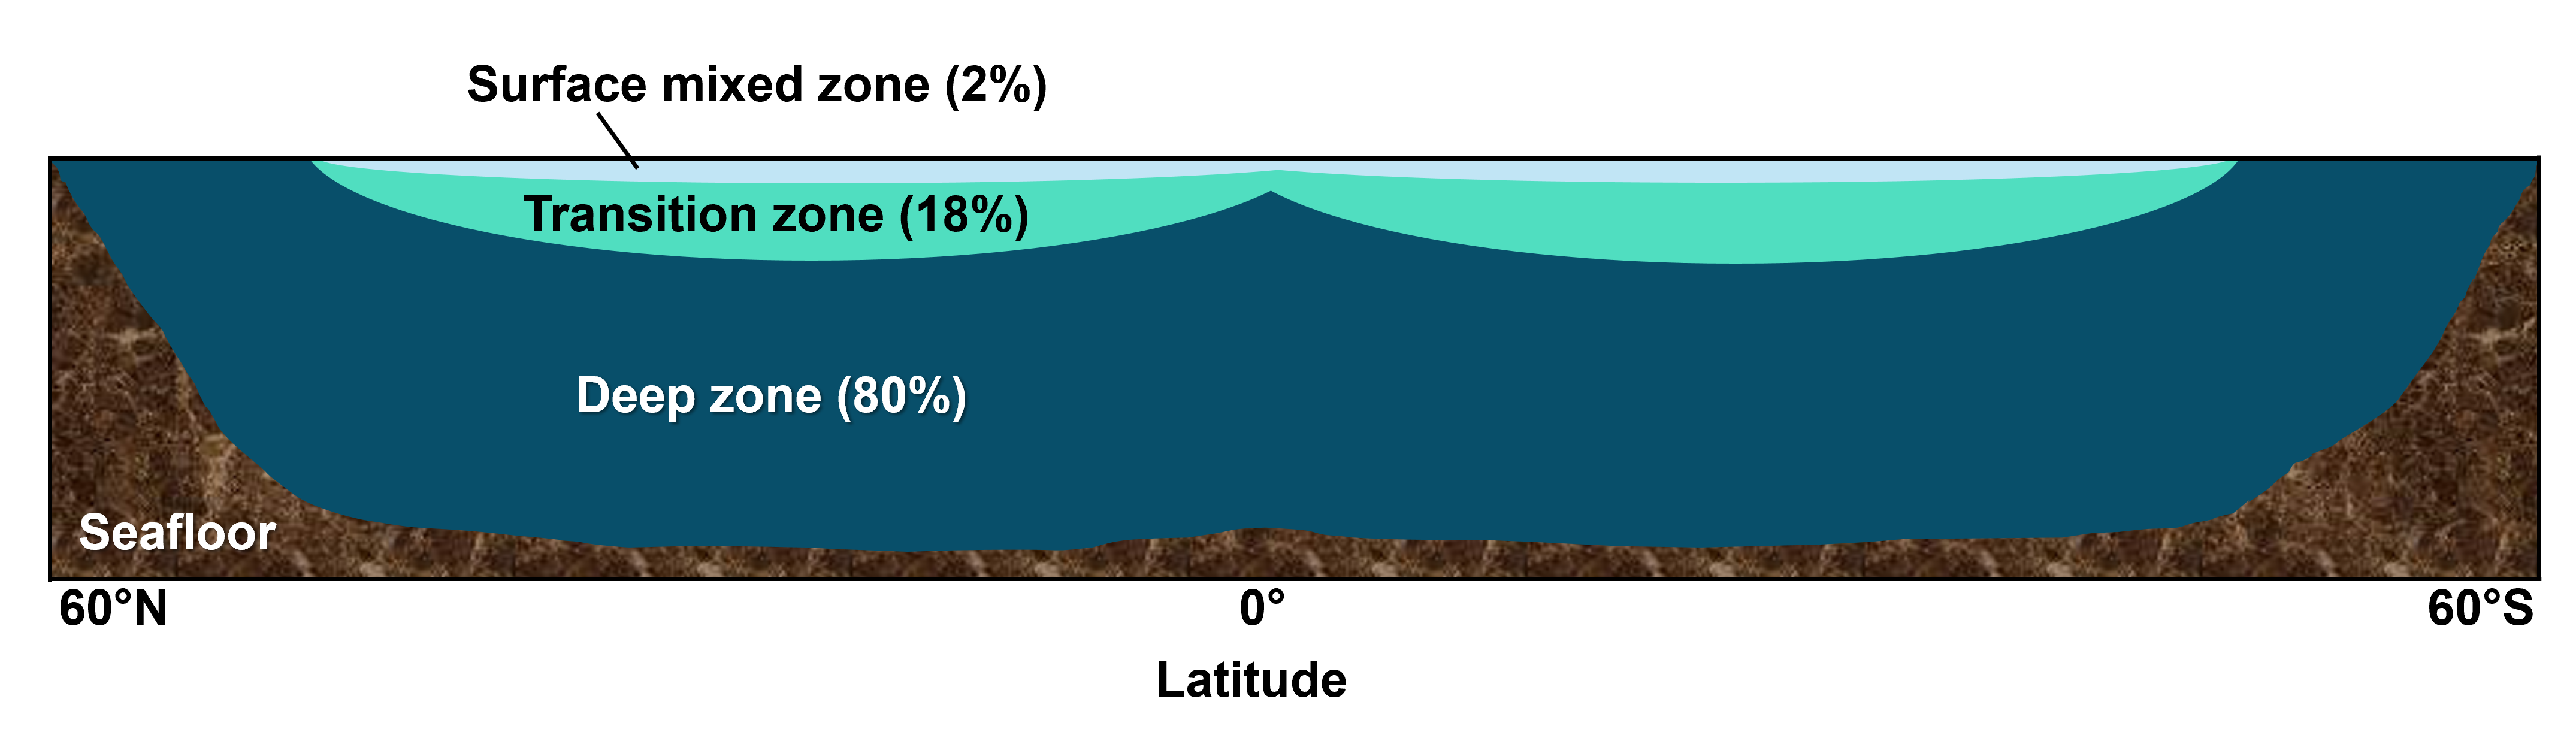
Solar radiation serves as the primary source of heat for the ocean surface. Wind-driven waves, along with turbulence generated by currents and tides, facilitate the mixing of this surface layer, distributing heat through the shallow surface mixed zone. This zone comprises only about 2% of the total ocean volume, having slightly variable thickness and temperature depending on latitude and season. Below the shallow mixed zone, a sharp temperature decline marks the transition zone. This zone bridges the gap between the warm surface waters and the cold deep zone below. It includes a thermocline (and pycnocline) and accounts for roughly 18% of ocean water. Beyond the transition zone lies the vast deep zone, where sunlight doesn’t reach and temperatures are just above freezing. This zone comprises about 80% of ocean water, maintaining consistently high density.
This three-layered structure is not universally applicable. At higher latitudes, the absence of a distinct thermocline and pycnocline negates the rapid changes in temperature and density with depth.

Take this quiz to check your comprehension of this section.
If you are using an offline version of this text, access the quiz for Section 12.4 via the QR code.
12.5 The Ocean Floor
There is a great variety of features at the bottom of our world ocean, including extensive chains of volcanoes, deep trenches, wide plains, and oceanic plateaus. Our understanding of the complex characteristics of the ocean floor remained largely unknown until the HMS Challenger expedition, a scientific voyage that made many foundational oceanographic discoveries which spanned from December 1872 to May 1876. The Challenger expedition marked the first attempt at a comprehensive scientific study of the global ocean; since then, advancements in oceanographic science have unveiled the vast ocean floors in much greater detail.
12.5.1 Mapping the Ocean Floor
Bathymetry refers to the measurement of ocean depths and the charting of the ocean floor’s topography. The fundamental methodology for seafloor mapping leverages sonar (sound navigation and ranging), a technique that utilizes sound waves to navigate, communicate, or detect objects.
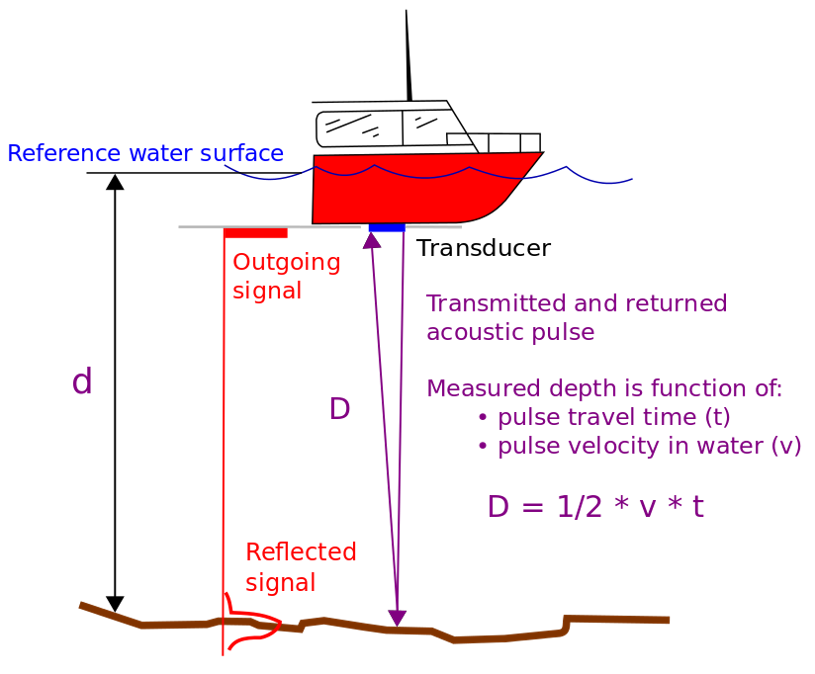
In the early twentieth century, echo sounders were the first devices that used sound for water depth measurement. These devices functioned by transmitting an acoustic pulse, often called a “ping,” into the water column. Upon encountering an object, such as a large marine animal or the seabed itself, the acoustic energy would reflect, generating an echo. A receiver at the surface would capture this reflected echo from the bottom, and a high-precision clock would measure the round-trip travel time down to fractions of a second. With this information, the depth to the ocean floor could be calculated. Continuous monitoring and subsequent depth determinations from these echoes were then plotted, creating a bathymetric profile of the seafloor. By combining numerous profiles from adjacent survey tracks, a comprehensive seafloor chart was produced.
Breakthroughs in technology have led to more detailed ocean floor maps. One such breakthrough involves measuring the shape of the ocean surface from space.
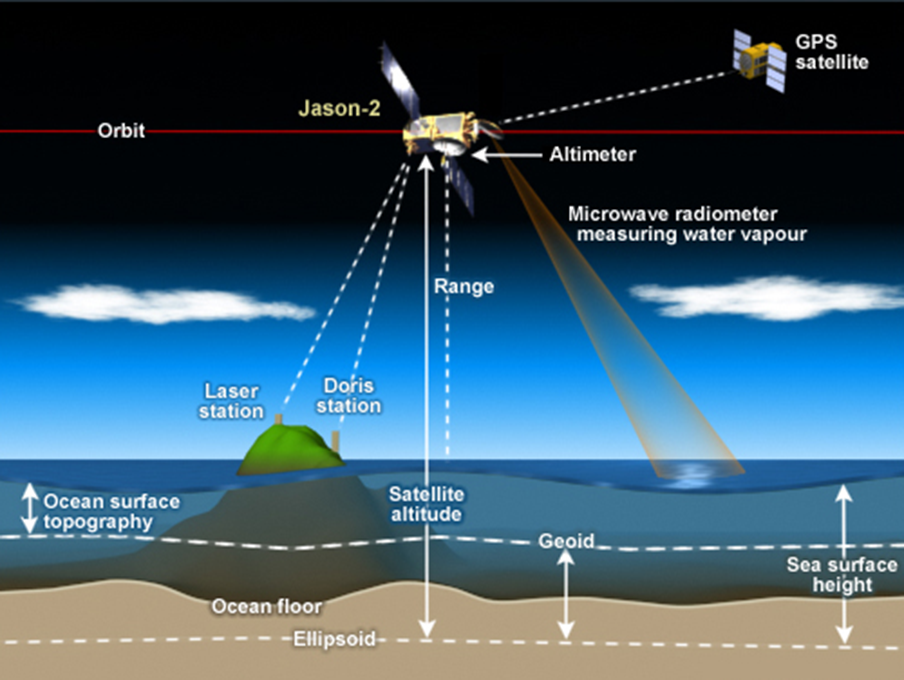
After accounting for waves, tides, currents, and atmospheric effects, it was found that the ocean surface is not perfectly “flat.” Large seafloor features create stronger-than-average gravitational pulls, resulting in elevated areas on the ocean surface, while canyons and trenches cause slight depressions. Satellites equipped with radar altimeters can measure these subtle variations by transmitting and receiving microwave pulses that reflect off the ocean surface, detecting differences as small as a few centimeters. When combined with traditional sonar measurements, this data helps produce detailed maps of the ocean floor.
12.5.2 Ocean Floor Provinces
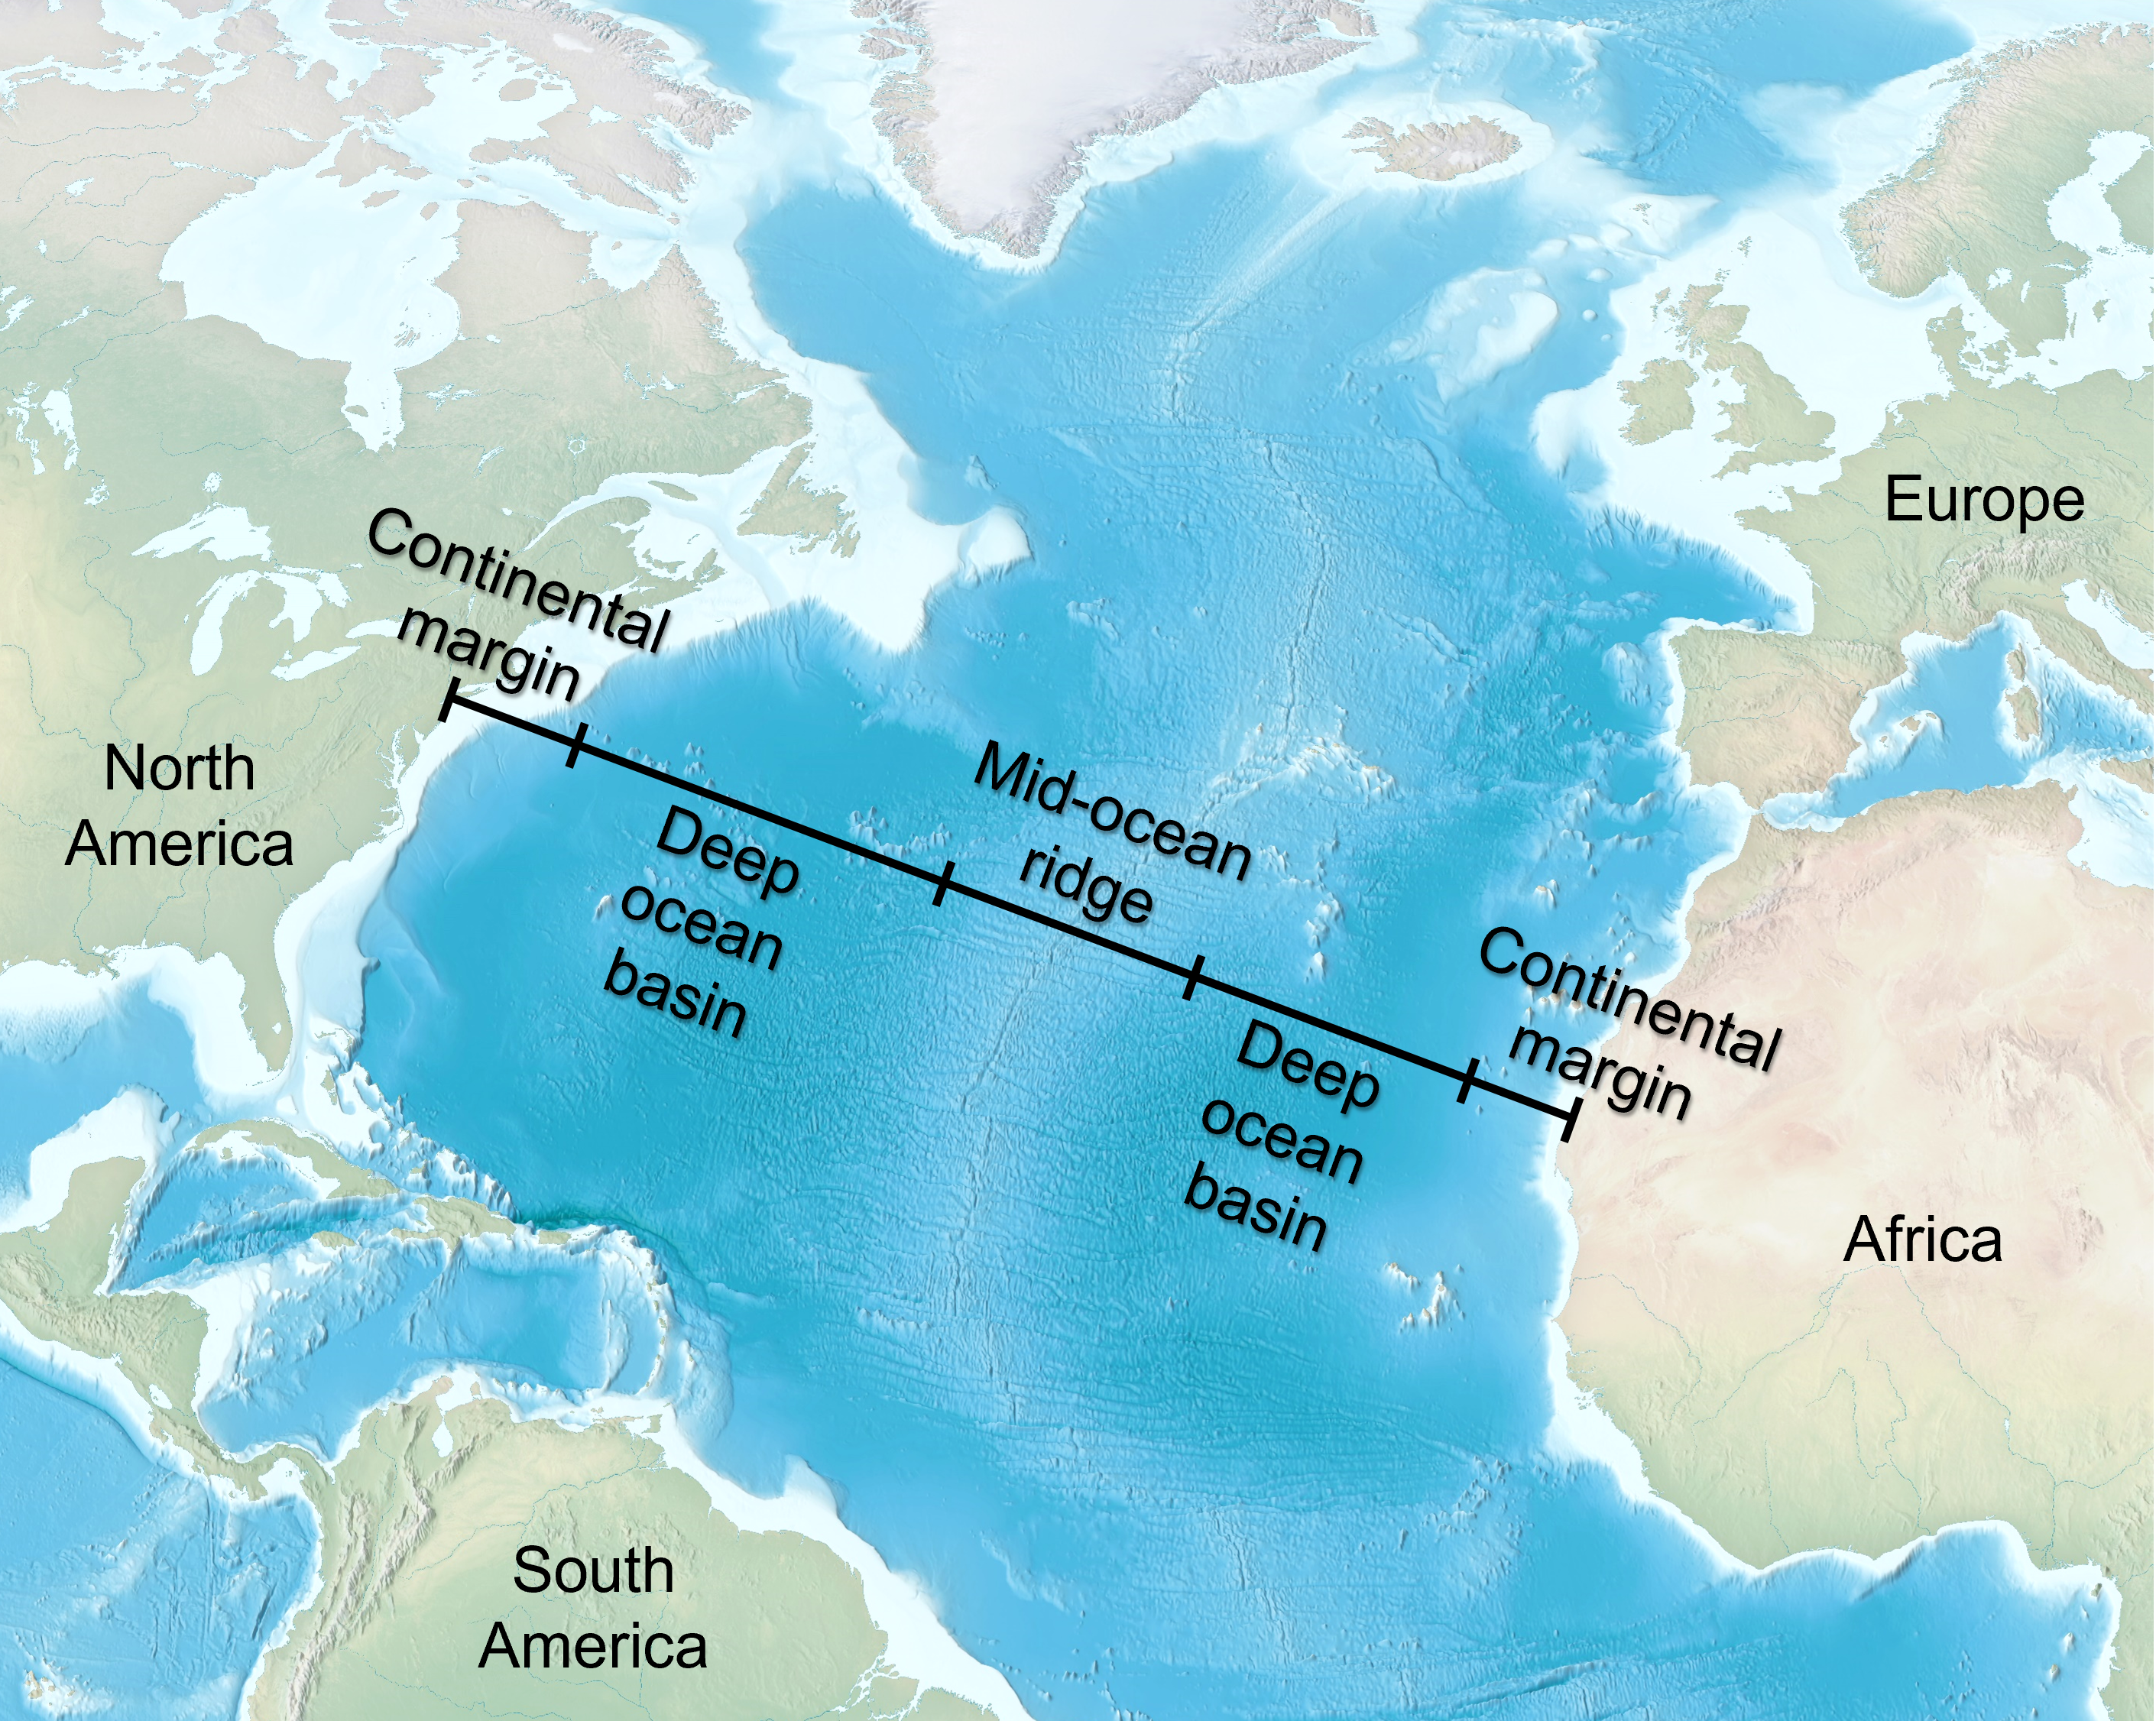
Oceanographers studying the topography of the ocean floor have outlined three major areas, or provinces: continental margins, deep ocean basins, and mid-ocean ridges.
The edges of continents, where land transitions to the deep ocean, are called continental margins. These margins mark the spot where continental crust thins out and gives way to oceanic crust. There are two main types: passive and active margins.
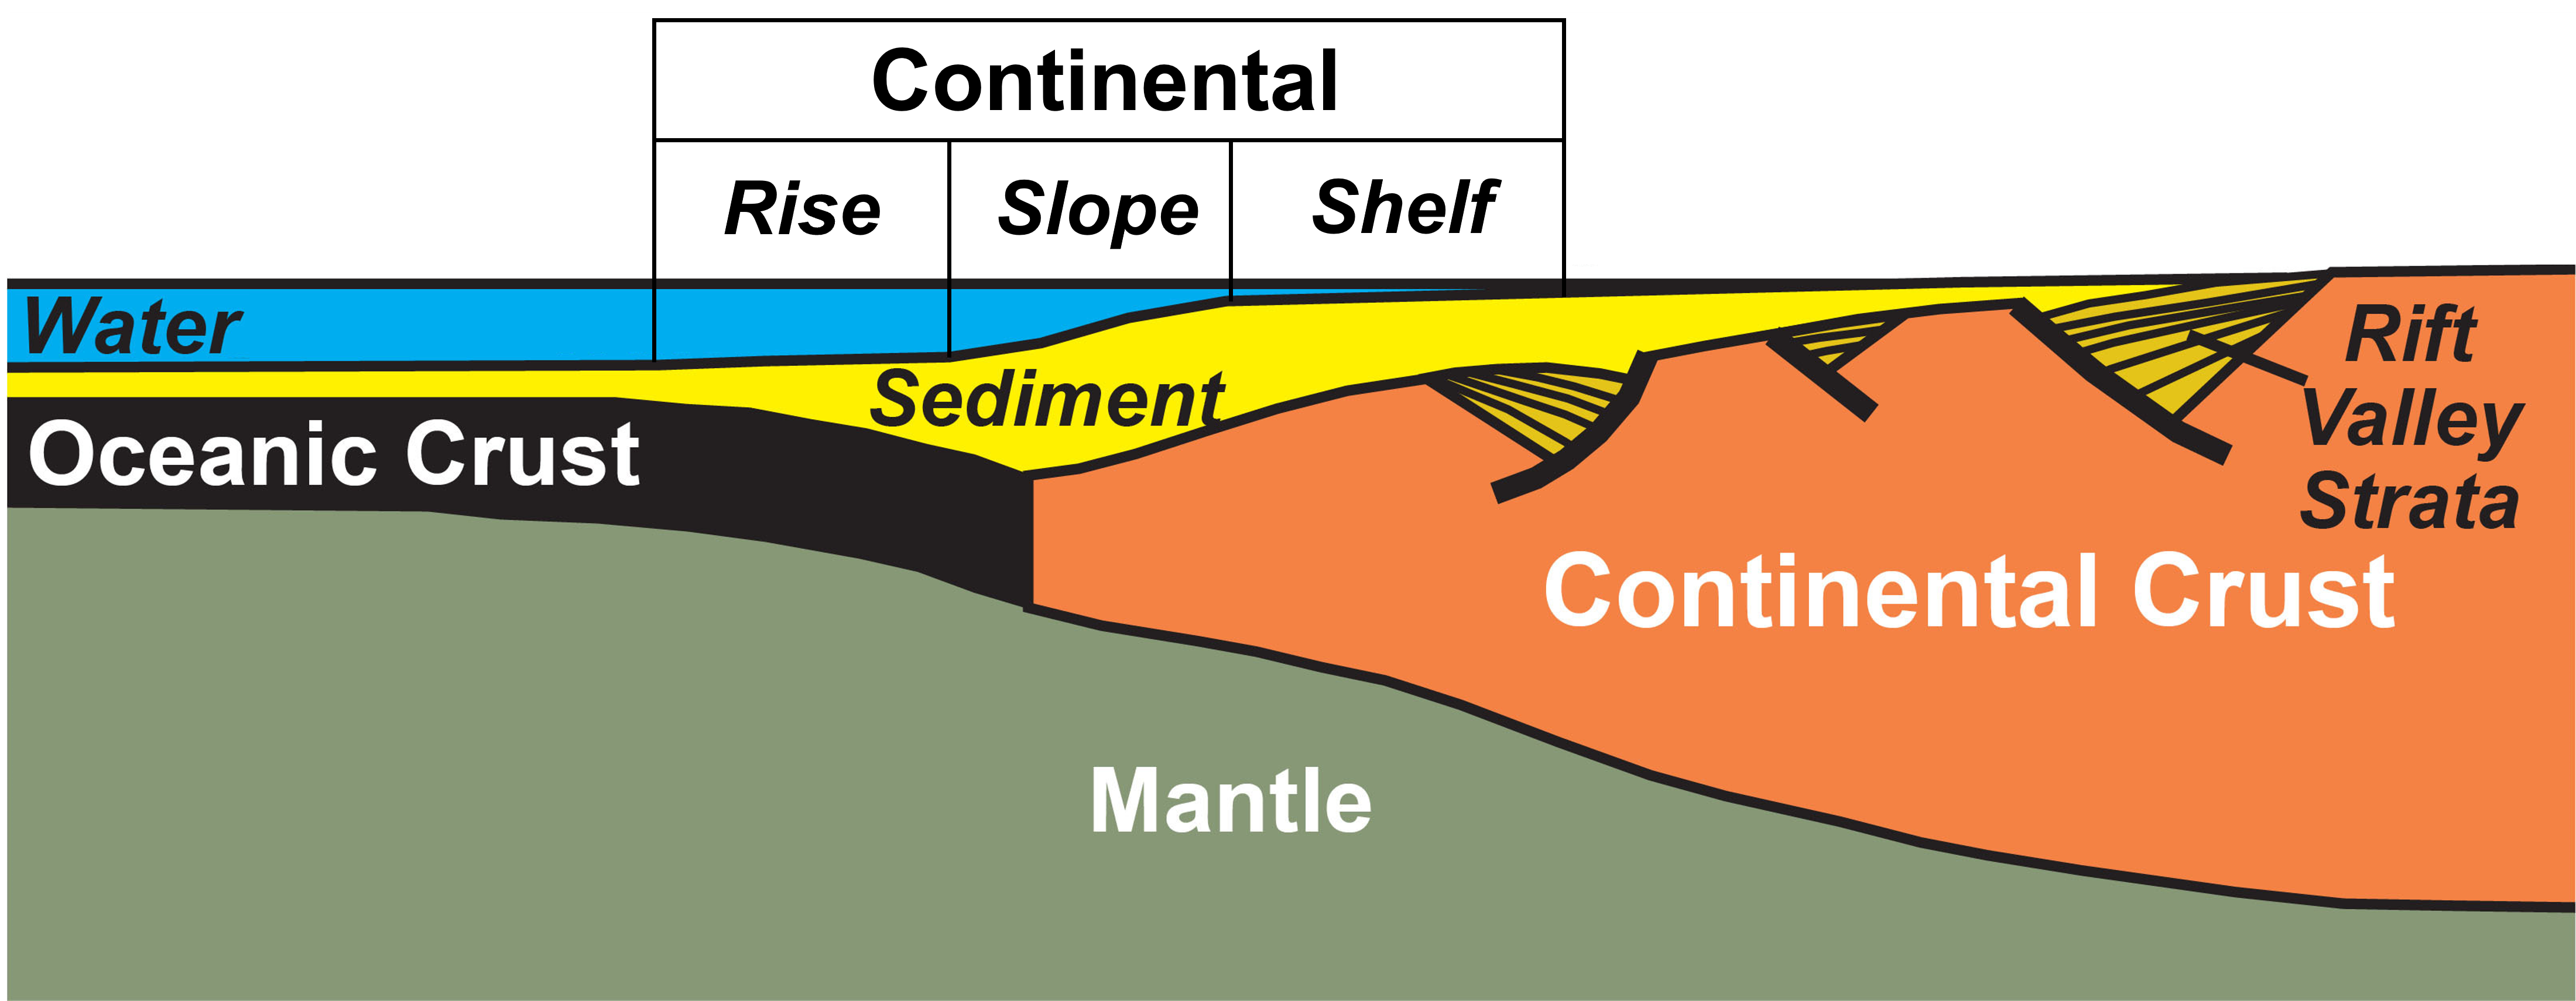
Passive margins are geologically inactive, located far from plate boundaries. Consequently, these margins are not linked to strong earthquakes or volcanic activity. They form when continental blocks slowly rift apart by ongoing seafloor spreading. Passive margins are typically wide and collect massive amounts of sediment over time. They’re made up of several key features: the continental shelf, the continental slope, and the continental rise. Most of the Atlantic Ocean and a significant part of the Indian Ocean are lined by passive margins.
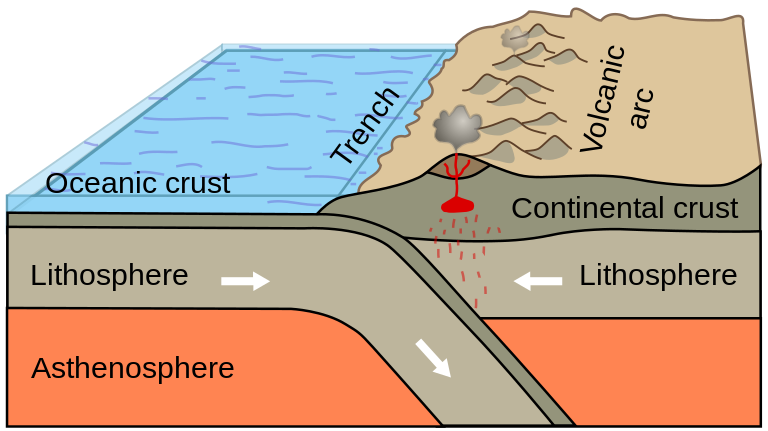
Unlike the Atlantic and Indian Oceans, the majority of the Pacific Ocean is fringed by active continental margins, characterized by subduction zones where the denser oceanic plate is subducted under the less dense continental plate, creating a deep oceanic trench. Oceanic trenches surround most of the Pacific Rim.
Between the continental margin and the mid-ocean ridge lies the deep ocean basin. This region includes deep ocean trenches, abyssal plains, seamounts, and oceanic plateaus.
Most deep ocean trenches are extremely deep linear depressions on the ocean floor located in the Pacific Ocean, where some exceed 33,000 feet in depth.
Abyssal plains are incredibly flat regions present in all oceans. Due to its lack of oceanic trenches, the Atlantic Ocean has the most extensive abyssal plains which act as sediment traps, allowing more material to settle than in other major ocean basins. Submarine landforms known as seamounts rise from the ocean floor without reaching the surface, typically formed from extinct volcanoes that rise abruptly in a conical shape. While seamounts are found in all oceans, they are most common in the Pacific. An oceanic plateau is a massive, relatively flat feature that rises above the surrounding seafloor and has one or more steep sides, formed by extensive outpourings of basaltic lavas.
The mid-ocean ridge is a massive underwater mountain range that snakes its way through all the world’s oceans. Formed along seafloor spreading centers where tectonic plates pull apart, it’s Earth’s longest interconnected mountain system at over 43,000 miles in length. It’s a zone with frequent earthquakes, high heat flow from the Earth’s interior, and volcanic mountains erupting on the newly formed oceanic crust.

Take this quiz to check your comprehension of this section.
If you are using an offline version of this text, access the quiz for Section 12.5 via the QR code.
Summary
Shoreline processes are complex but are important for understanding coastal processes. Waves, currents, and tides are the main agents that shape shorelines. Most coastal landforms can be attributed to moving sand via longshore drift and to long-term rising or falling sea levels.
The shoreline is the interface between water and land and is divided into five zones. Processes at the shoreline are called littoral processes. Waves approach the beach at an angle, which cause the waves to bend toward the beach. This bending action is called wave refraction and is responsible for creating the longshore current and longshore drift—the process that moves sand along the coasts. When the longshore current deposits sand along the coast into quieter waters, the sand can accumulate, creating a spit or barrier called a baymouth bar, which often blocks bays and harbors. Inconvenienced humans create methods to keep their harbors open and preserve sand on their beaches by creating jetties and groins, which negatively affect natural beach processes.
Emergent coasts are created by sea levels falling, while submergent coasts are caused by sea levels rising. Oceans absorb solar energy, which is distributed by currents throughout the world. Circular surface currents, called gyres, rotate clockwise in the Northern Hemisphere and counterclockwise in the Southern Hemisphere. Thermohaline deep circulation connects the world’s deep ocean waters; when shallow poleward moving warm water evaporates, the colder, saltier, and denser water sinks and becomes deep-water currents. The connection between shallow and deep-ocean circulation is called the global conveyor belt.
Tides are the rising and lowering of sea level during the day and are caused by the gravitational effects of the Sun and Moon on the oceans. There are three types of tidal patterns: diurnal, semidiurnal, and mixed. Typical tidal ranges are approximately 1 m (3 ft). Extreme tidal ranges are around 18 m (60 ft).
By weight, ocean water consists of about 3.5% dissolved mineral substances that are collectively termed salts. Salinity is the total amount of solid material dissolved in water. Temperature and density are basic ocean water properties that influence such things as deep-ocean circulation and the distribution and types of life forms. Surface processes, latitude, and seasons alter the salinity of ocean water regionally. Ocean water density is influenced by two main factors: salinity and temperature. The ocean exhibits a three-tiered vertical zonation based on water density: a shallow surface mixed zone, transition zone, and deep zone.
There is a great variety of features at the bottom of our world ocean, including extensive chains of volcanoes, deep trenches, wide plains, and oceanic plateaus. The fundamental methodology for seafloor mapping leverages sonar, a technique that utilizes sound waves to navigate, communicate, or detect objects. Oceanographers studying the topography of the ocean floor have outlined three major provinces: continental margins, deep ocean basins, and mid-ocean ridges.

Take this quiz to check your comprehension of this chapter.
If you are using an offline version of this text, access the quiz for Chapter 12 via the QR code.
Text References
- Colling, A. (2001). Ocean circulation (eds. Open University Course Team): Butterworth-Heinemann.
- Davis, R.A., Jr., and Fitzgerald, D.M. (2009). Beaches and coasts: John Wiley & Sons.
- Davis, R.A. (1997). The evolving coast: Scientific American Library New York.
- Greene, Paul, Follett, G., and Henker, C. (2009). Munitions and dredging experience on the United States coast. Marine Technology Society Journal, 43(4), 127–31.
- Jackson, N.L., Harley, M.D., Armaroli, C., and Nordstrom, K.F. (2015). Beach morphologies induced by breakwaters with different orientations. Geomorphology, 239(June), 48–57.
- Littoral Bypassing and Beach Restoration in the Vicinity of Port Hueneme, California. (n.d.). In Coastal Engineering (1966).
- Munk, W.H. (1950). On the wind-driven ocean circulation. Journal of Meteorology, 7(2), 80–93.
- Normark, W.R., and Carlson, P.R. (2003). Giant submarine canyons: Is size any clue to their importance in the rock record? Geological Society of America Special Papers 370(January), 175–90.
- Reineck, H-E, and Singh, I.B. (2012). Depositional sedimentary environments: With reference to terrigenous clastics: Springer Science & Business Media.
- Rich, J.L. (1951). Three critical environments of deposition, and criteria for recognition of rocks deposited in each of them. Geological Society of America Bulletin, 62(1), 1–20.
- Runyan, K., and Griggs, G. (2005). Implications of harbor dredging for the Santa Barbara littoral cell. In California and the World Ocean ’02, 121–35: American Society of Civil Engineers.
- Schwiderski, E.W. (1980). On charting global ocean tides. Reviews of Geophysics, 18(1), 243–68.
- Stewart, R.H. (2008). Introduction to Physical Oceanography. Texas A & M University Texas.
- Stommel, H., and Arons, A.B. (2017). On the abyssal circulation of the world ocean: I. Stationary Planetary Flow Patterns on a Sphere. ScienceDirect. http://www.sciencedirect.com/science/article/pii/0146631359900656.
- NOAA. Why is the ocean salty, but rivers flowing into it are not? National Ocean Service website, updated on 01/18/24. https://oceanservice.noaa.gov/facts/riversnotsalty.html.
- Earle, S. (2019). Physical geology – 2nd edition: BCcampus. Retrieved from https://opentextbc.ca/physicalgeology2ed
Figure References
Figure 12.1: Particle motion within a wind-blown wave. Kraaiennest. 2008. CC BY-SA 4.0. https://commons.wikimedia.org/wiki/File:Deep_water_wave.gif
Figure 12.2: Aspects of water waves, labeled. National Oceanic and Atmospheric Administration (NOAA). Unknown date. Public domain. https://oceanservice.noaa.gov/education/tutorial_currents/media/supp_cur03a.html
Figure 12.3: Diagram describing wavebase. GregBenson. 2004. CC BY-SA 3.0. https://en.wikipedia.org/wiki/File:Wavebase.jpg
Figure 12.4: Wave train moving with dispersion. Fffred~commonswiki. 2006. Public domain. https://commons.wikimedia.org/wiki/File:Wave_packet_(dispersion).gif
Figure 12.5: A rogue wave estimated at 18.3 meters (60 feet) in the Gulf Stream off of Charleston, South Carolina. NOAA. 2024. Public domain. https://oceanservice.noaa.gov/facts/roguewaves.html
Figure 12.6: Types of breakers. Kraaiennest. 2015. CC BY-SA 3.0. https://commons.wikimedia.org/wiki/File:Breaking_wave_types.svg
Figure 12.7: All waves, including tsunamis, slow down as they reach shallow water. Régis Lachaume. 2005. CC BY-SA 3.0. https://commons.wikimedia.org/wiki/File:Propagation_du_tsunami_en_profondeur_variable.gif
Figure 12.8: Diagram of zones of the shoreline. US Navy. 2006. Public domain. https://commons.wikimedia.org/wiki/File:Littoral_Zones.jpg
Figure 12.9: Longshore drift. United States Geological Survey (USGS). 2006. Adapted by Laura Neser. Public domain. https://commons.wikimedia.org/wiki/File:Longshore_i18n.png
Figure 12.10: Jetties near Carlsbad, California. USGS. 2005. Public domain. https://commons.wikimedia.org/wiki/File:Jetty_break2_new(USGS).jpg
Figure 12.11: Animation of rip currents. NOAA. 2008. Public domain. https://www.nws.noaa.gov/mdl/rip_current
Figure 12.12: Rip currents sign at Canaveral National Seashore, Florida. Laura Neser. 2018. CC BY-NC.
Figure 12.13: Island Arch, a sea arch in Victoria, Australia. Diliff. 2008. CC BY-SA 3.0. https://commons.wikimedia.org/wiki/File:Island_Archway,_Great_Ocean_Rd,_Victoria,_Australia_-_Nov_08.jpg
Figure 12.14: This tombolo known as Angel Road connects the stack of Shodo Island, Japan. 663highland. 2012. CC BY-SA 3.0. https://commons.wikimedia.org/wiki/File:Angel_Road_Shodo_Island_Japan01s3.jpg
Figure 12.15: Wave notches carved by Lake Bonneville, Antelope Island, Utah. Wilson44691. 2008. Public domain. https://commons.wikimedia.org/wiki/File:WaveCutPlatformsAntelopeIslandUT.jpg
Figure 12.16: Landsat image of Chesapeake Bay, Eastern United States. USGS, NASA. 2009. Public domain. https://www.usgs.gov/media/images/chesapeake-bay-landsat
Figure 12.17: General diagram of a tidal flat and associated features. Foxbat deinos. 2009. Public domain. https://en.m.wikipedia.org/wiki/File:Tidal_flat_general_sketch.png
Figure 12.18: Kara-Bogaz Gol lagoon, Turkmenistan. NASA. 1995. Public domain. https://commons.wikimedia.org/wiki/File:Kara-Bogaz_Gol_from_space,_September_1995.jpg
Figure 12.19: Bird’s-eye view of groins gathering sediment from longshore drift (current is flowing from right to left). Archer0630. 2013. CC BY-SA 3.0. https://commons.wikimedia.org/wiki/File:Groin_effect-3.jpg
Figure 12.20: Groin system on a coast in Virginia. Internet Archive Book Images. 1958. Public domain. https://commons.wikimedia.org/wiki/File%3AThe_Annual_bulletin_of_the_Beach_Erosion_Board_(1958)_(18396945096).jpg
Figure 12.21: A tombolo formed behind the breakwater at Venice, CA. Internet Archive Book Images. 1948. Public domain. https://flic.kr/p/wRSfxb
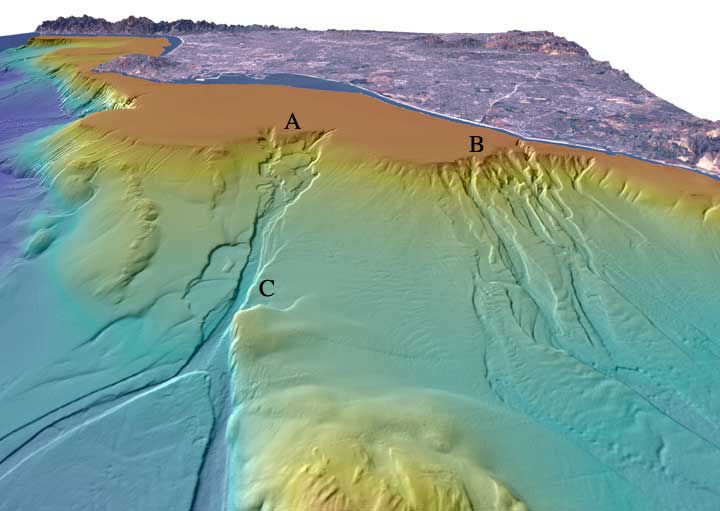
Figure 12.22: Submarine canyons off of Los Angeles. A = San Gabriel Canyon, B = Newport Canyon. At Point C, the canyon is 815 m wide and 25 m deep. USGS. 2012. Public domain. https://commons.wikimedia.org/wiki/File:Canyons_off_LA.jpg
Figure 12.23: World ocean currents. Dr. Michael Pidwirny. 2007. Public domain. https://commons.wikimedia.org/wiki/File:Corrientes-oceanicas.png
Figure 12.24: Global thermohaline circulation. NASA. 2008. Public domain. https://commons.wikimedia.org/wiki/File:Thermohaline_Circulation_2.png
Figure 12.25: Diagram showing tides in relation to the Sun and Moon. Snubcube. 2013. Public domain. Adapted by Laura Neser. https://commons.wikimedia.org/wiki/File:Tide_type.svg
Figure 12.26: Different tide types. Snubcube. 2013. Public domain. https://commons.wikimedia.org/wiki/File:Tide_type.svg
Figure 12.27: Global tide types. KVDP. 2009. Public domain. https://commons.wikimedia.org/wiki/File:Diurnal_tide_types_map.jpg
Figure 12.28: A tidal day lasts slightly longer than 24 hours. NOAA. Unknown date. Public domain. https://oceanservice.noaa.gov/education/tutorial_tides/tides05_lunarday.html
Figure 12.29: Proportions of water and dissolved components in a typical sample of seawater. Tcncv. 2008. Public domain. https://en.wikipedia.org/wiki/Seawater#/media/File:Sea_salt-e-dp_hg.svg
Figure 12.30: Variations in ocean-water temperature with depth for low-latitude regions. Praveenron. 2014. Adapted by Laura Neser. Public domain. https://commons.wikimedia.org/wiki/File:THERMOCLINE.png
Figure 12.31: Variations in ocean-water density with depth for low-latitude regions. Ebmwtreng. 2023. Public domain. https://commons.wikimedia.org/wiki/File:Pycnocline_illustrative_drawing_03_13_22.jpg
Figure 12.32: The ocean’s layers. Laura Neser. Public domain.
Figure 12.33: Approximate routes of the the Challenger expedition of 1872–1876. rehemat24. Adapted by Laura Neser. Accessed June 7, 2024. CC BY. https://diatoms.myspecies.info/file-colorboxed/86
Figure 12.34: Diagram showing the basic principle of single-beam echo sounding. Brandon T. Fields (cdated) via the US Army Corps of Engineers. 2012. Public domain. https://commons.wikimedia.org/wiki/File:Principle_of_SBES.svg
Figure 12.35: How satellite radar altimetry works. NOAA/STAR. Accessed June 7, 2024. Public domain. https://www.star.nesdis.noaa.gov/socd/lsa/AltBathy
Figure 12.36: Major topographic provinces of the North Atlantic Ocean. Tom Patterson. 2020. Adapted by Laura Neser. 2024. Public domain. https://commons.wikimedia.org/wiki/File:North_Atlantic_seafloor.jpg
Figure 12.37: A passive continental margin. NPGallery. 2019. Adapted by Laura Neser. 2024. Public domain. https://npgallery.nps.gov/AssetDetail/8869db4c-3c8b-403f-ae44-128352ca73c6
Figure 12.38: An active continental margin. Booyabazooka. 1999. Public domain. https://commons.wikimedia.org/wiki/File:Active_Margin.svg.
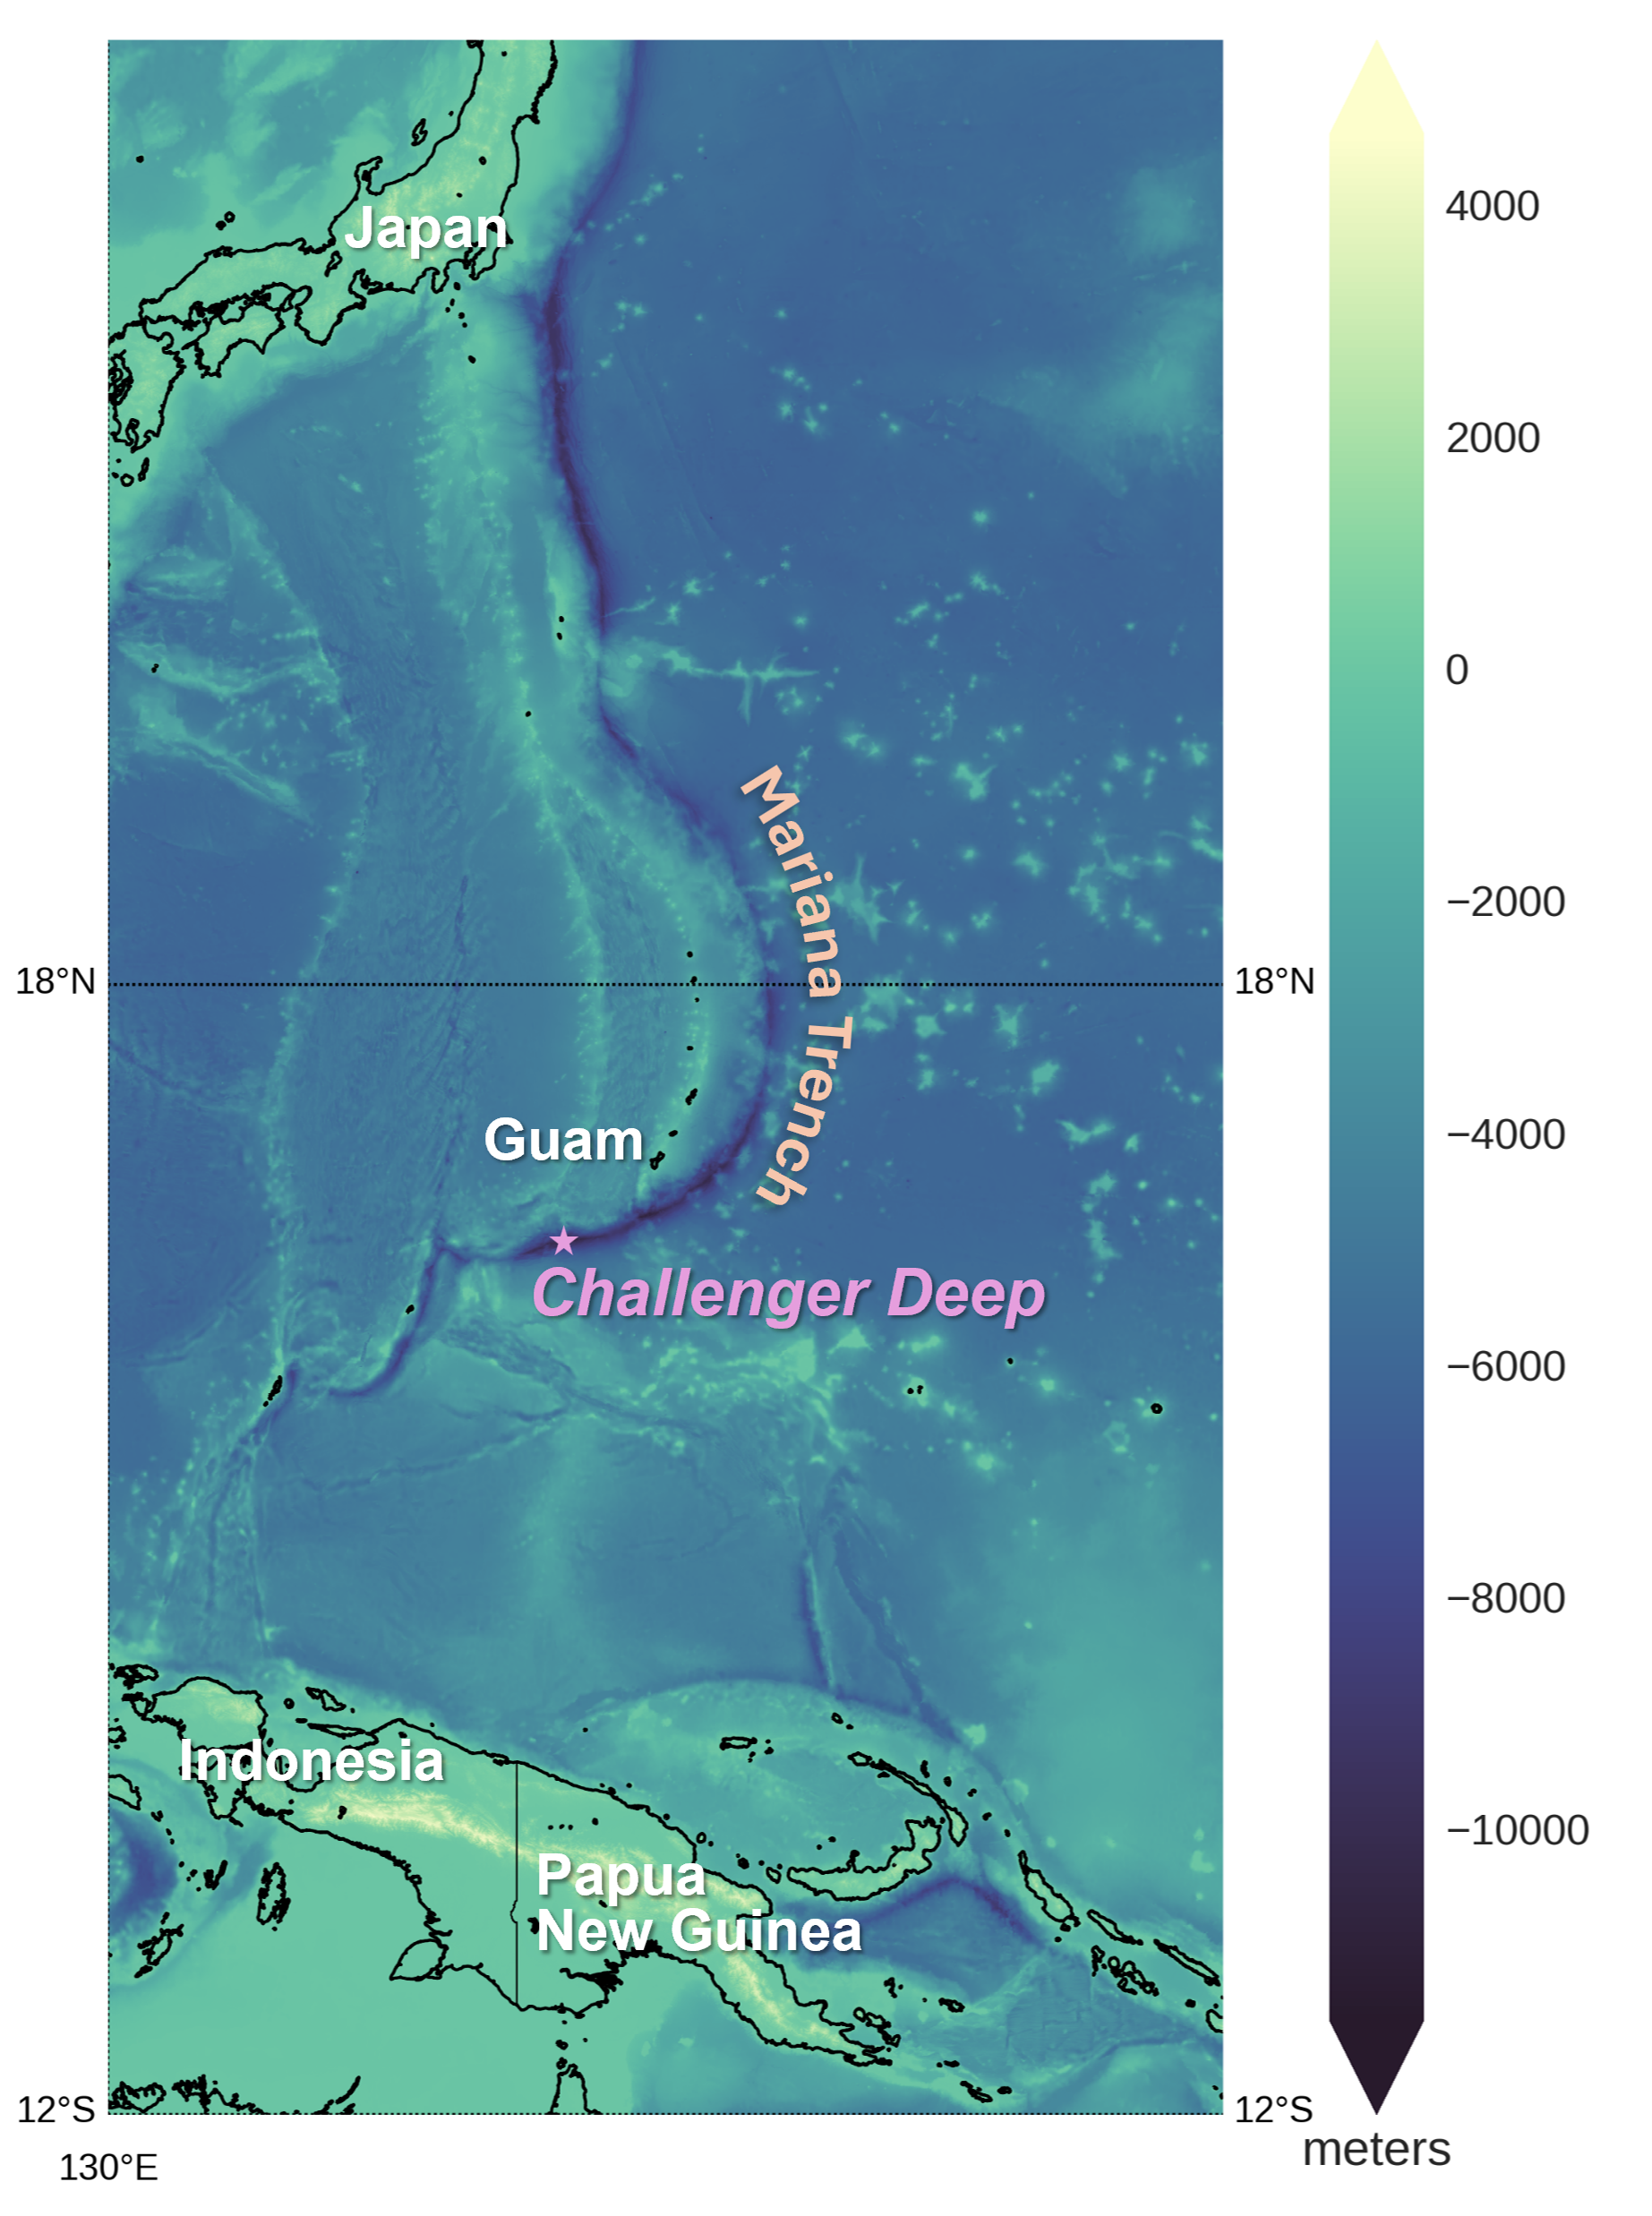
Figure 12.39: Bathymetry map of the Mariana Trench region. Astrobob. 2017. Adapted by Laura Neser. 2024. CC BY-SA. https://commons.wikimedia.org/wiki/File:Mariana_trench.png
Figure 12.40: World distribution of mid-ocean ridges. J M Watson, USGS. 1999. Public domain. https://pubs.usgs.gov/gip/dynamic/baseball.html
Figure Descriptions
Figure 12.1: The red circles are the present positions of massless particles, moving with the flow velocity. The light-blue line gives the path of these particles, and the light-blue circles the particle position after each wave period. The white dots are fluid particles, also followed in time. In the case shown here, the mean Eulerian horizontal velocity below the wave trough is zero. Observe that the wave period, experienced by a fluid particle near the free surface, is different from the wave period at a fixed horizontal position (as indicated by the light-blue circles). This is due to the Doppler shift.
Figure 12.2: Diagram of water waves: the peak of the wave is labeled Crest, the lowest part is labeled Trough, and the Wave height is the distance between the crest and trough. The distance between two successive crests is labeled Wavelength; a horizontal dashed line halfway between the crest and trough is labeled Calm sea level.
Figure 12.3: Cross sectional diagram of sand sloping upward toward the right with shallowing ocean water above; there is a horizontal line between two successive ocean wave crests labeled Wave Length; at the top of the diagram it says “Wave base is the depth to which a passing wave will cause water motion.” There are circular arrows stacked vertically at the wave trough with the largest circle at the top and smaller and smaller circles toward the bottom until there are no more circles; at the bottom of the circular arrows is the label “Wave Base = 1/2 Wave Length.” Along the sloping sand are two labels: on the side dipping below the vertical stack of arrows, the sand is smooth and there is the label “Ocean bottom undisturbed by waves (Lower Shoreface);” on the side dipping upward above the vertical stack of arrows, the sand is rippled and there is the label “Ocean bottom agitated and rippled by waves (Upper Shoreface).”
Figure 12.4: Simple animation of a series of waves moving as a group from left to right.
Figure 12.5: Forward view on top of a ship that’s in dark blue water and there is a high steep wave in front of the ship.
Figure 12.6: Four diagrams of breakers. The top diagram is labeled Spilling and shows waves breaking long and slow, losing its energy as it spills from the crest down the front of the wave. The second diagram is labeled Plunging and shows waves becoming steeper than a spilling breaker and the crest falling as a well-defined curl. The third diagram is labeled Collapsing and shows waves becoming steeper and then the crest collapsing. The fourth diagram is labeled Surging and shows a long wave period, low amplitude wave that doesn’t spill or curl, but instead builds up and then slides rapidly up the beach.
Figure 12.7: Animated gif showing large wavelength, low-amplitude waves in the deep ocean and high-amplitude, low-wavelength waves in the shallow ocean. Frequency decreases with depth.
Figure 12.8: Block diagram of shoreline zones: on land is the Coast; there is gently sloping sand coming from the bases of cliffs along the coast; this includes the labels Beach, Backshore, and Berms; in the shallowest part of the ocean water are the labels Foreshore, Terrace, Surf zone, and Breakers. A line labeled Shoreline points to the contact between the edge of the ocean water and the beach. In deeper water is the label Nearshore and then in the deepest water is the label Offshore. The high tide and low tide line are drawn on the diagram as well, and there is a deposit on the continental slope labeled Bar. Across the entire diagram is the label Littoral zone. The deepest part of the water is about 60 m.
Figure 12.9: Schematic diagram of waves approaching a beach with arrows showing the direction of flow: on the beach, arrows show flow downcurrent onto the sand labeled swash and then straight back out to sea labeled backwash. In the water, arrows show incoming waves approaching the beach at an angle toward the left and downward; the water flows parallel to the beach front down the diagram labeled longshore current.
Figure 12.10: Two parallel jetties extending into the ocean; on the left side of the left jetty is a buildup of sand while the other sides of the jetties do not have the same buildup.
Figure 12.11: Animation of a rip current: as ocean water approaches shore, a narrow current of water, the rip current, rushes outwards between two sandbars into deeper water. The thin part of the rip current is labeled neck and it expands into a plume in deeper water, labeled Head.
Figure 12.12: Photograph of a white rectangular metal sign that says Rip Currents: Break the Grip of the Rip! Below the text is a cartoon drawing of an overhead view of the ocean as seen from the shore with black arrows converging and creating a thin current moving out from the shore to deeper water, with a swimmer at the end of the current. There are green arrows labeled Escape that point parallel to the shoreline in both directions away from the rip current. Near the bottom of the sign is the text: If caught in a rip current: don’t fight the current; swim out of the current, then to shore; if you can’t escape, float or tread water; and if you need help, call or wave for assistance. The very bottom of the sign states: Safety: know how to swim; never swim alone; and if in doubt, don’t go out.
Figure 12.13: The arch is a rock formation in a cove of water with a hole in the middle which allows water to pass through; the surrounding landscape is composed of vertical tan cliffs.
Figure 12.14: People walking along an elongate sand deposit that extends from the mainland out to a large vegetation-covered rock in the ocean.
Figure 12.15: Panoramic view of erosional notches in a brown hillside with a white playa and part of a lake in the foreground.
Figure 12.16: Landsat image of the east coast of the United States, centered on the Chesapeake Bay; there are numerous branching rivers leading to the bay and thing, elongate barrier islands located just off the eastern coast.
Figure 12.17: Generalized map view of a tidal flat with labeled and color-coded features: deep littoral is colored blue and found to the upper left of the diagram; lower littoral (subtidal) is colored cyan and next to the deep littoral zone; littoral (beach) is colored marigold and is a strip alongside the lower littoral zone, however the beach has a gap in it; in the gap of the beach there are tidal bars colored turquoise to match the intertidal label; other turquoise intertidal zones are found inland from the beach; supratidal is colored lime green and surrounds the intertidal zones behind the beach; and continental is colored olive green and surrounds the supratidal zone as well as the areas behind the beach along the edges of the diagram.
Figure 12.18: Satellite image of a brown, barren landscape with a large blue rounded body of water on the land; to the left of that body of water is a deeper blue larger water body, the Caspian Sea.
Figure 12.19: Schematic top-down view of two parallel groins extending perpendicular outward from the shoreline. Sand is built up on beach on the right side of each groin and sand is eroded away from the beach on the left side of each groin.
Figure 12.20: Black and white aerial photo of a series of parallel groins extending perpendicular outward from the shoreline with buildings visible on the mainland; sand is built up on beach on the left side of each groin and sand is eroded away from the beach on the right side of each groin.
Figure 12.21: Black and white aerial photo of a breakwater that was built in shallow ocean water parallel to the shoreline but currently has sand built up from the beach all the way to the structure. Buildings are visible on the mainland.
Figure 12.22: Perspective view looking north over two submarine canyons. The distance across the bottom of the image is about 17 km with a vertical exaggeration of 6x. Newport Canyon is labeled B and is composed of individual channels that braid down the slope over a width of about 9 km. The San Gabriel Canyon is labeled A and begins as a series of channels that join together midway down the slope and then split into two channels at the base of the slope. The width of San Gabriel Canyon about halfway down the slope, labeled C, is 815 m and incises about 25 m into the slope.
Figure 12.23: World map of ocean currents; in the northern hemisphere, large-scale gyres flow in a clockwise pattern in each ocean basin; in the southern hemisphere, large-scale gyres flow in a counterclockwise pattern in each ocean basin. Cool currents are generally found along the west coasts of continents and are blue in color; warm currents are generally found along the east coasts of continents and are red in color; the rest of the currents are black.
Figure 12.24: World map of thermohaline circulation currents in the oceans; deep water formation occurs near the poles and surface currents occur near the equators. In the Atlantic Ocean, a blue deep water current forms in the Arctic and travels south along the west margin of the ocean until it reaches Antarctica and flows toward the east; from Antarctica, a red surface current flows from northward off the west coast of Africa, crossing westward toward the northeast coast of South America, and flows northward along the west margin of the ocean until it reaches the Arctic. In the Pacific Ocean, a blue deep water current forms near Antarctica and travels northwestward through the center of the Pacific Ocean until it becomes a red surface current, loops around in a clockwise direction in the northern Pacific Ocean, and travels westward toward southeast Asia; the red surface current continues westward through southeast Asia until it reaches Madagascar, flows westward around the southern tip of Africa, and joins the red surface current that flows northward along the west margin of the Atlantic Ocean. A blue deep water current flows eastward along the margin of Antarctica.
Figure 12.25: Schematic diagram of the types of tides that occur on Earth as the Moon travels around the Earth; the Sun is to the right-hand side of the diagram. The New Moon occurs when the Moon is located between the Earth and Sun, during which there is a Spring tide; the First Quarter Moon occurs when the Moon travels a quarter of the way counterclockwise around Earth, making a right angle between the Moon, Earth, and Sun, during which there is a Neap tide; the Full Moon occurs when the Moon travels another quarter of the way counterclockwise around Earth, causing the Earth, Moon, and Sun to be in a straight line, during which there is a Spring tide; the Third Quarter Moon travels another quarter of the way counterclockwise around Earth, making a right angle between the Moon, Earth, and Sun, during which there is a Neap tide.
Figure 12.26: Three graphs with tidal height along the vertical axis and time along the horizontal axis. The first graph shows semidiurnal tide, during which tides go through two complete cycles in each tidal day, with the tidal range varying slightly in each cycle. The second graph shows mixed tide, during which tides go through a combination of diurnal and semidiurnal patterns and show two tidal cycles per tidal day, but the relative amplitudes of each cycle and their highs and lows vary during the tidal month. The third graph shows diurnal tide, during which tides go through one complete cycle each tidal day with similar tidal ranges.
Figure 12.27: World map showing the three tidal types along the coasts: Semidiurnal tides are colored green, Diurnal tides are yellow, and Mixed tides are red. Semidiurnal tides are found along the east coast of the United States and Canada, the west coast of central America, the northwest coast of South America, the east and southeast coasts of South America, most of the European coasts with the exception of the northern Mediterranean coast, most of the African coasts with the exception of the horn of Africa, northern and southeastern Asia, northwestern and southeastern Australia, and New Zealand. Diurnal tides are found along the west coast of Alaska, the Gulf of Mexico, northeast Asia, southeast Asia, southwest Australia, and northwest Antarctica. Mixed tides are found along the west coast of North America, the Caribbean, northern South America, southwestern and southeastern South America, the northern Mediterranean, eastern Madagascar, the horn of Africa and northeast Africa, south-central Asia, southeast and east Asia, and northwestern, northeastern, and southern Australia.
Figure 12.28: GIF animation showing Earth rotating on a 24-hour cycle, the Moon revolving around Earth at a much slower rate, and tides at a shoreline fluctuating as a result. High tides and low tides each occur twice during one revolution of the Moon: low tides occur when the Earth, Moon, and Sun make a right angle with each other while high tides occur when the Earth, Moon, and Sun are in alignment. Because the Moon is revolving around Earth, a tidal day lasts slightly longer than 24 hours.
Figure 12.29: Diagram showing concentration of salt within seawater; it’s 96.5% water and 3.5% salt. There is a pop-out diagram showing the concentrations of various salt ions within the seawater; the composition of the total salt component is: 55% chloride, 30.6% sodium, 7.7% sulfate, 3.7% magnesium , 1.2% calcium, 1.1% potassium, and 0.7% minor constituents.
Figure 12.30: A graph with temperatures in Celsius increasing toward the right along the x-axis, from 0 to 24 degrees. Depth in meters increases downward along the y-axis, from 0 to 7,000. A curve on the graph goes from 0 meters depth and 24 degrees Celsius downward and abruptly moves toward the left at approximately 100 meters depth until it reaches 6 degrees Celsius and 1000 meters depth; from there it changes to nearly vertical downward.
Figure 12.31: A unitless graph with density increasing toward the right along the x-axis and depth increasing downward along the y-axis. A curve on the graph goes from 0 depth and low density straight down until it abruptly moves toward the right at still shallow depth; after it reaches a deeper depth, it changes to nearly vertical downward.
Figure 12.32: Cross section of the ocean from 60 degrees North latitude on the left, 0 degrees latitude in the middle, and 60 degrees South latitude on the right. There are three colored areas within the ocean: a dark teal zone labeled the deep zone that takes up 80% of the filled-in area. This zone makes up the entire bottom of the ocean until the transition zone above, which is colored medium teal and takes up 18% of the area in the figure. Above the transition zone is a small light blue lens labeled surface mixed zone which takes up 2% of the area.
Figure 12.33: World map with a black loop running across the Pacific Ocean from west to east, traveling south of the tip of South America, then north through the Atlantic Ocean. When the line reaches the mid-North Atlantic, it curves back down off the west coast of Europe and then Africa, traveling southwest to the eastern coast of South America and then traveling toward the east where it passes south of Africa then south of Australia. It then turns back westward and travels among southeast Asian islands before continuing east across the Pacific where the loop is completed. A separate smaller red loop is shown circling around the north Atlantic Ocean.
Figure 12.34: Simple diagram showing a red and white boat on the surface of the ocean with a blue bar labeled transducer at the bottom of the boat. Two purple arrows go between the boat and ocean floor, labeled transmitted and returned acoustic pulse. The first arrow travels vertically down to the ocean floor from the boat and the second arrow points up from the ocean floor to the boat, labeled capital D. The diagram states Measured depth is function of: pulse travel time (t) and pulse velocity in water (v). Beneath the text is the following equation: D = 1/2*v*t
Figure 12.35: Diagram showing a GPS satellite receiving a signal from an altimeter device in low orbit above the ocean. There are three white dashed lines that travel from the altimeter to the surface: one travels vertically down to the ocean surface and the other two travel down to the surface of an island, labeled Laser station and Doris station.
Figure 12.36: Map of the North Atlantic Ocean with a black line drawn from northeast North America to West Africa. Along the line are five labels: at the edge of North America is the continental margin, toward the deeper ocean is the deep ocean basin, and in the middle of the ocean is the mid-ocean ridge. Continuing along the line there is another deep ocean basin east of the mid-ocean ridge and then another continental margin off the west coast of Africa.
Figure 12.37: Cross sectional diagram of black oceanic crust on the left transitioning to orange continental crust on the right, with olive green mantle beneath both. Above both the oceanic and continental crust is a yellow layer labeled sediment, and there is blue ocean water above that. Deep ocean is on the left, and it gets shallower toward the right as the sediment slopes upward. The continental rise is labeled where deep ocean water begins to get shallower, the continental slope is labeled where there’s a steeper slope to the right of the rise, and the continental shelf is labeled where the slope of sediment flattens out again beneath shallow ocean water.
Figure 12.38: Block diagram showing tan oceanic lithosphere beneath the ocean on the left traveling toward the right and then sloping downward into the orange asthenosphere when it reaches continental crust on the right. Above the sloping lithosphere are red dashes moving vertically upward toward a volcano on the overriding continental crust, where there is a volcanic arc. Just off the coast of the continental crust is a deep groove at the bottom of the ocean labeled trench.
Figure 12.39: Depth map of Mariana Trench. Japan is labeled near the top of the map, colored light green to indicate above sea level; Indonesia and Papua New Guinea are labeled near the bottom of the map, all colored light green to indicate elevation above sea level reaching nearly 4,000 meters. Nearly vertical with a slight arch is the Mariana Trench at the center of the map. colored dark blue to indicate depth below sea level reaching over 10,000 meters deep. The Challenger Deep location is marked with a pink star near the southern part of the Mariana Trench.
Figure 12.40: Gray and white world map with interconnected red hatched lines marking the location of mid-ocean ridges. The lines are connected as follows: one line travels north to south through the Atlantic Ocean, connecting to a northeast-trending line south of Africa, connecting to a north to south line east of Africa and south of Asia, then traveling toward the east, south of Australia. The line continues east until it curves toward the north when it reaches west of South America. The north-trending line continues until it reaches the west coast of North America.
The scientific study of oceans.
Bottommost part of a wave.
Top of a wave.
The distance between the crest and trough of a wave; equal to twice the amplitude.
Speed at which a wave travels past a fixed point.
The time between similar parts of a wave passing a fixed point.
The depth reached by normal, nonstorm waves.
The depth that waves can reach in large storms, such as hurricanes.
Distance wind has been building a wave.
A series of waves that form and move as a group.
A wave that is large, unexpected, and dangerous.
Referring to the part of the coastline below any wave base action.
Dense flow of sediment through submarine canyons that forms submarine fans and turbidites.
Shore area between low tide and storm wave base, with the upper part dominated by fair-weather wave base and the lower dominated by storm wave base.
Part of the coastal depositional environment, located near the tidal zone but below. Lower shoreface is the part of the coastline which is only disturbed by storm waves; upper shoreface is disturbed by typical daily wave action.
Shoreline area of breaking waves.
Area between high tide and low tide.
Active area of crashing waves.
Ridge of sand built above the beach face.
Lower, seaward berm that forms with lower wave energy in summer months.
Higher, landward berm that forms with higher-wave energy in winter months.
Area of the shoreline that is always entirely above normal wave action.
A net movement that occurs when waves intersect the shoreline at nonperpendicular angles.
Sediment that moves via a longshore current.
A ridge of sediment that extends out into a body of water, formed via longshore currents.
A bar formed when a spit extends outward and covers a bay.
Artificial device (typically a wall of concrete or rocks) placed to stop or slow longshore drift.
Currents that push seaward.
An exposed coastline where relative sea level is falling.
Area of coast where relative sea level is rising.
An offshore rock spire that is a remnant of a rock layer.
Sand bar that connects a stack and the shore.
Flat erosional surface cut by wave action.
Erosional notch in bedrock cut by waves.
Glacial valley filled by ocean water.
Water that is a mixture of sea water and fresh water.
Lagoon with brackish water, typically with abundant biologic factors.
A hard stabilization structure built perpendicular to the shoreline to help control longshore drift.
Durable offshore structure designed to lessen wave action and reduce longshore drift.
Large, circular ocean currents formed by global atmospheric circulation patters.
A connected global ocean circulation pattern that distributes water and heat around the globe.
Highest high tide of the month.
Lowest low tide of the month.
Areas that have one clear high tide and one clear low tide each tidal day.
The amount of time the Moon takes to reappear over the same location of Earth, slightly more than 24 hours.
Location with two unequal tide cycles per tidal day.
Areas with an irregular sequence of tides over the course of a month.
The measurement of depth of water in oceans, seas, or lakes.
A gravitational effect that stretches a body along the line toward and away from the center of mass of another body due to spatial variations in gravitational field strength from the other body.
The process by which the Earth's rotation is slowed down by the friction of ocean tides.
A logarithmic scale that measures the acidity or alkalinity of an aqueous solution. It ranges from 0 to 14, with 7 being neutral.
A distinct layer in a body of water where the temperature changes more rapidly with depth than it does in the layers above or below.
A layer in a body of water where the water density increases more rapidly with depth compared to the layers above and below.
A large, elevated, flat area on the ocean floor with steep edges, formed by extensive outpourings of basaltic lava.
A former Pearl-class corvette of the Royal Navy that was picked to undertake the first global marine research expedition: the Challenger expedition.
An acronym for "sound navigation and ranging," sonar uses sound waves to navigate and map surfaces. Sound waves created by an observer reflect off of surfaces and return to the observer; the amount of time it takes for the sound to return is a function of the distance the surface is from the observer. Bats use sonar to navigate through the dark, and ships use sonar to map the ocean floor.
A system that applies sonar technology to measure the depth of water.
An instrument used to measure the altitude of an object above a fixed level.
A form of electromagnetic radiation with wavelengths shorter than other radio waves but longer than infrared waves, ranging from about one millimeter to about one meter.
The transition from land to the deep ocean, where continental crust gives way to oceanic crust.
A boundary between continental and oceanic plates that has no relative movement; despite being a place where an oceanic plate is connected to a continental plate, it is not a plate boundary.
A convergent boundary between continental and oceanic plates.
Relatively flat ocean floor that accumulates very fine-grained detrital and chemical sediments.
