14 Meteorology
Learning Objectives
By the end of this chapter, students should be able to:
- Understand the structure and composition of the atmosphere.
- Explain how energy travels through Earth’s atmosphere.
- Describe the various aspects and elements of weather, including atmospheric water, air masses, and weather fronts.
- List the various physical controls on weather.
- Understand the causes and effects of severe weather events including thunderstorms, tornadoes, hurricanes, blizzards, and heat waves.
If someone across the country asks you what the weather is like today, you need to consider several factors. Air temperature, humidity, wind speed, the amount and types of clouds, and precipitation are all part of a thorough weather report. It’s also important to consider the difference between weather and climate.
Weather is what is going on in the atmosphere at a particular place at a particular time. Weather is the change we experience from day to day. Weather can change rapidly. A location’s weather depends on air temperature, air pressure, fog, humidity, cloud cover, precipitation, and wind speed and direction. All of these are directly related to the amount of energy that is in the system and where that energy is. The ultimate source of this energy is the Sun. As defined by the National Oceanic and Atmospheric Administration (NOAA), meteorology is the science concerned with the Earth’s atmosphere and its physical processes. A meteorologist is a physical scientist who observes, studies, or forecasts the weather.
Climate is the average of a region’s weather over time. The climate for a particular place is steady and changes only very slowly. Climate is determined by many factors, including the angle of the Sun, the likelihood of cloud cover, topography, and air pressure. These factors are related to the amount of solar energy and precipitation that a region experiences over time. Climate is the long-term average of weather in a particular spot. Although the weather for a particular winter day in Tucson, Arizona, may include snow, the climate of Tucson is generally warm and dry. The next chapter, Global Climate Change, describes the Earth systems involved in climate change, the geologic evidence of past climate changes, and the human role in today’s climate change.
14.1 The Atmosphere
Earth’s atmosphere is a thin blanket of gases and tiny particles—together called air. We are most aware of air when it moves and creates wind. All living things need some of the gases in air for life support. Without an atmosphere, Earth would likely be just another lifeless rock. Earth’s atmosphere, along with the abundant liquid water at Earth’s surface, are the keys to our planet’s unique place in the Solar System. Much of what makes Earth exceptional depends on the atmosphere. Let’s consider some of the reasons we are lucky to have an atmosphere.
Without the atmosphere, Earth would look a lot more like the Moon. Atmospheric gases, especially carbon dioxide (CO2) and oxygen (O2), are extremely important for living organisms. In photosynthesis, plants use CO2 and create O2. Photosynthesis is responsible for nearly all of the oxygen currently found in the atmosphere. By creating oxygen and food, plants have made an environment that is favorable for animals. In respiration, animals use oxygen to convert sugar into food energy they can use. Plants also go through respiration and consume some of the sugars they produce.
The relationship between the atmosphere and water vapor is a crucial part of the hydrologic cycle. Water spends a lot of time in the atmosphere, mostly as water vapor. All weather takes place in the atmosphere, and virtually all of it happens in the lower atmosphere. The amount of water vapor present in different areas of the planet has a dynamic effect on the weather that occurs in different areas. Areas that are prone to regularly occurring water-rich storms have quite different ecosystems than drier areas that receive less moisture. Species are adapted to the conditions in which they live. Drier areas may have species of plants and animals that have strategies that allow them to thrive, whereas more temperate areas with more moisture have species that would not fare as well in drier climates. Thus, life depends on the climate and weather that occur in the zones in which life occurs.
Ozone is a molecule composed of three oxygen atoms (O3). Ozone in the upper atmosphere absorbs high-energy ultraviolet (UV) radiation coming from the Sun. This protects living things on Earth’s surface from the Sun’s most harmful rays. Without ozone for protection, only the simplest life forms would be able to live on Earth. Along with the oceans, the atmosphere keeps Earth’s temperatures within an acceptable range. Greenhouse gases trap heat in the atmosphere, so they help to moderate global temperatures. Without an atmosphere with greenhouse gases, Earth’s temperatures would be frigid at night and scorching during the day. Important greenhouse gases include carbon dioxide, methane, water vapor, and ozone.
14.1.1 Atmospheric Gases
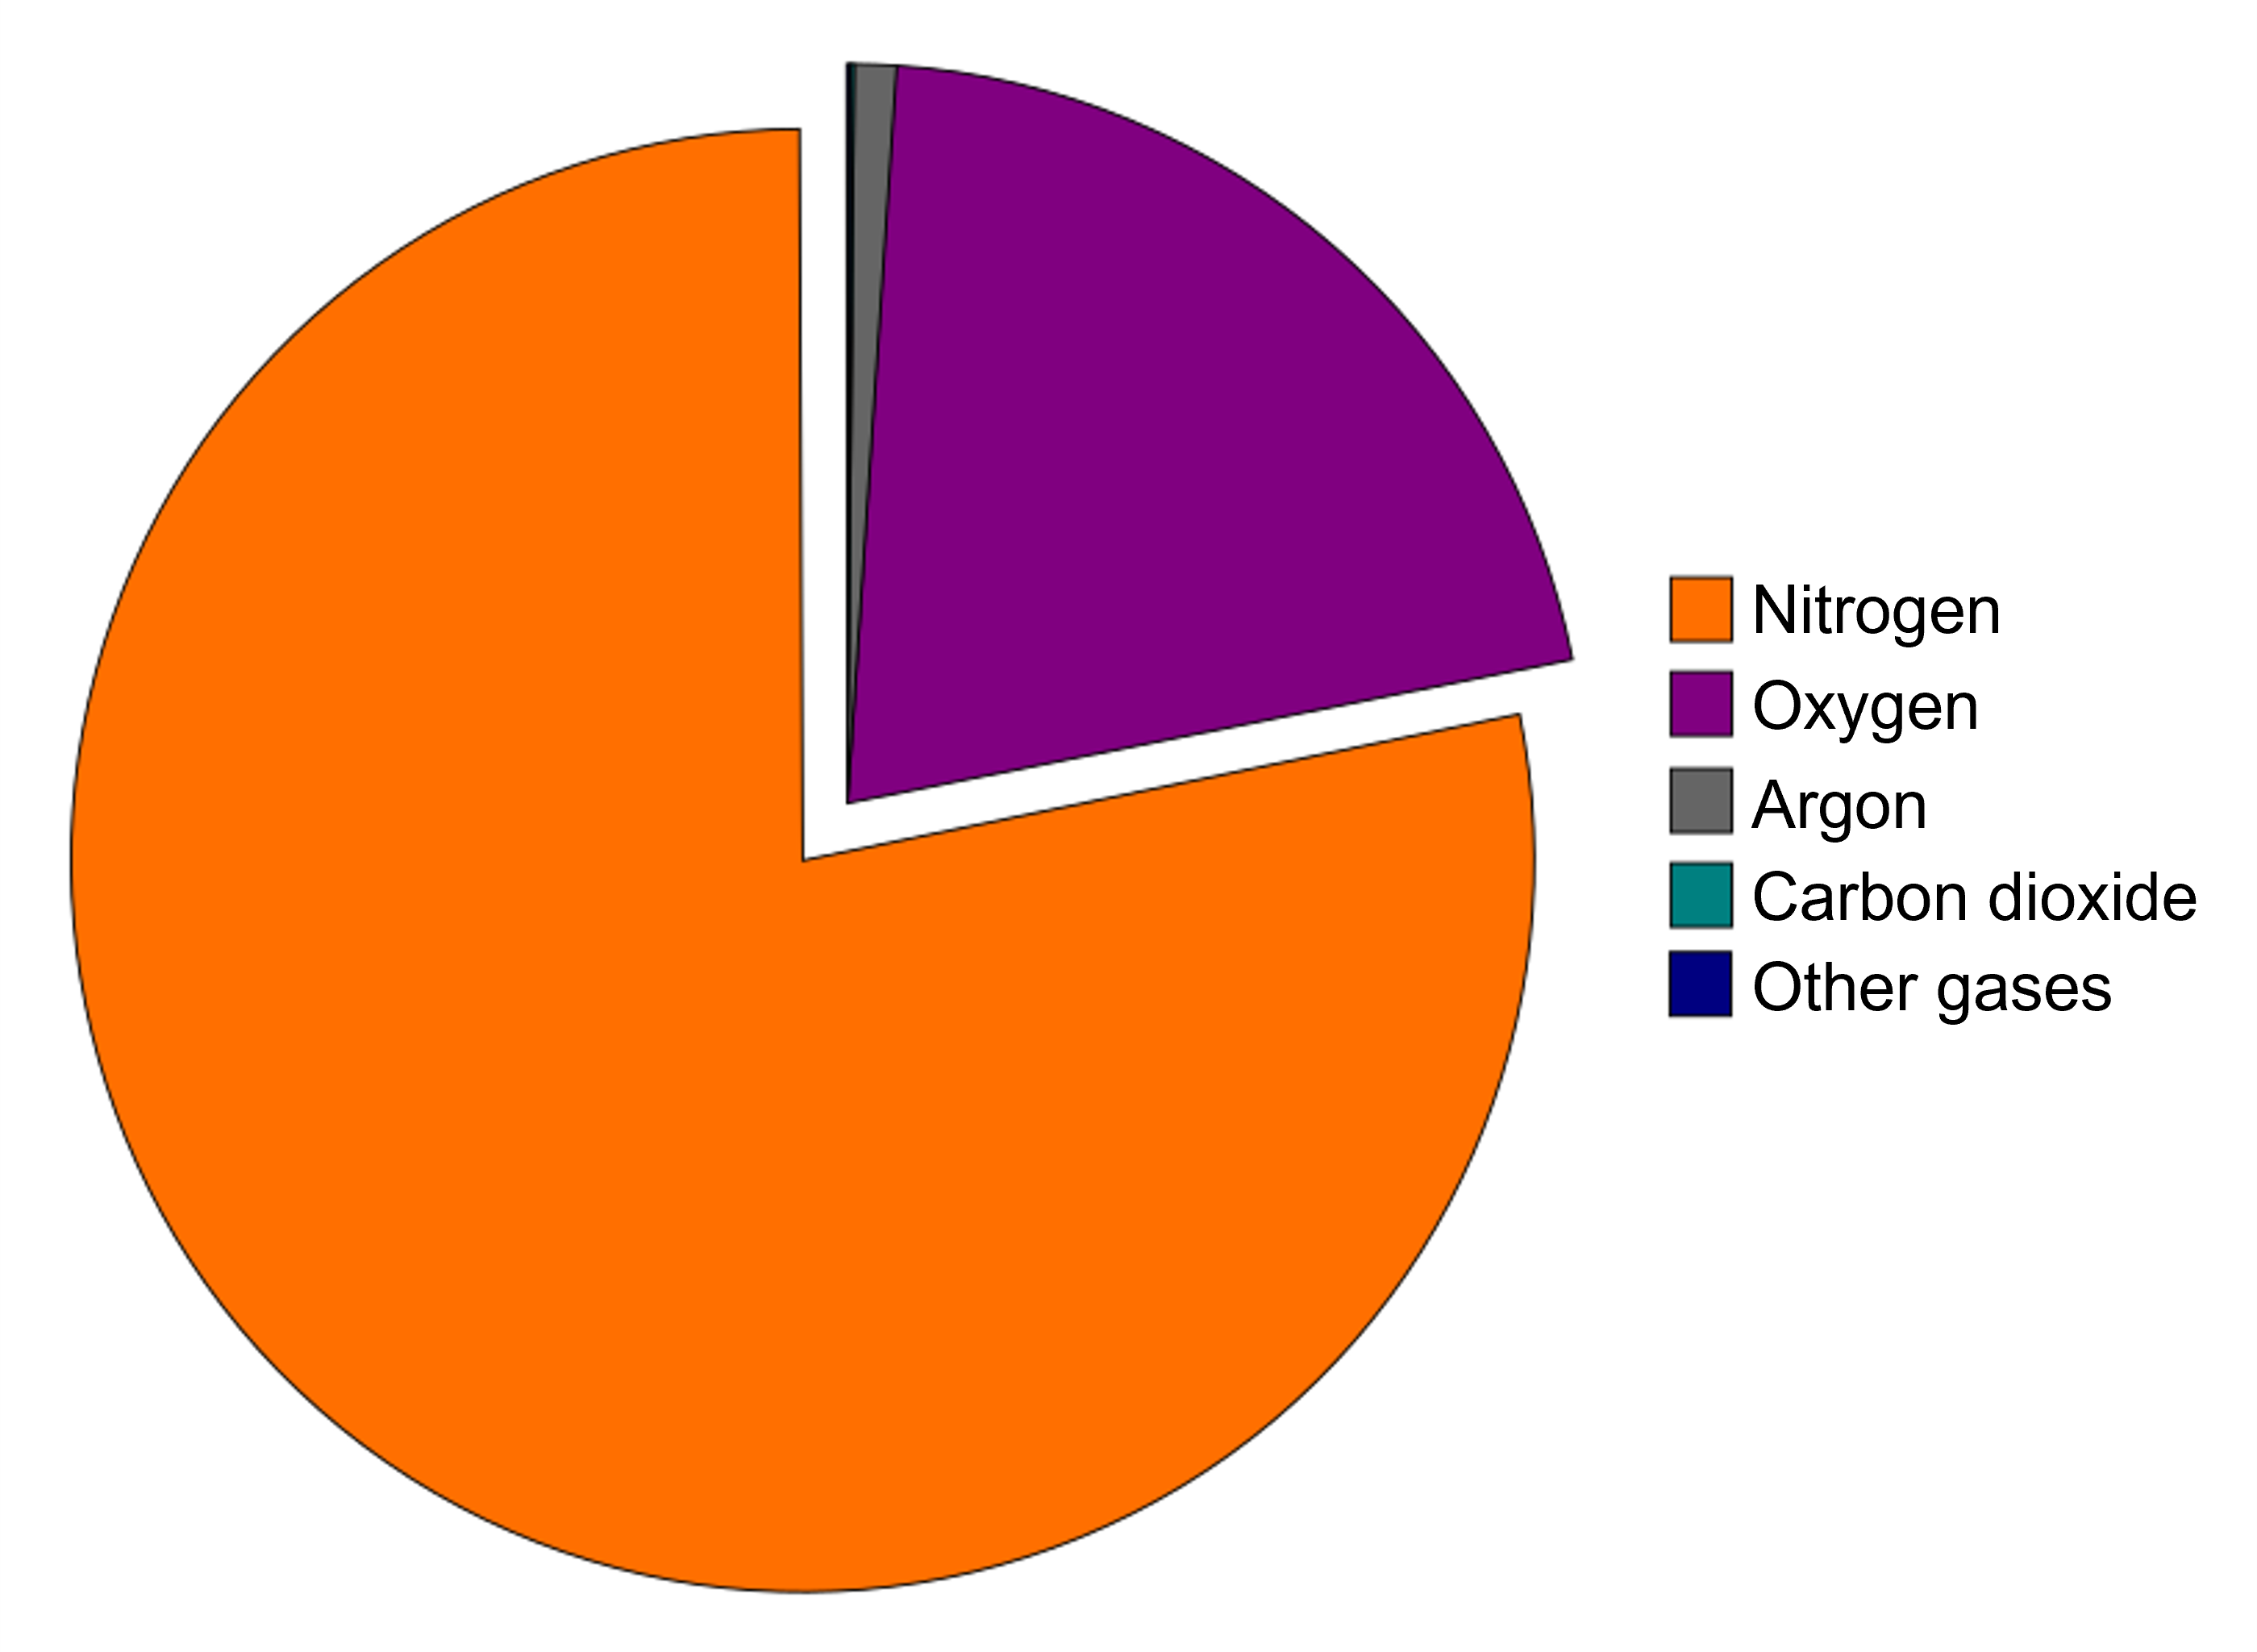
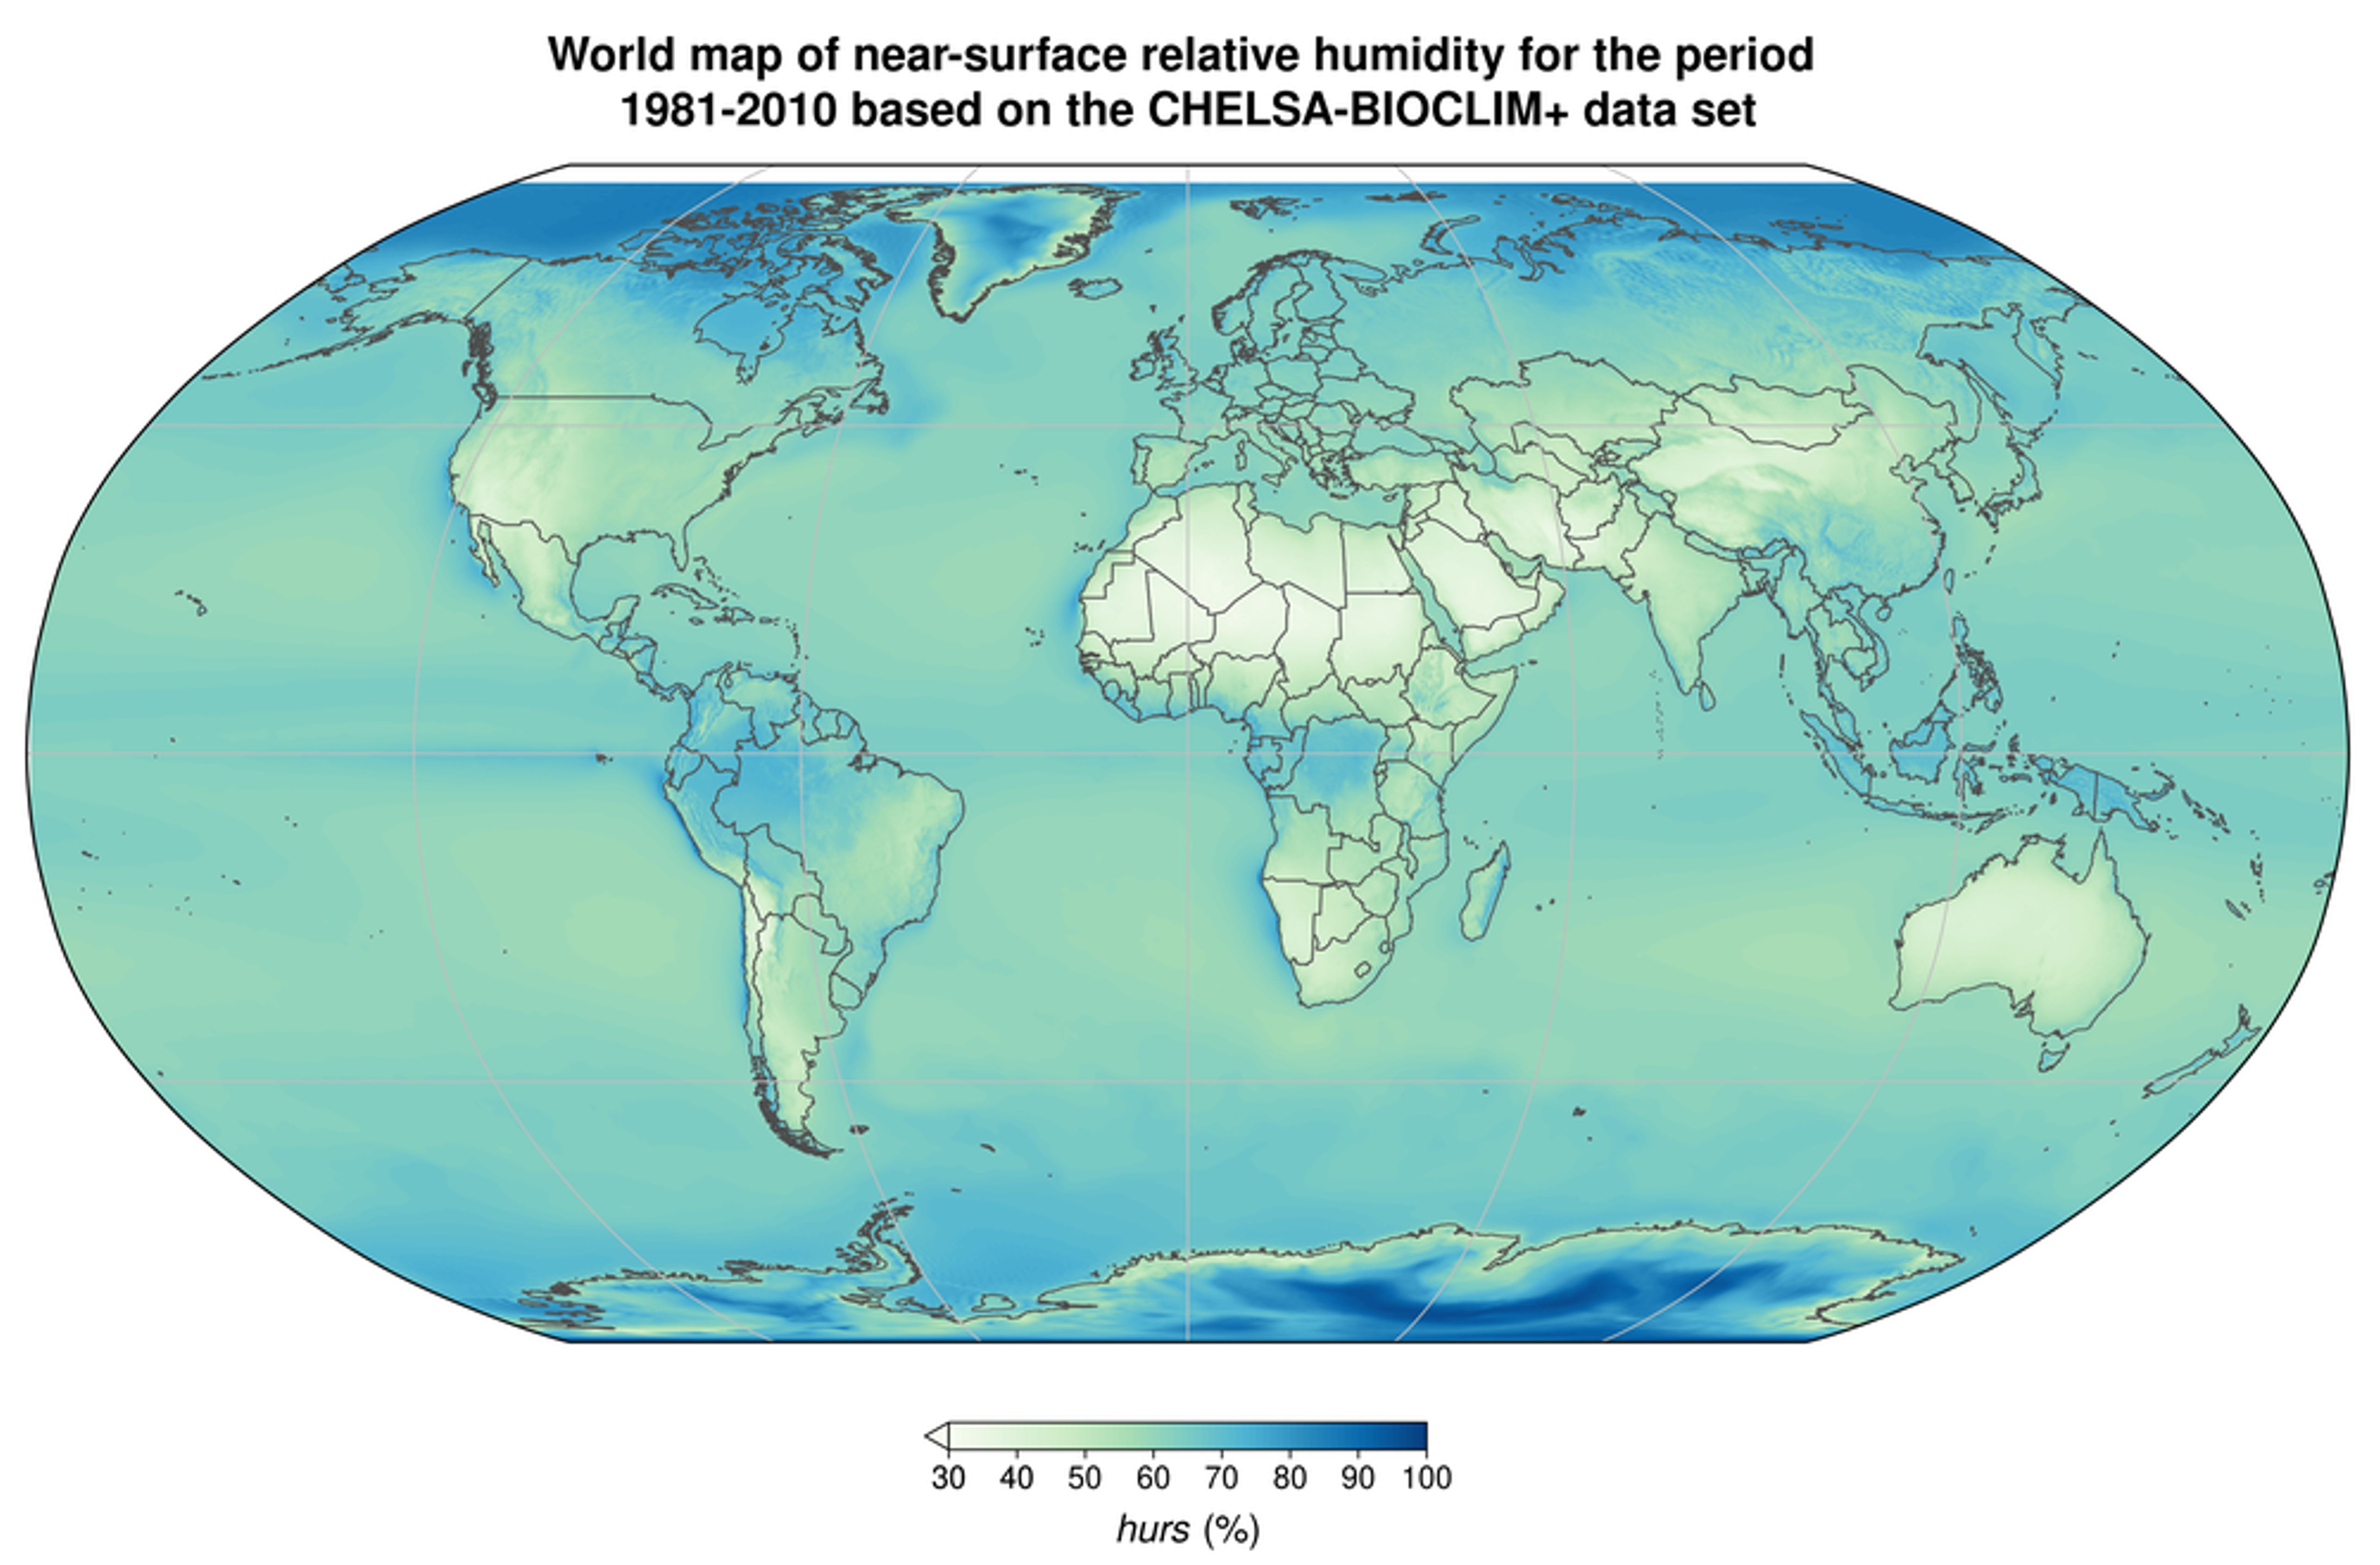
Nitrogen and oxygen together make up 99 percent of the planet’s atmosphere. The rest of the gases are minor components but sometimes are very important. Humidity is the amount of water vapor in the air. Humidity varies from place to place and season to season. This fact is obvious if you compare a summer day in Atlanta, Georgia, where humidity is high, with a winter day in Phoenix, Arizona, where humidity is low. When the air is very humid, it feels heavy or sticky. Dry air usually feels more comfortable. Higher humidity is found around the equatorial regions because air temperatures are higher and warm air can hold more moisture than cooler air. Of course, humidity is lower near the polar regions because air temperature is lower.
Some of what is in the atmosphere is not gas. Particles of dust, soil, fecal matter, metals, salt, smoke, ash, and other solids make up a small percentage of the atmosphere. Particles provide starting points (or nuclei) for water vapor to condense on and form raindrops, and some particles are pollutants.
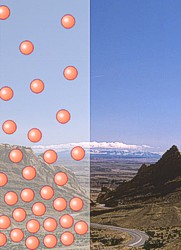
The atmosphere has different properties at different elevations above sea level, or altitudes. The air density (the number of molecules in a given volume) decreases with increasing altitude. This is why people who climb tall mountains, such as Mount Everest, have to set up camp at different elevations to let their bodies get used to the decreased air density.
Why does air density decrease with altitude? Gravity pulls the gas molecules toward Earth’s center. The pull of gravity is stronger at sea level due to being closer to the center of the Earth than at higher altitudes. Air is denser at sea level where the gravitational pull is greater. Gases at sea level are also compressed by the weight of the atmosphere above them. The force of the air weighing down over a unit of area is known as its atmospheric pressure. The reason why we are not crushed by this weight is because the molecules inside our bodies are pushing outward to compensate. Atmospheric pressure is felt from all directions, not just from above.
At higher altitudes, the atmospheric pressure is lower and the air is less dense than at higher altitudes. If your ears have ever “popped,” you have experienced a change in air pressure. Gas molecules are found inside and outside your ears. When you change altitude quickly, like when an airplane is descending, your inner ear keeps the density of molecules at the original altitude. Eventually the air molecules inside your ear suddenly move through a small tube in your ear to equalize the pressure. This sudden rush of air is felt as a popping sensation.
Although the density of the atmosphere changes with altitude, the composition stays the same with altitude, with one exception. In the ozone layer, at about 20 km to 40 km above the surface, there is a greater concentration of ozone molecules than in other portions of the atmosphere.
14.1.2 Layers of the Atmosphere
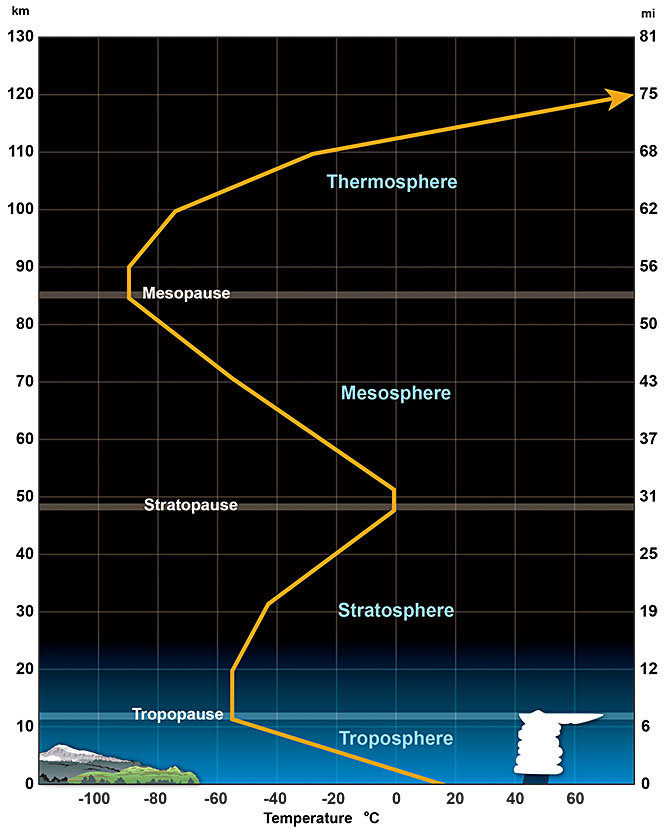
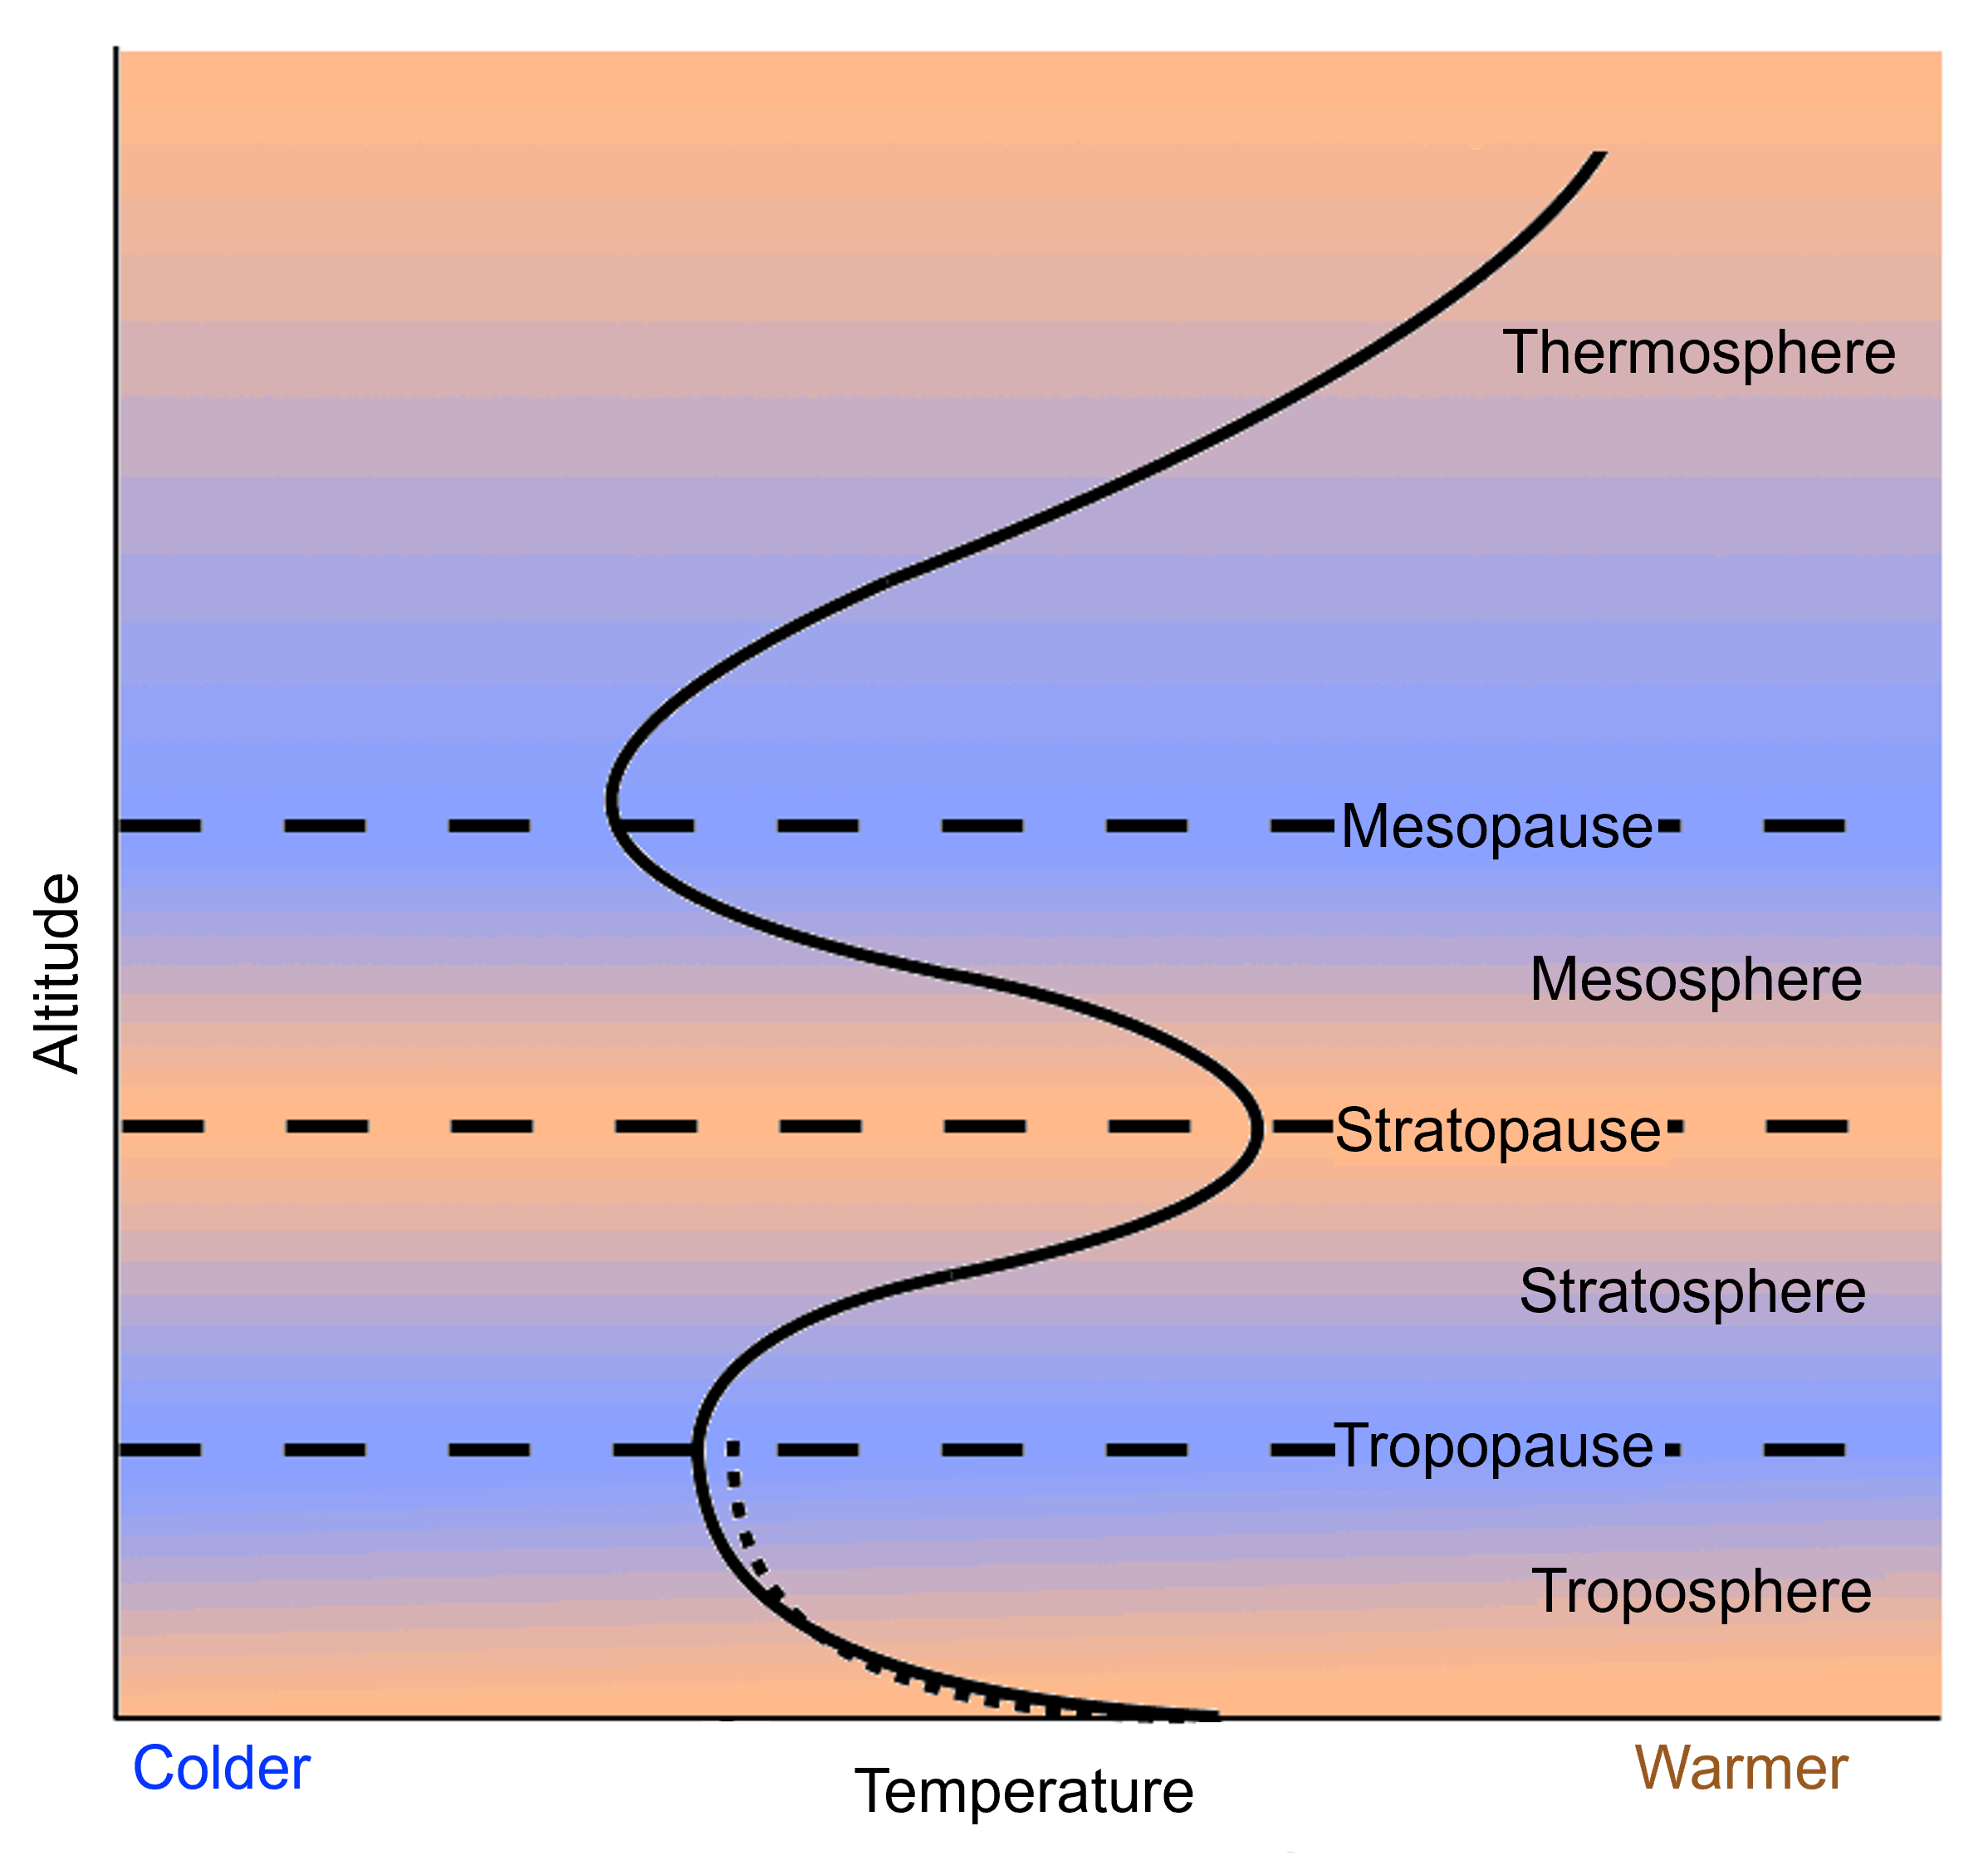
The atmosphere’s layers correspond with how the atmosphere’s temperature changes with altitude. By understanding the way temperature changes with altitude, we can learn a lot about how the atmosphere works. While weather takes place in the lower atmosphere, interesting things, such as the aurora, happen higher in the atmosphere.
Warm air rises because gas molecules are able to move freely in the atmosphere. When gas molecules are warm, they move vigorously and take up more space. When gas molecules are cool, they are sluggish and do not take up as much space. With the same number of molecules in less space, both air density and air pressure are higher. Warmer, lighter air is more buoyant than the cooler air above it, so it rises. The cooler air then sinks down because it is denser than the air beneath it. This is the process of convection.
The property that changes most strikingly with altitude is air temperature. Unlike the change in pressure and density, which decrease with altitude, changes in air temperature are not regular. A change in temperature with distance is called a temperature gradient. The atmosphere is divided into layers based on how the temperature in that layer changes with altitude, which is known as the layer’s temperature gradient. In some layers, temperature increases with altitude, and in others it decreases. The temperature gradient in each layer is determined by the heat source of the layer. Most of the important processes of the atmosphere take place in the lowest two layers: the troposphere and the stratosphere.
The temperature of the troposphere is highest near the surface of the Earth and decreases with altitude. On average, the temperature gradient of the troposphere is 6.5°C per 1,000 m (3.6°F per 1,000 ft) of altitude. Earth’s surface is a major source of heat for the troposphere, although nearly all of that heat comes from the Sun. Rock, soil, and water on Earth absorb the Sun’s light and radiate it back into the atmosphere as heat. The temperature is also higher near the surface because of the greater density of gases. In the troposphere, warmer air is beneath cooler air, a condition that is unstable. The warm air near the surface rises while cool air higher in the troposphere sinks, resulting in mixing. This mixing causes the temperature gradient to vary with time and place. The rising and sinking of air in the troposphere also means that nearly all of the planet’s weather takes place in the troposphere.
14.1.3 Atmospheric Energy, Temperature, and Heat
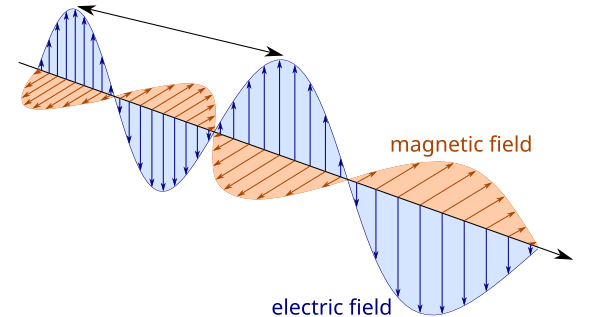
Energy travels through space or material. This is obvious when you stand near a fire and feel its warmth or when you feel heat in the handle of a metal pot even though the handle is not sitting directly on the hot stove. Invisible energy waves can travel through air, glass, and even the vacuum of outer space. These waves have electrical and magnetic properties, so they are called electromagnetic waves. The transfer of energy from one object to another through electromagnetic waves is known as radiation. Different wavelengths of energy create different types of electromagnetic waves.
The wavelengths humans can see are known as visible light. These wavelengths appear to us as the colors of the rainbow. The longest wavelengths of visible light appear red. Infrared wavelengths are longer than visible red. We feel infrared energy as heat. Wavelengths that are shorter than violet are called ultraviolet.
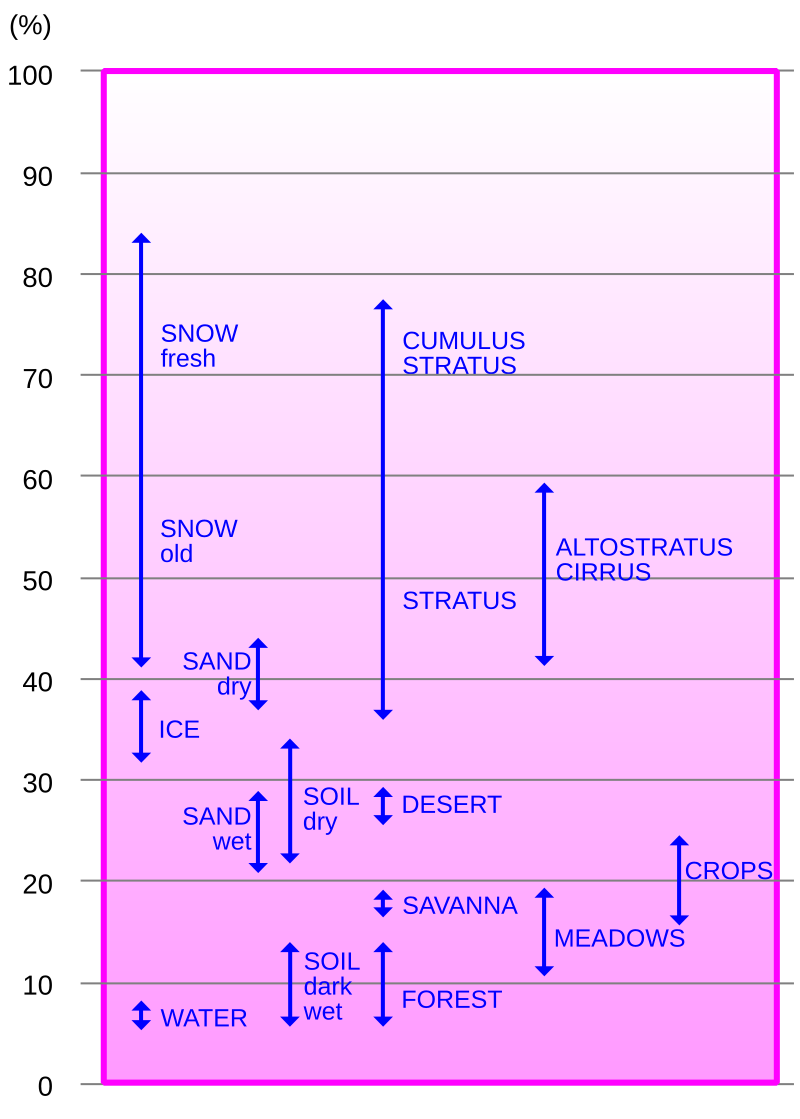
Reflection is when light (or another wave) bounces back from a surface. Albedo is a measure of how well a surface reflects light. A surface with high albedo, for example a snow field, reflects a large percentage of light. One important fact to remember is that energy cannot be created or destroyed; it can only be changed from one form to another. This is such a fundamental fact of nature that it is a law: the law of conservation of energy. In photosynthesis, for example, plants convert solar energy into chemical energy that they can use. They do not create new energy. When energy is transformed, some nearly always becomes heat. Heat transfers from warmer objects to cooler ones easily. If no more heat is added, eventually all of a material will reach the same temperature.
Temperature is a measure of how fast the atoms in a material are vibrating. High temperature particles vibrate faster than low temperature particles. Rapidly vibrating atoms smash together, which generates heat. As a material cools down, the atoms vibrate more slowly and collide less frequently. As a result, they emit less heat. Temperature measures how fast a material’s atoms are vibrating, while heat measures the material’s total energy.
Heat is taken in or released when an object changes state, changing from a gas to a liquid or a liquid to a solid. This heat is called latent heat. When a substance changes state, latent heat is released or absorbed. A substance changing its state of matter does not change temperature. All of the energy that is released or absorbed goes toward changing the material’s state. Substances also differ in their specific heat, which is the amount of energy needed to raise the temperature of one gram of the material by 1°C (1.8°F). Water has a very high specific heat, which means it takes a lot of energy to change the temperature of water.
14.1.4 Energy from the Sun
The Earth constantly tries to maintain an energy balance with the atmosphere. Most of the energy that reaches the Earth’s surface comes from the Sun. About 44% of solar radiation is in the visible light wavelengths, but the Sun also emits infrared, ultraviolet, and other wavelengths. When viewed together, all of the wavelengths of visible light appear white. Of the solar energy that reaches the outer atmosphere, UV wavelengths have the greatest energy. Only about 7% of solar radiation is in the UV wavelengths. The remaining solar radiation is the longest wavelength, infrared. Most objects radiate infrared energy, which we feel as heat.
Heat moves in the atmosphere the same way it moves through the solid Earth or another medium. Radiation is the transfer of energy between two objects by electromagnetic waves. Heat radiates from the ground into the lower atmosphere. In conduction, heat moves from areas of more heat to areas of less heat by direct contact. Warmer molecules vibrate rapidly and collide with other nearby molecules, transferring their energy. In the atmosphere, conduction is more effective at lower altitudes, where air density is higher; this transfers heat upward to where the molecules are spread farther apart or transfers heat laterally from warmer to cooler spots, where the molecules move less vigorously. Heat transfer by movement of heated materials is called convection. Heat that radiates from the ground initiates convection cells in the atmosphere.
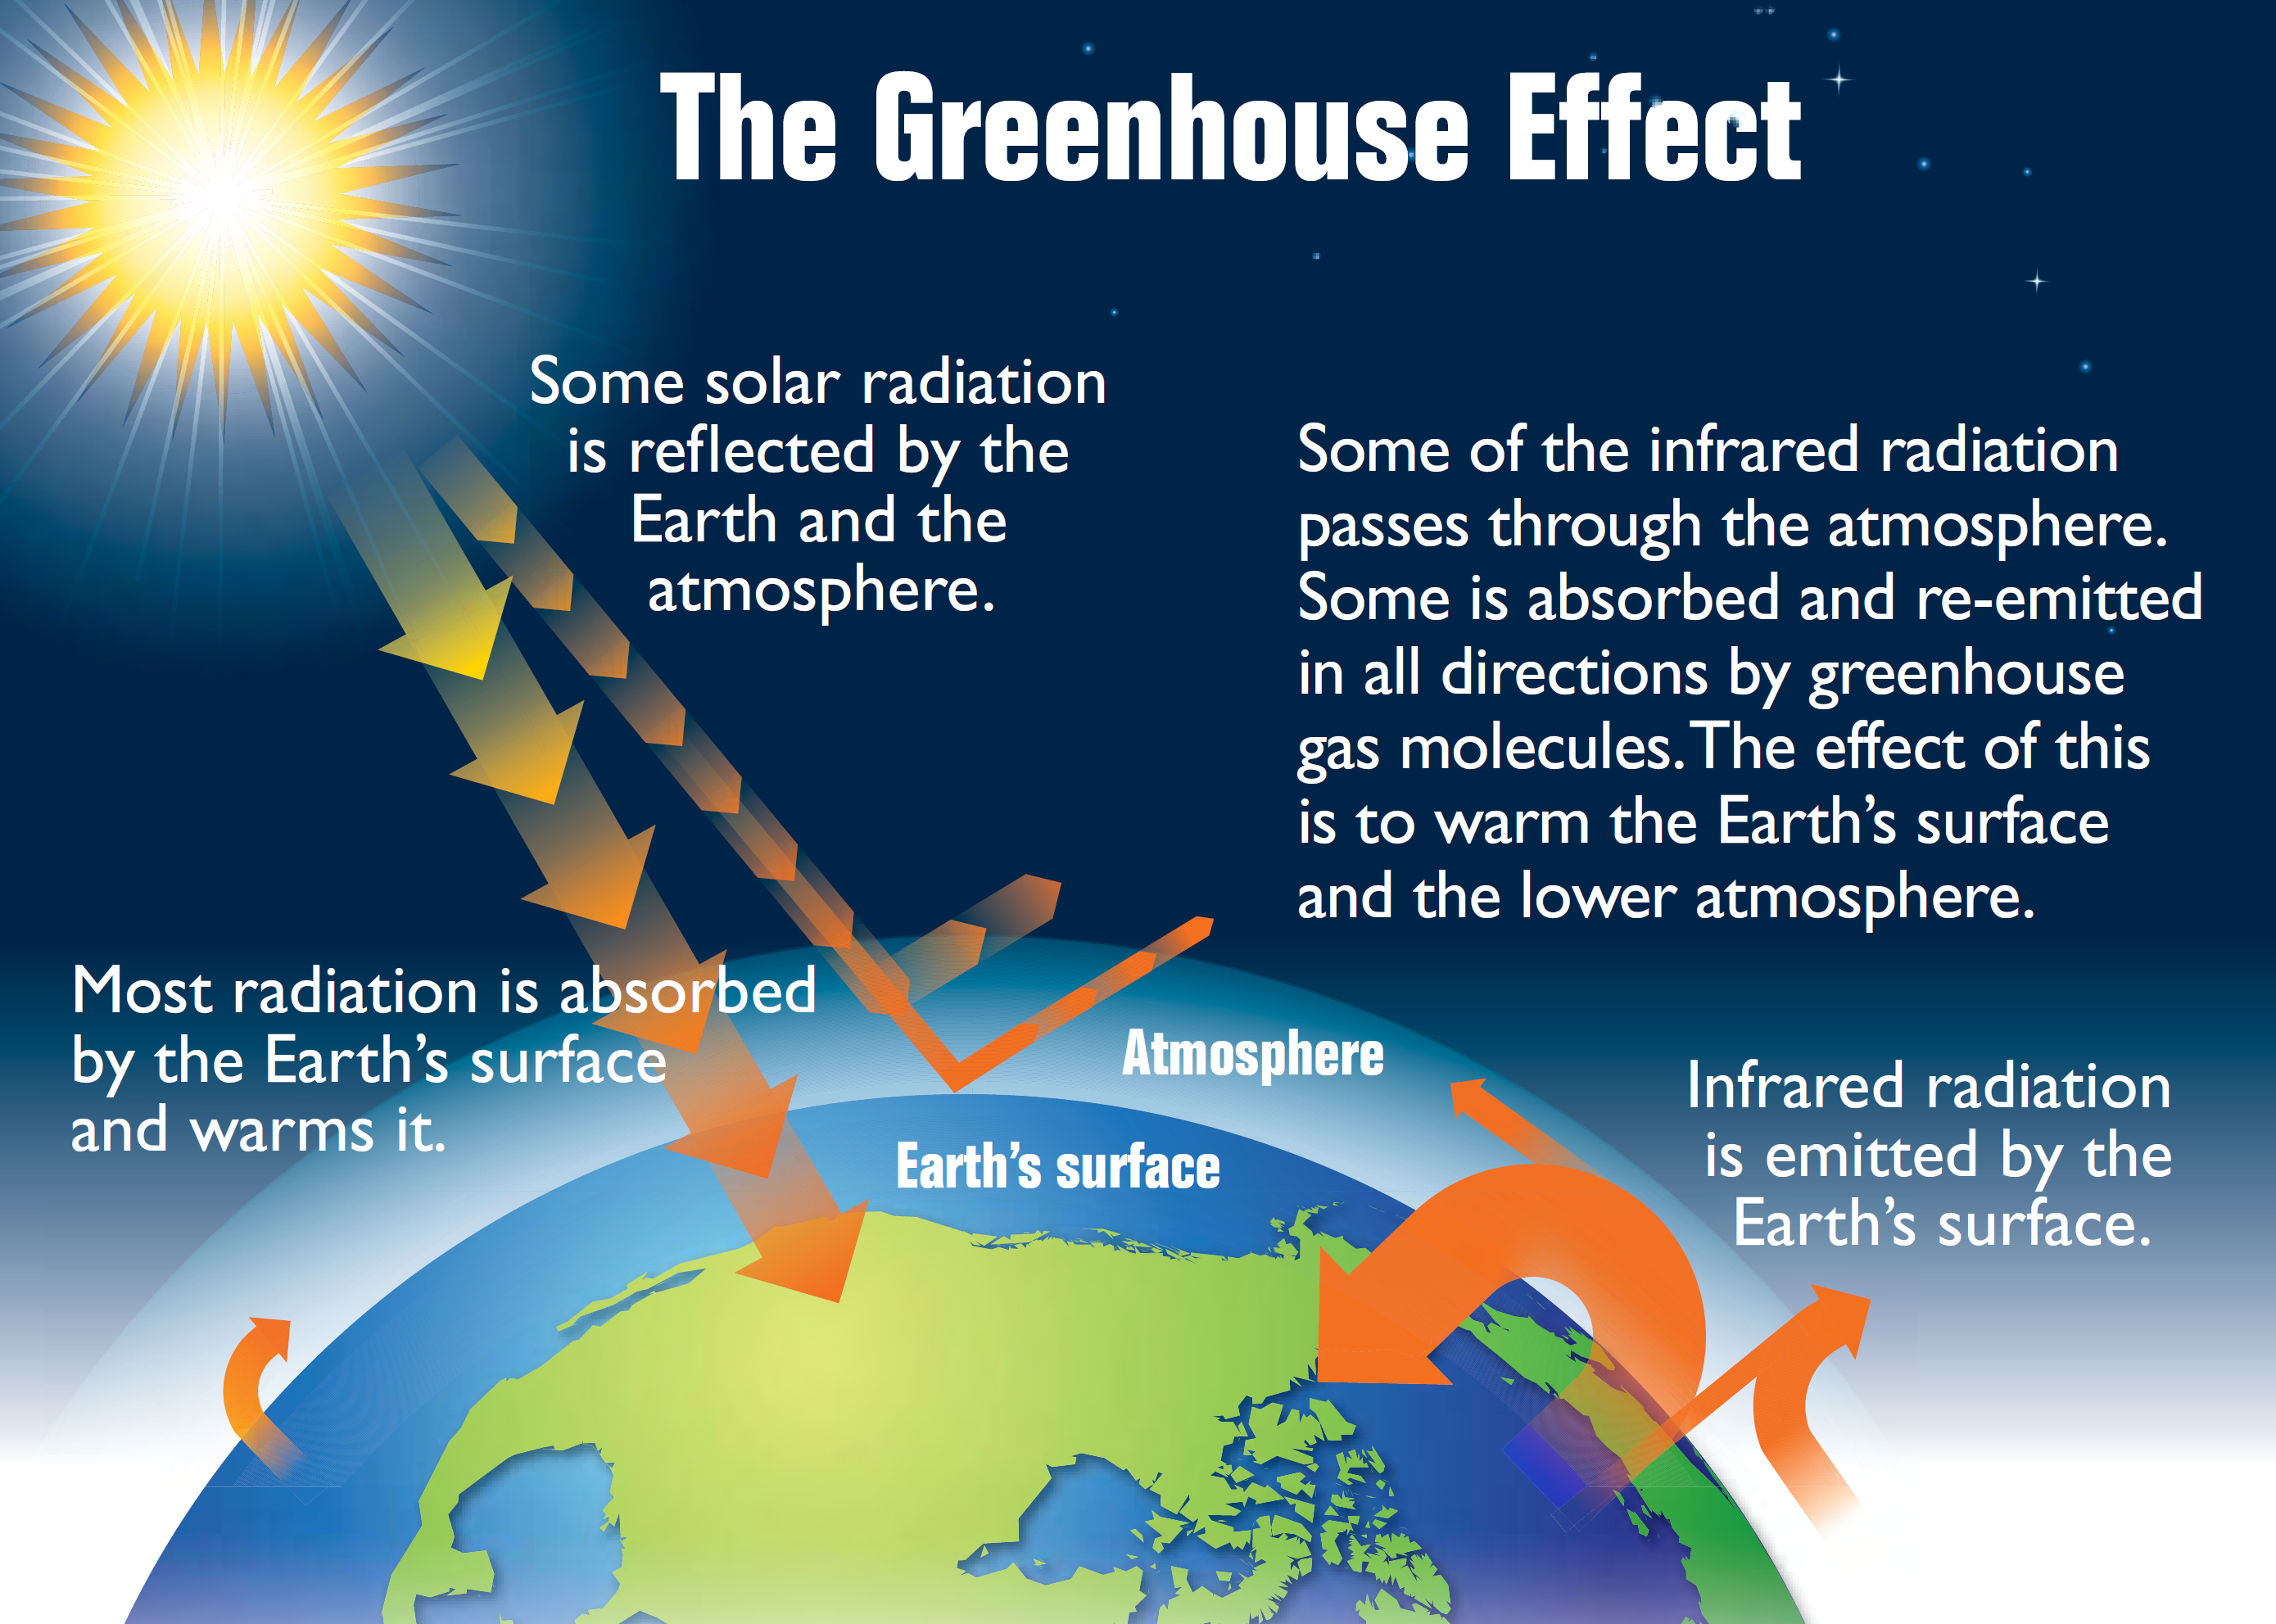
Earth is not getting warmer or cooler due to incoming solar radiation, which means that the planet’s heat budget is in balance, although the amount of incoming solar energy is different at different latitudes. The difference in solar energy received at different latitudes drives atmospheric circulation. The exception to Earth’s temperature being in balance is caused by greenhouse gases. Greenhouse gases warm the atmosphere by trapping heat. Some of the heat radiation from the ground is trapped by greenhouse gases in the troposphere. Like a blanket on a sleeping person, greenhouse gases act as insulation for the planet. The warming of the atmosphere because of insulation by greenhouse gases is called the greenhouse effect. Greenhouse gases are the component of the atmosphere that moderate Earth’s temperatures. Greenhouse gases include carbon dioxide (CO2), water vapor (H2O), methane (CH4), ozone (O3), nitrous oxides (N2O), and chlorofluorocarbons (CFCs). All of these gases are a normal part of the atmosphere except manmade CFCs.
Different greenhouse gases have different abilities to trap heat. For example, one methane molecule traps 30 times as much heat as one carbon dioxide molecule. One CFC-12 molecule (a type of CFC) traps 10,600 times as much heat as one CO2 molecule. Still, CO2 is a very important greenhouse gas because it is much more abundant in the atmosphere. Human activity has significantly raised the levels of many of greenhouse gases in the atmosphere. Methane levels are about 2.5 times higher as a result of human activity. Carbon dioxide has increased more than 35%. CFCs have only recently existed. This is a concern because, as atmospheric greenhouse gas levels increase, more greenhouse gases trap more heat and warm the atmosphere. The increase or decrease of greenhouse gases in the atmosphere affect climate and weather over the entire Earth.

Take this quiz to check your comprehension of this section.
If you are using an offline version of this text, access the quiz for Section 14.1 via the QR code.
14.2 Weather Processes
The energy in our atmosphere creates temperature differences, and these temperature differences cause air rising, sinking, and moving across Earth’s surface. This movement causes wind, storms, rain, and drought. In the following sections, we will explore the processes that control our weather.
14.2.1 Water in the Atmosphere
Humidity is the amount of water vapor in the air in a particular spot. We usually use the term to mean relative humidity, the percentage of water vapor a certain volume of air is holding relative to the maximum amount it can contain. If the humidity today is 80%, it means that the air contains 80% of the total amount of water it can hold at that temperature. If the humidity increases to more than 100%, the excess water condenses and forms precipitation. Since warm air can hold more water vapor than cool air, raising or lowering the temperature can change air’s relative humidity. The temperature at which air becomes saturated with water is called the air’s dew point. This term makes sense, because water condenses from the air as dew if the air cools down overnight and reaches 100% humidity.
Clouds influence weather in a few ways: by preventing solar radiation from reaching the ground, by absorbing warmth that is re-emitted from the ground, and as a source of precipitation. When there are no clouds, there is less insulation. As a result, cloudless days can be extremely hot, and cloudless nights can be very cold. For this reason, cloudy days tend to have a lower range of temperatures than clear days. There are a variety of conditions needed for clouds to form; for instance, clouds form when air reaches its dew point. This can happen in two ways: (1) air temperature stays the same but humidity increases, common in locations that are warm and humid; (2) humidity can remain the same, but temperature decreases. When the air cools enough to reach 100% humidity, water droplets form. Air cools when it comes into contact with a cold surface or when it rises.
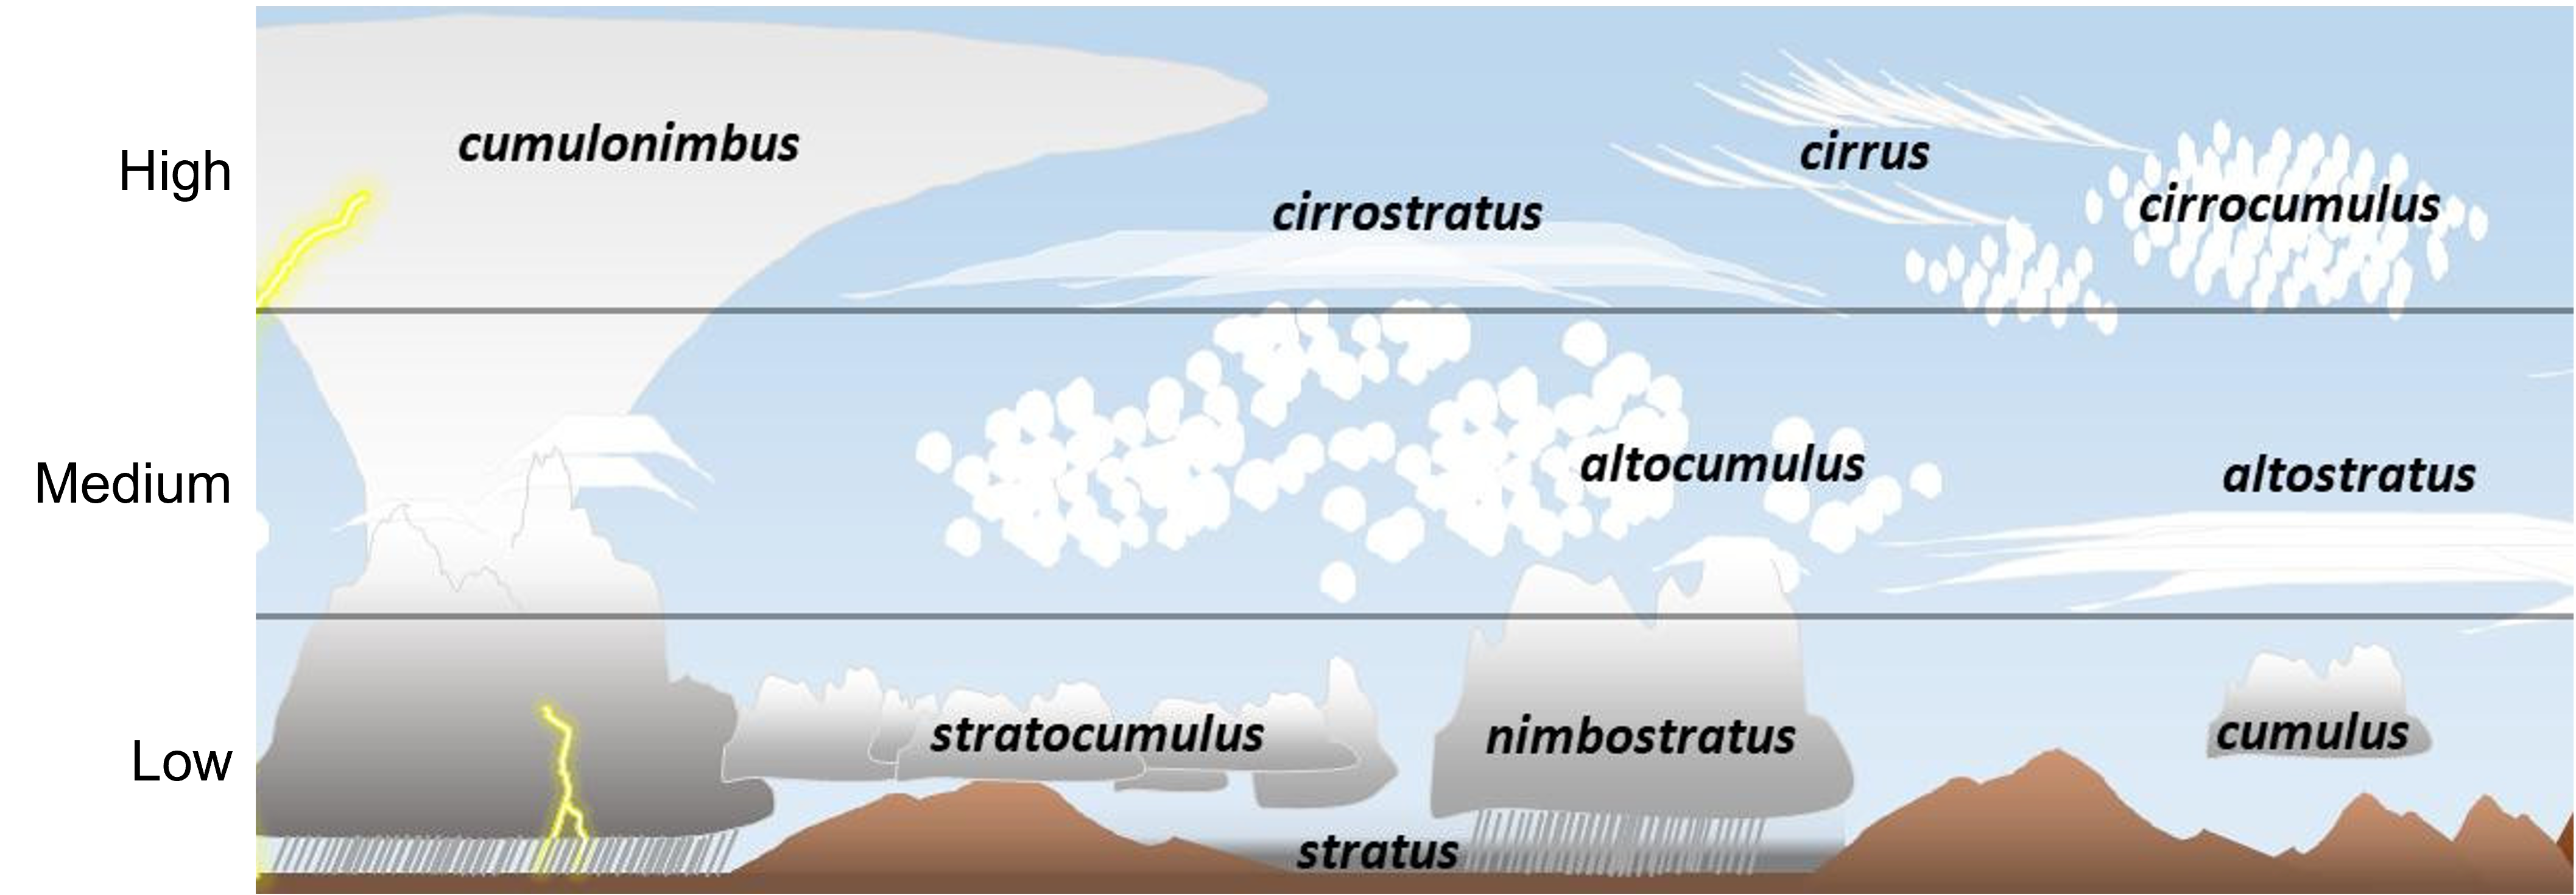
Water vapor is not visible unless it condenses to become a cloud. Water vapor condenses around a nucleus, such as dust, smoke, or a salt crystal. This forms a tiny liquid droplet. Billions of these water droplets together make a cloud. Clouds are classified in several ways. While clouds appear in infinite shapes and sizes, they fall into some basic forms. From his Essay of the Modifications of Clouds (1803), Luke Howard divided clouds into three categories: cirrus, cumulus, and stratus, plus a fourth special type, nimbus. The most common classification used today divides clouds into these four separate cloud groups, which are determined by their altitude and whether precipitation is occurring or not.
High-level clouds, such as cirrus, cirrostratus, and cirrocumulus, form from ice crystals where the air is extremely cold and can hold little water vapor. Middle-level clouds, including altocumulus and altostratus clouds, may be made of water droplets, ice crystals, or both, depending on the air temperatures. Low-level clouds are nearly all water droplets. Stratus, and stratocumulus clouds are common low clouds. A special rain cloud category combines the three forms—cumulo, cirro, and stratus—referred to as a nimbo-form cloud (from nimbus, the Latin word for rain). The vast majority of precipitation occurs from nimbo-form clouds, and therefore these clouds are generally the thickest.


Fog is a cloud located at or near the ground. When humid air near the ground cools below its dew point, fog is formed. The several types of fog each form in a different way. Radiation fog forms at night when skies are clear and the relative humidity is high. As the ground cools, the bottom layer of air cools below its dew point. Tule fog is an extreme form of radiation fog found in some regions. San Francisco, California, is famous for its summertime advection fog. Warm, moist Pacific Ocean air blows over the cold California Current and cools below its dew point. Sea breezes bring the fog onshore. Steam fog appears in autumn when cool air moves over a warm lake. Water evaporates from the lake surface and condenses as it cools, appearing like steam. Warm, humid air travels up a hillside and cools below its dew point to create upslope fog.
Precipitation is an extremely important part of weather. Some precipitation forms in place. The most common precipitation comes from clouds. Rain or snow droplets grow as they ride air currents in a cloud and collect other droplets. They fall when they become heavy enough to escape from the rising air currents that hold them up in the cloud. One million cloud droplets will combine to make only one rain drop. If temperatures are cold, the droplet will hit the ground as a snowflake.
14.2.2 Air Masses
An air mass is a large body of air that covers a relatively wide area and exhibits horizontally uniform properties of moisture and temperature. The location where an air mass receives its characteristics of temperature and humidity is called the source region. Air masses are slowly pushed along by high-level winds, and when an air mass moves over a new region, it shares its temperature and humidity with that region, which means that the temperature and humidity of a particular location depends partly on the characteristics of the air mass above it. Storms arise if the air mass and the region it moves over have different characteristics. For example, when a colder air mass moves over warmer ground, the bottom layer of air is heated. That air rises, forming clouds, rain, and sometimes thunderstorms.
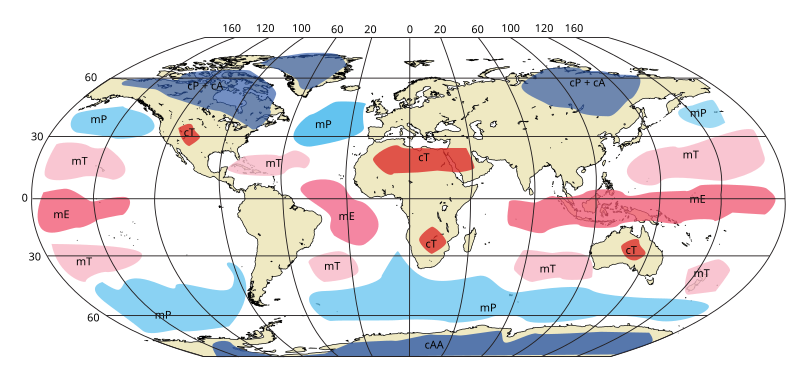
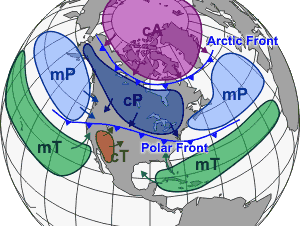
In general, cold air masses tend to flow toward the equator and warm air masses tend to flow toward the poles. This brings heat to cold areas and cools down areas that are warm. It is one of the many processes that act toward balancing out the planet’s temperatures. An air mass is classified by its temperature and moisture and is identified by using a letter code system. The first letter is always lowercase and determines the moisture content within the air mass: m (maritime) is moist and c (continental) is dry. The second letter is always capital and determines latitude: E (equatorial) is hot, T (tropical) is warm, P (polar) is cold, and A (arctic) is very cold.
14.2.3 Weather Fronts
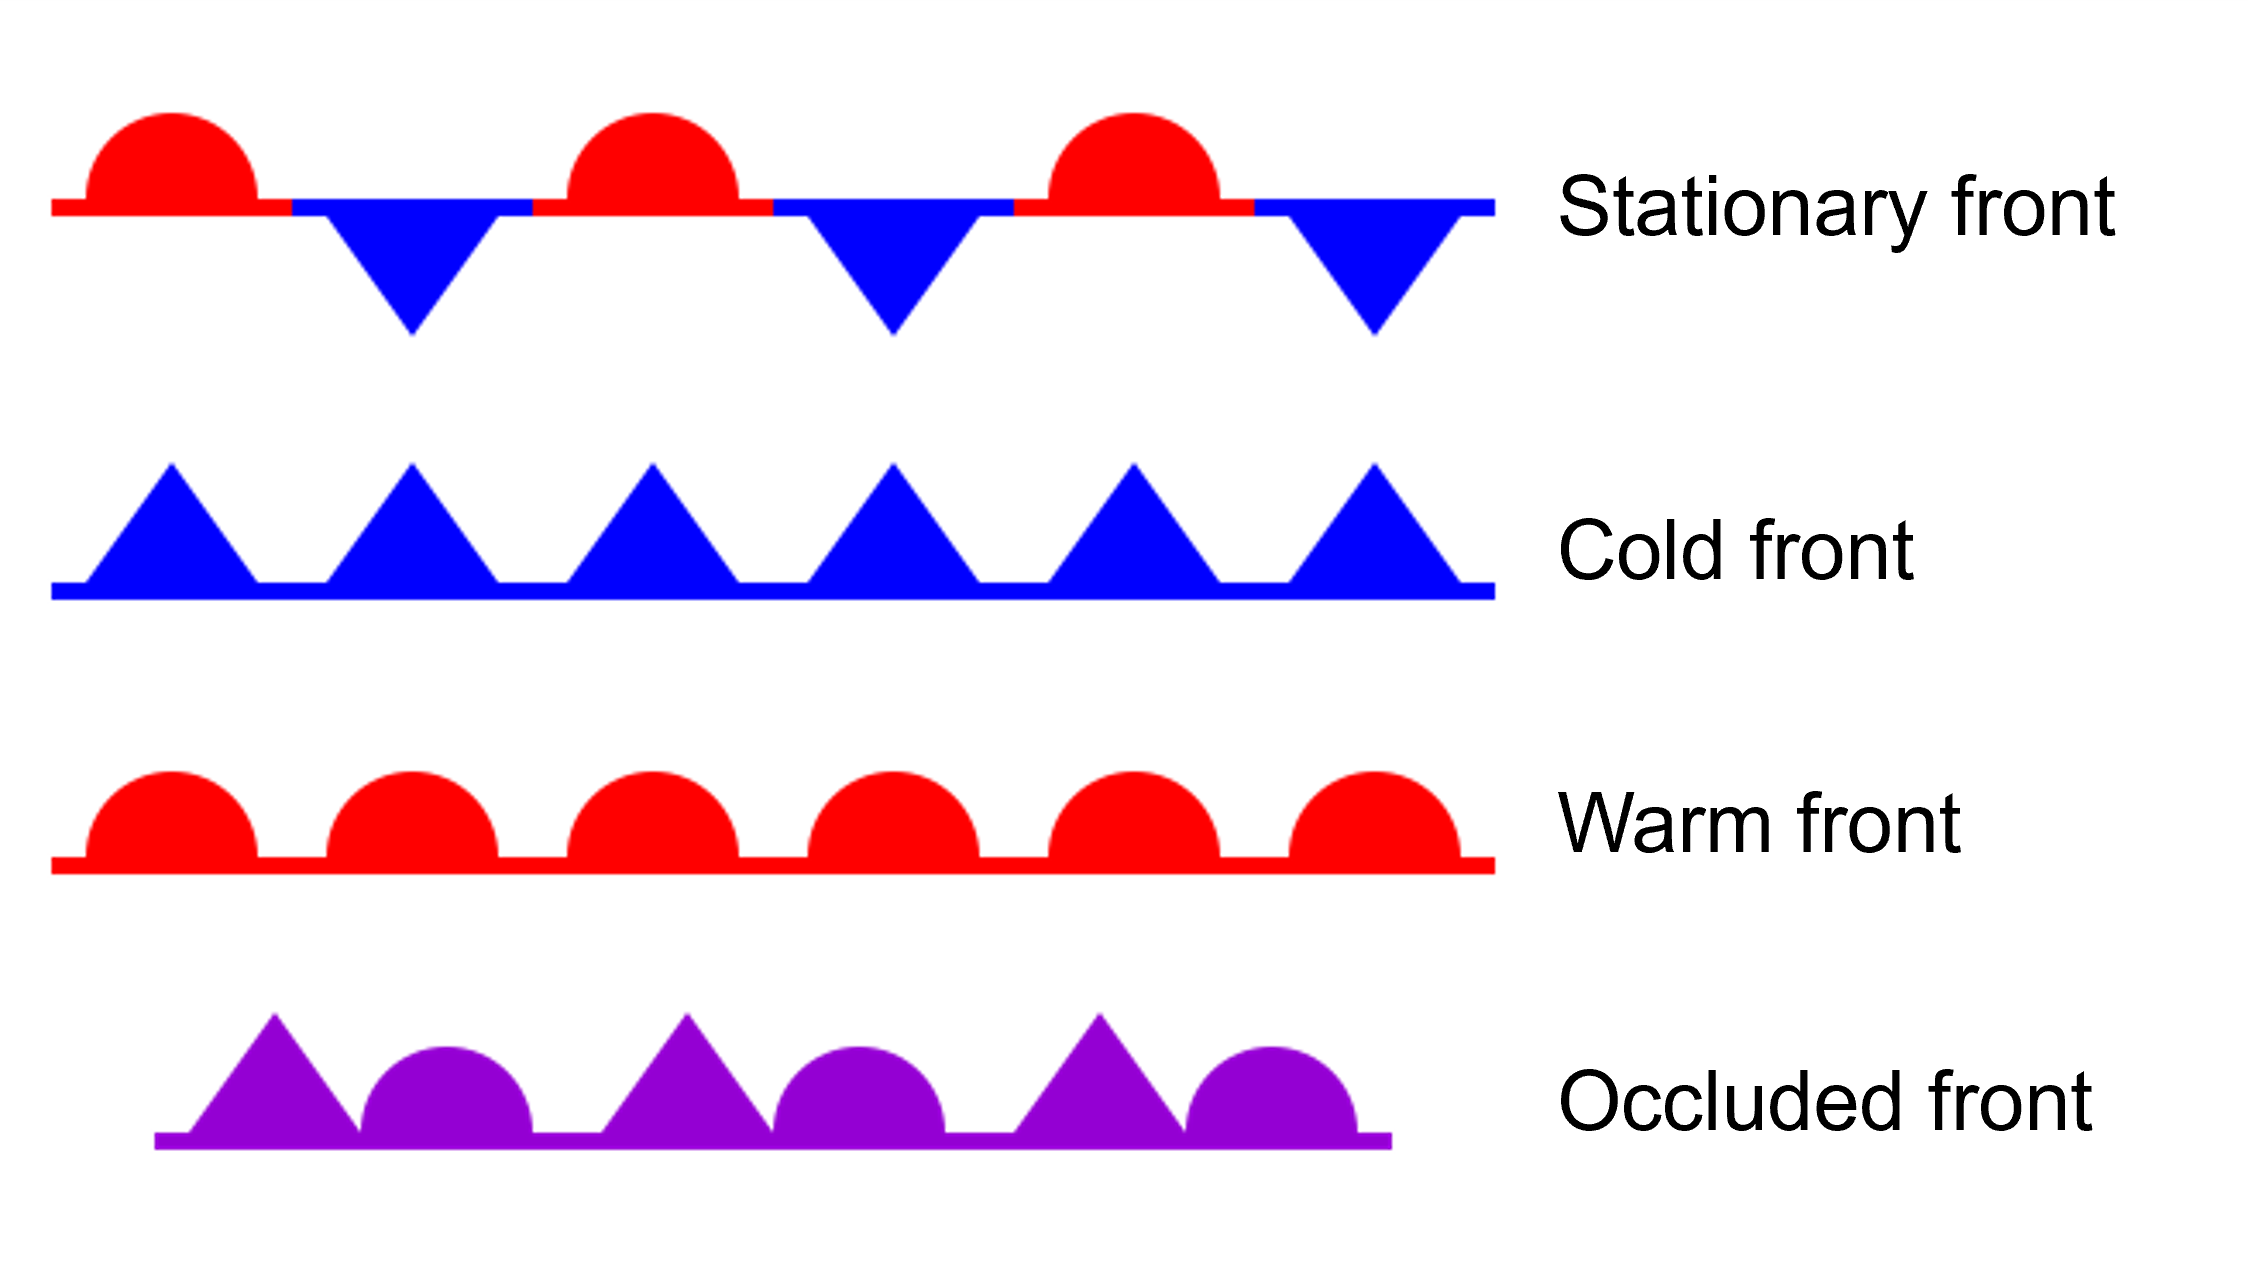
A weather front is a transition zone between two air masses of relatively different densities, temperatures, and moisture. When two air masses come into contact with each other, they do not like to mix well because of their different densities (much like water and oil). Along a weather front, the warmer, less dense air rises over the colder, denser air to form clouds. There are several types of weather fronts: stationary fronts, cold fronts, warm fronts, and occluded fronts.
A stationary front occurs when two contrasting air masses of moisture and temperature connect, but neither of them will ground the other. In many ways, the two air masses are at a stalemate until one of them begins to give ground to the other. Typically, but not always, stationary fronts produce mild but prolonged precipitation.
Cold fronts are zones separating two distinct air masses, of which the colder, denser mass is advancing and replacing the warmer. The colder, denser air pushes under the warm air, forcing the warm, lighter air upward. If the warm air rising is unstable enough, massive thunderstorms are likely to occur. Cumulous and cumulonimbus clouds are common.
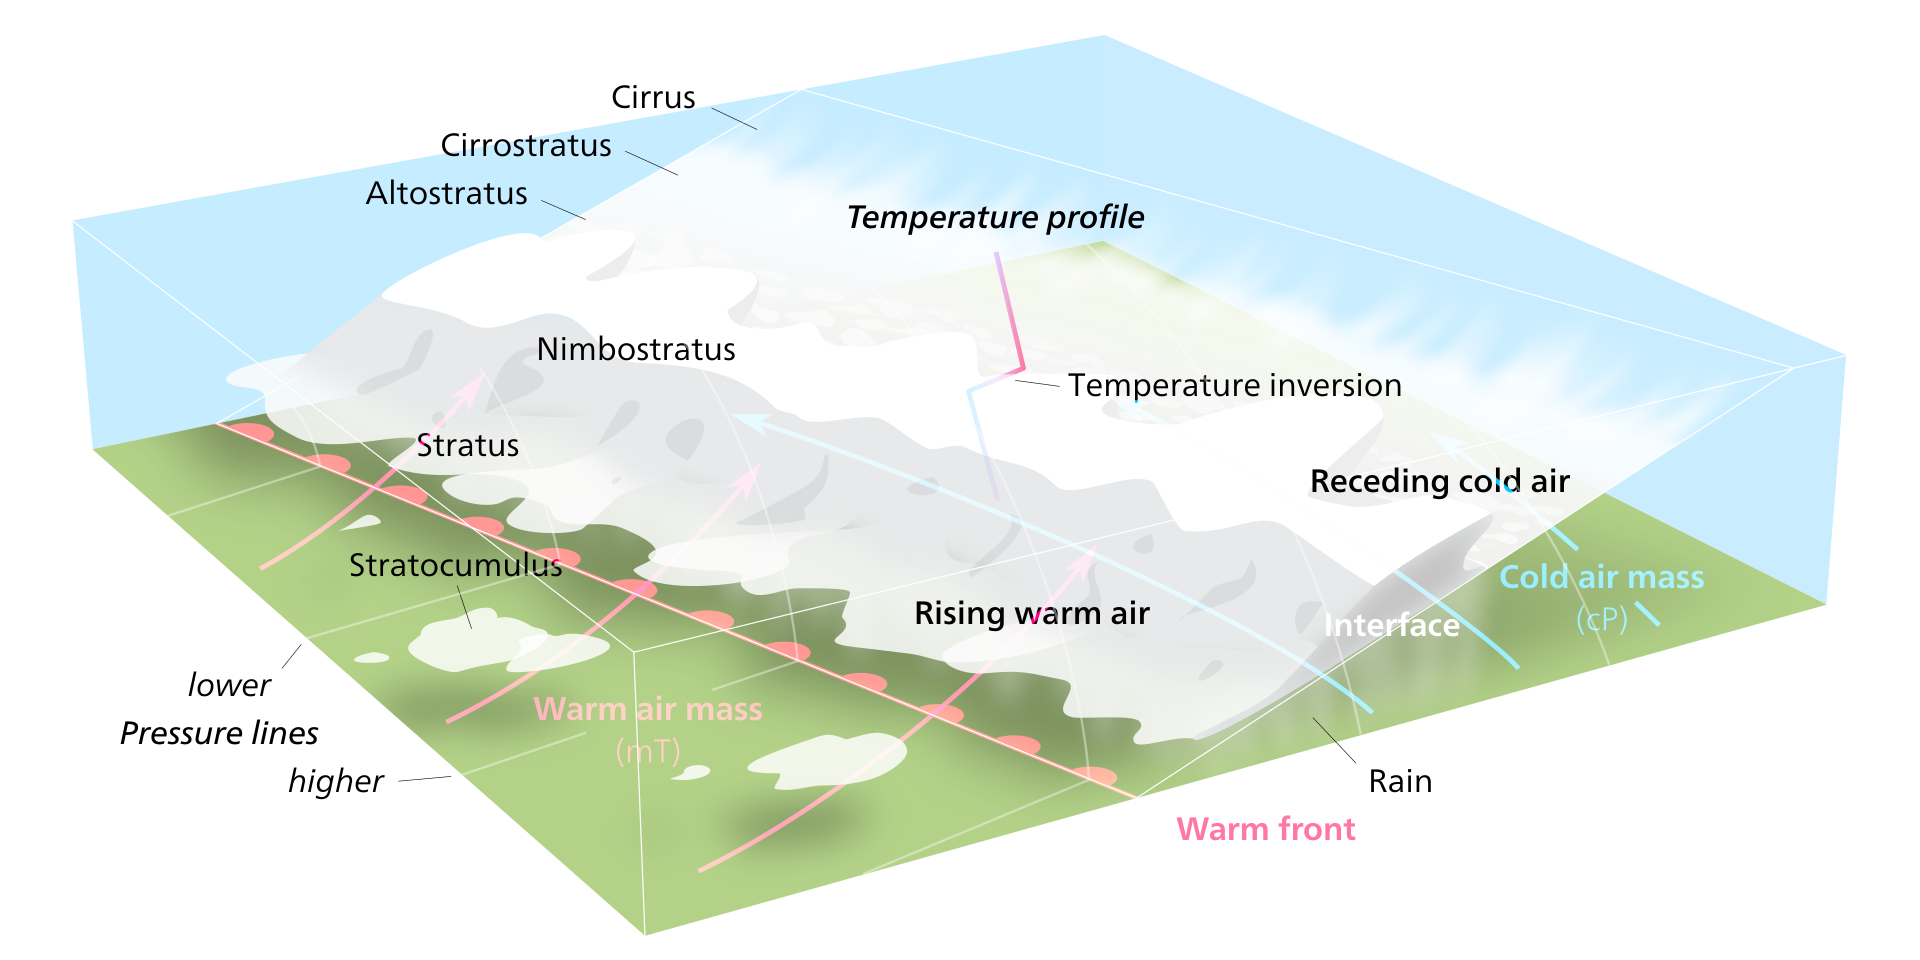
Warm fronts mark the boundary between a warm air mass that is replacing a colder air mass. When a warm air mass advances over a cold air mass, the warm air rises over but at a gentler rate than a cold front. Since the warm air does not rise as fast as a cold front, more stratus clouds form and precipitation is not as heavy.
Finally, occluded fronts occur when a cold front overtakes a warm front, causing the warmer air to rise above and meet up with another cold air mass. The air masses, in order from front to back, are cold, warm, and then cold again. The Coriolis effect curves the boundary where the two fronts meet toward the pole. If the air mass that arrives third is colder than either of the first two air masses, that air mass slip beneath them both. This is called a cold occlusion. If the air mass that arrives third is warm, that air mass rides over the other air mass, called a warm occlusion. The weather at an occluded front is especially fierce right at the occlusion. Precipitation and shifting winds are typical.
14.2.4 Physical Controls on Weather and Climate
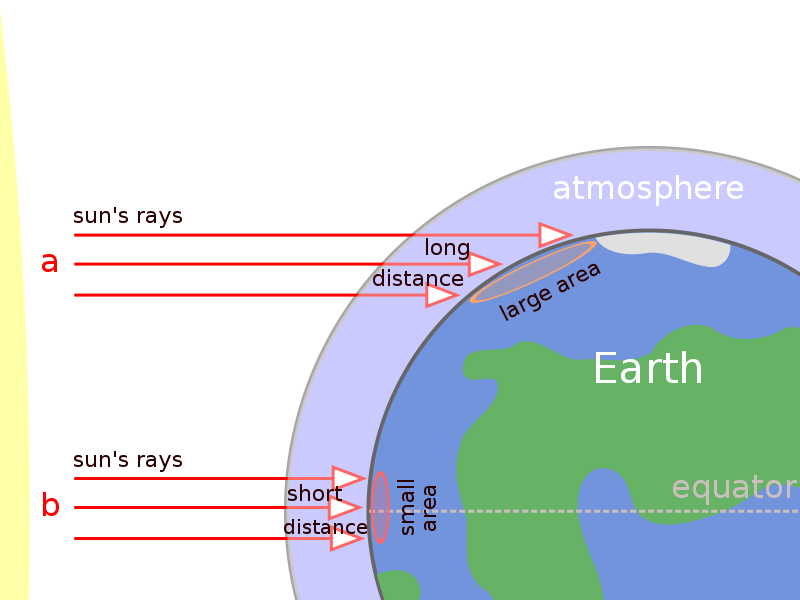
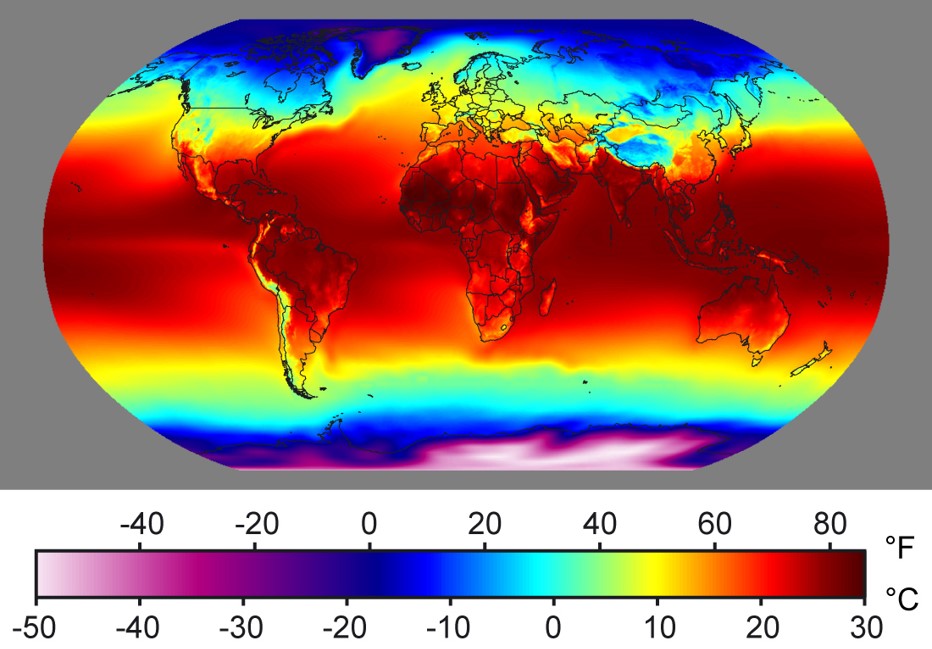
Several controlling factors determine global temperatures. The first and most significant factor controlling Earth’s weather patterns is latitude. Because of the Earth’s shape and the angle at which the Sun hits the planet, temperatures are highest near the equator and decrease toward the poles. In fact, at the equator, more energy is absorbed from the Sun than is radiated back into space. At the poles, more energy is radiated back into space than is absorbed by the Sun. The purpose of weather and ocean currents is to balance out these two extremes.
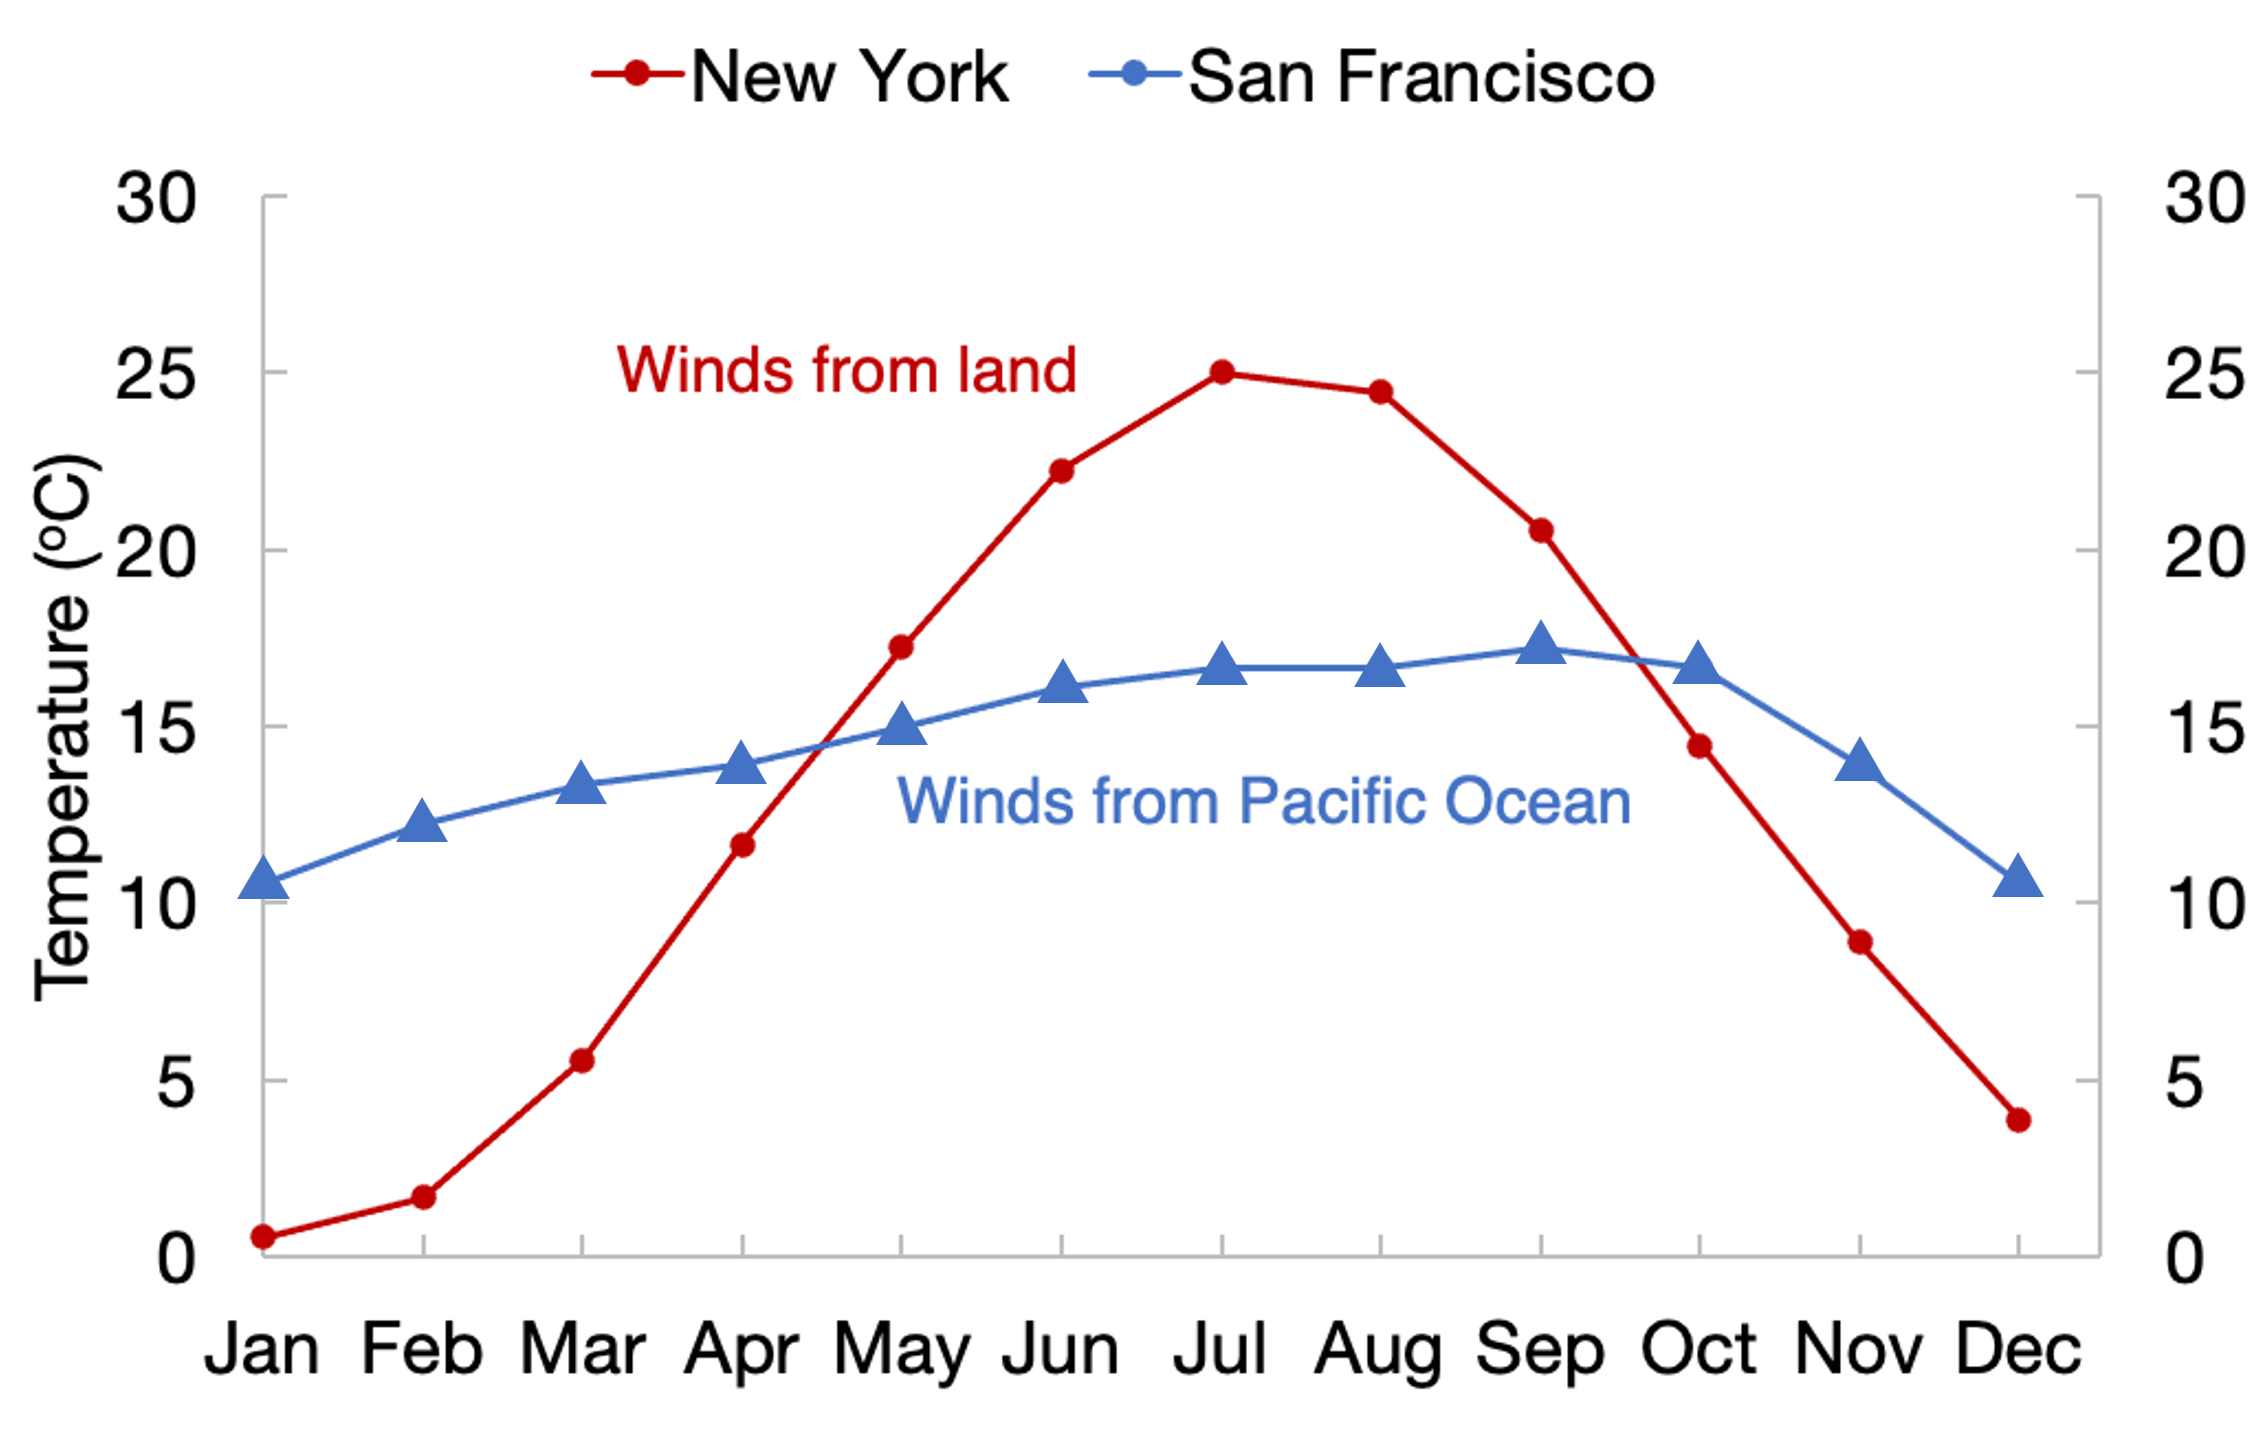
The next impact on temperature is the land-water distribution on the planet. Places near the ocean tend to have milder climates year-round versus regions surrounded by land. This is because land can heat up and cool down faster and with more significant fluctuation than the ocean. The reason is that sunlight must heat a larger volume of area in the ocean since light can pass through water. Water requires five times more energy to rise in heat by one degree Celsius than for landmasses (water has a high specific heat). Thus, the temperatures of regions near large bodies of water change more slowly compared to land.
Ocean currents are also vital controls in transferring heat around the planet. In the Northern Hemisphere, ocean currents rotate clockwise, bringing cold water from the North Pole toward the equator and warm water from the equator toward the North Pole. The opposite occurs in the Southern Hemisphere, where ocean currents rotate counterclockwise. This results in overall cooler temperatures along the west coasts of continents and warmer temperatures along the east coasts.
The last control of temperature is elevation. On average, atmospheric temperature decreases 3.5°F per 1,000 feet rise in elevation (6.4°C/km). This is called the normal lapse rate (a.k.a. temperature lapse rate).

Take this quiz to check your comprehension of this section.
If you are using an offline version of this text, access the quiz for Section 14.2 via the QR code.
14.3 Severe Weather
Severe weather is classified as “a series of events that can cause destructive or deadly effects on the ground” (NOAA). Severe weather can occur under a variety of situations, but three characteristics are generally needed: a temperature or moisture boundary, moisture, and (in the event of severe, precipitation-based events) instability in the atmosphere.
14.3.1 Thunderstorms
Weather happens every day, but only some days have storms. Storms vary immensely depending on whether they’re warm or cold, coming off the ocean or off a continent, occurring in summer or winter, and many other factors. The effects of storms also vary depending on whether they strike a populated area or a natural landscape. Hurricane Katrina is a good example, since the flooding after the storm severely damaged New Orleans, while a similar storm in an unpopulated area would have done little damage. Thunderstorms are extremely common, with 14 million happening around the world every year; that’s 40,000 per day! Most drop a lot of rain on a small area quickly, but some are severe and highly damaging. They form when ground temperatures are high, ordinarily in the late afternoon or early evening in spring and summer.
All thunderstorms go through a three-stage life cycle. The first stage is called the cumulus stage, where an air parcel is forced to rise, cool, and condense—occurring at the lower condensation level—to develop into a cumulus cloud. The process of water vapor condensing into liquid water releases large quantities of latent heat, which makes the air within the cloud warmer and unstable, causing the cloud to continue to grow upward like a hot air balloon. These rising air parcels, called updrafts, prevent precipitation from falling from the cloud. But once the precipitation becomes too heavy for the updrafts to hold up, the moisture begins to fall, creating downdrafts within the cloud. The downdrafts also begin to pull cold, dry air from outside the cloud toward the ground in a process called entrainment.
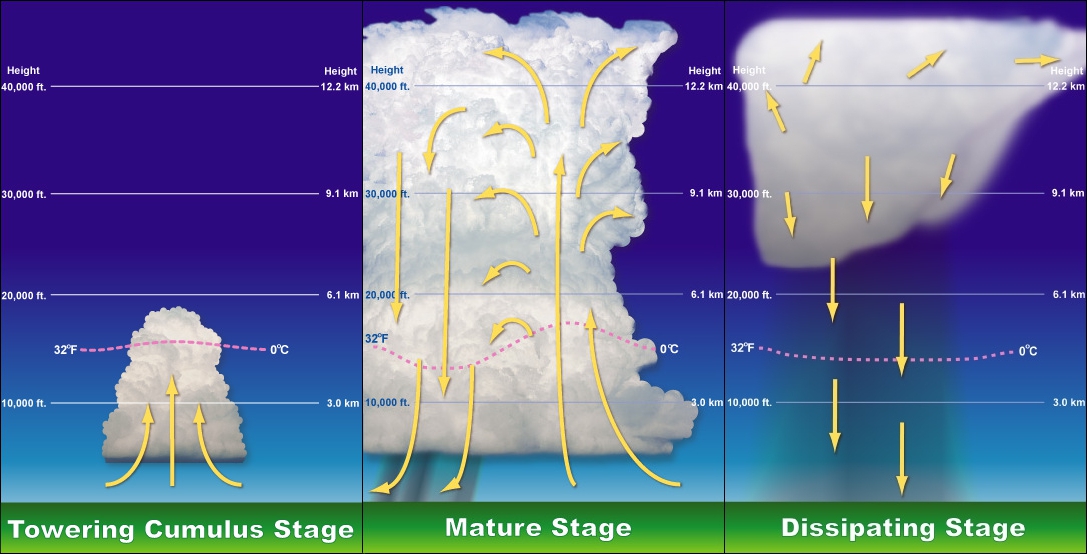
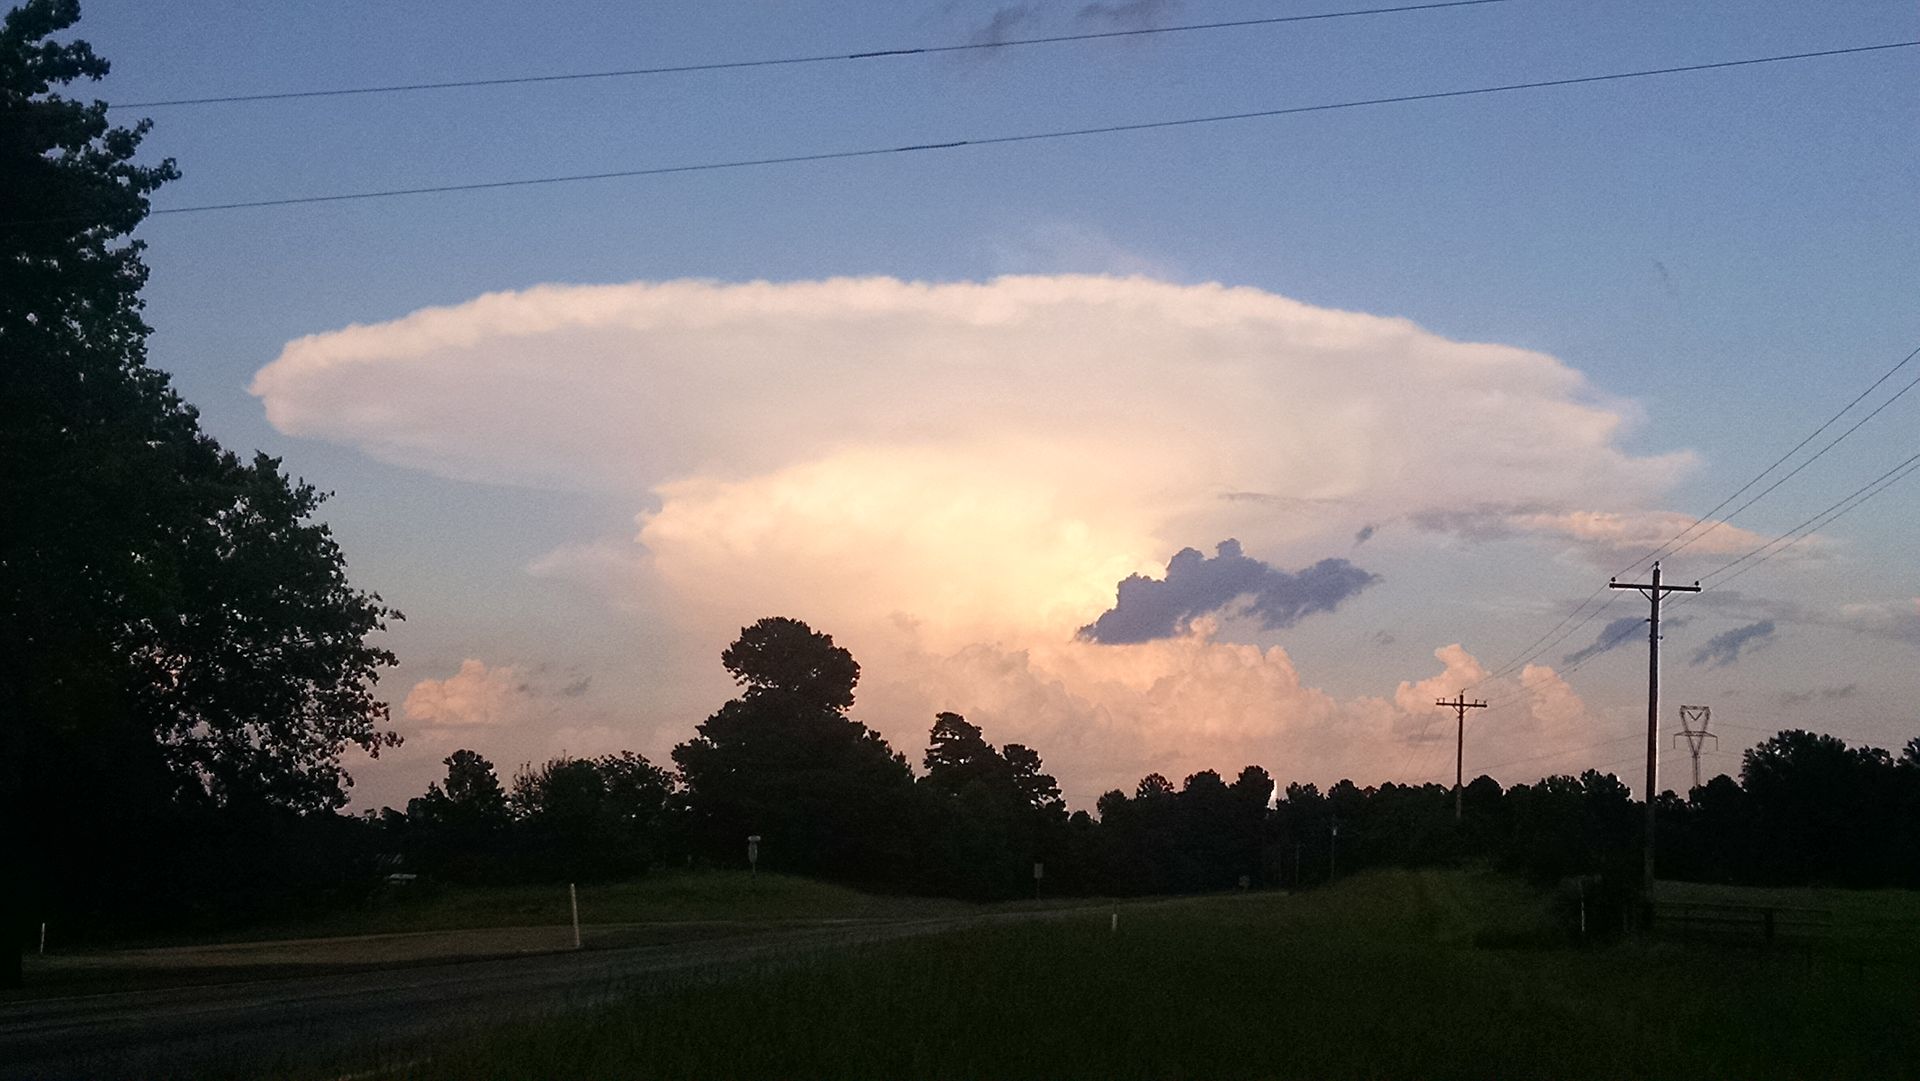
Once the precipitation begins to fall from the cloud, the storm has reached the mature stage. During this stage, updrafts and downdrafts exist side-by-side and the cumulonimbus is called a cell. If the updrafts reach the top of the troposphere, the cumulus cloud will begin to spread outward, creating a defined anvil. At the same time, the downdrafts spread within the cloud and at first widen the cloud but eventually overtake the updrafts. Cool downdrafts form when precipitation and the cool air from entrainment are dragged down to the lower regions of a thunderstorm. It is also during the mature stage that the storm is most intense, producing strong, gusting winds, heavy precipitation, lightning, and possibly small hail.
Once the downdrafts overtake the updrafts, which also prevents the release of latent heat energy, the thunderstorm will begin to weaken into the third and final stage, called the dissipating stage. During this stage, light precipitation and downdrafts become the dominant feature within the cloud as it weakens. In all, only 20% of the moisture within the cloud fell as precipitation, whereas the other 80% evaporates back into the atmosphere.
The downdrafts of severe thunderstorms are so intense that, when they hit the ground, it sends warm air from the ground upward into the storm. The warm air gives the convection cells more energy. Rain and hail grow huge before gravity pulls them to Earth. Severe thunderstorms can last for hours and can cause a lot of damage because of high winds, flooding, intense hail, and tornadoes. Thunderstorms can form individually or in squall lines along a cold front. In the United States, squall lines form in spring and early summer in the Midwest, where the maritime tropical (mT) air mass from the Gulf of Mexico meets the continental polar (cP) air mass from Canada. So much energy collects in cumulonimbus clouds that a huge release of electricity, called lightning, may result. The electrical discharge may be between one part of the cloud and another, two clouds, or a cloud and the ground.
14.3.2 Tornadoes
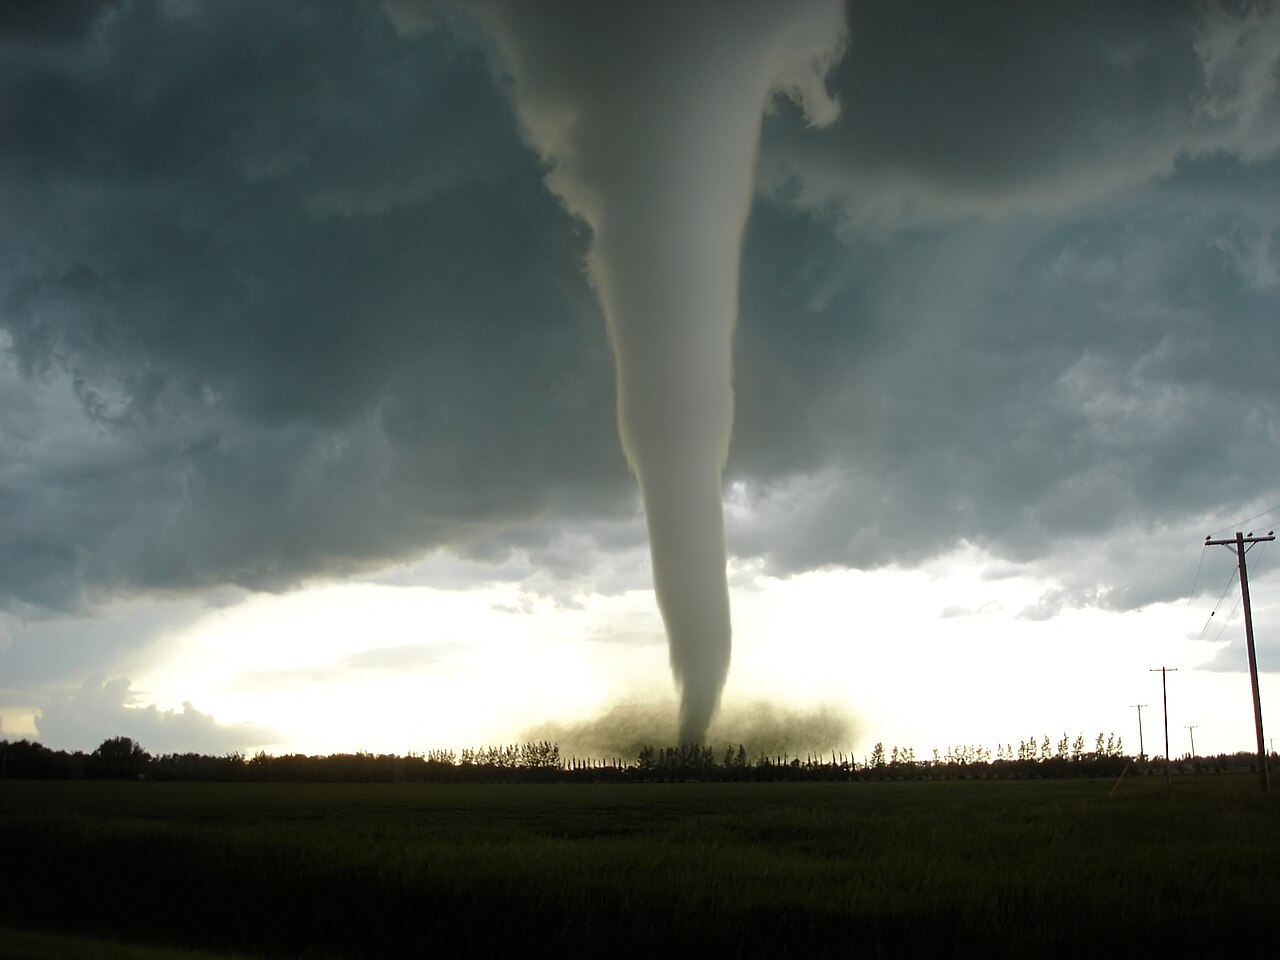
Tornadoes, also called twisters, are fierce products of severe thunderstorms. As air in a thunderstorm rises, the surrounding air races in to fill the gap, forming a funnel. A tornado lasts from a few seconds to several hours. The average wind speed is about 177 kph (110 mph), but some winds are much faster. A tornado travels over the ground at about 45 kph (28 mph) and goes about 25 km (16 m) before losing energy and disappearing. An individual tornado may strike a small area, but it can destroy everything in its path. Most injuries and deaths from tornadoes are caused by flying debris. In the United States, an average of 90 people are killed by tornadoes each year. The most violent two percent of tornadoes account for 70% of the deaths by tornadoes.
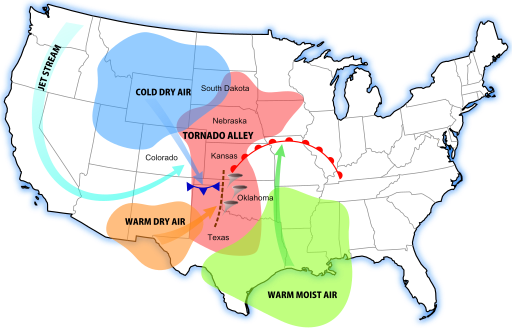
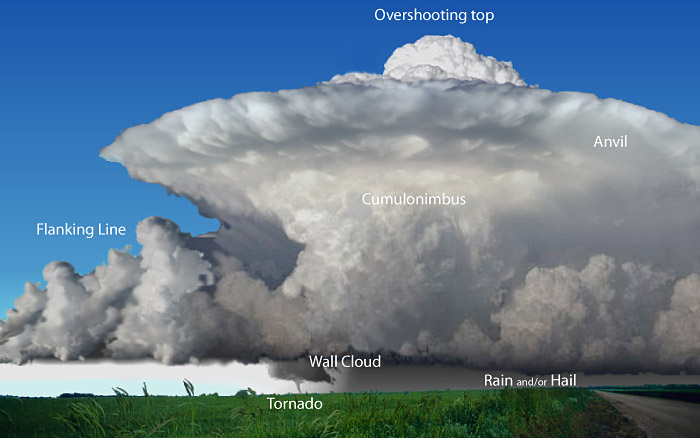
The anatomy and development of tornadoes are not fully understood, but they form from cold fronts, severe thunderstorms, squall lines, supercells, and hurricanes. Geography also plays a crucial role in determining where tornadoes can and cannot form. The majority of thunderstorms in the United States form in the Midwest, which includes an area known as Tornado Alley. This region is where continental polar (cP) air masses from Canada collide with maritime tropical (mT) air from the Gulf of Mexico. This wind shear creates unstable atmospheric conditions and a rotating corkscrew column of air.
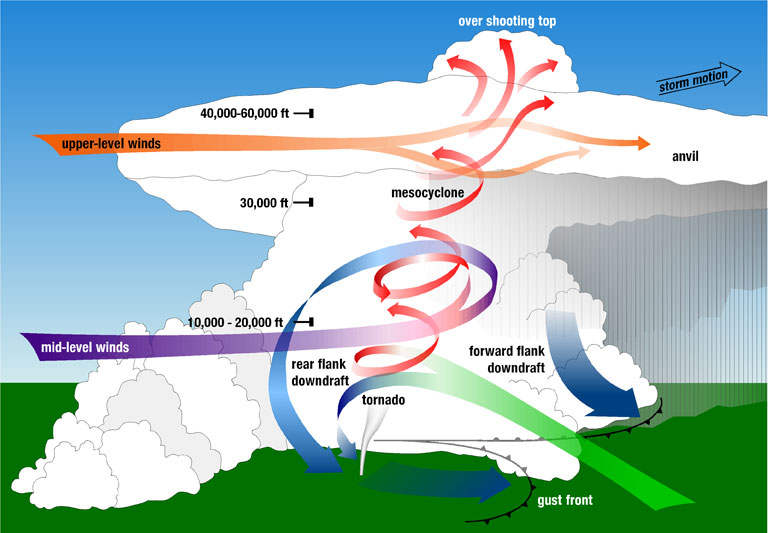
As the ground heats up through the day, updrafts pick up the rotating air into a portion of the thunderstorm to develop what is called a rotating mesocyclone. The updrafts stretch and tighten the now vertical column of air, causing it to rotate faster, much like an ice skater tightens to spin faster. As the rotating updrafts rise, a rotating wall cloud begins to form from the base of a mesocyclone. Sometimes a funnel cloud may begin to descend from the mesocyclone; it may even become a tornado if it reaches the ground.
Although there is an average of 770 tornadoes annually, the number of tornadoes each year varies greatly. In late April 2011, the situation was ripe for the deadliest set of tornadoes in 25 years. In addition to the meeting of cP and mT mentioned above, the jet stream was blowing strongly in from the west. The result was more than 40 tornadoes confirmed each day of the outbreak, with a one-day record of 223 on April 27. The entire region was alerted to the possibility of tornadoes in those late April days. But meteorologists can only predict tornado danger over a very wide region. No one can tell exactly where and when a tornado will touch down. Once a tornado is sighted on radar, its path is predicted and a warning is issued to people in that area. The exact path is unknown because tornado movement is not very predictable.
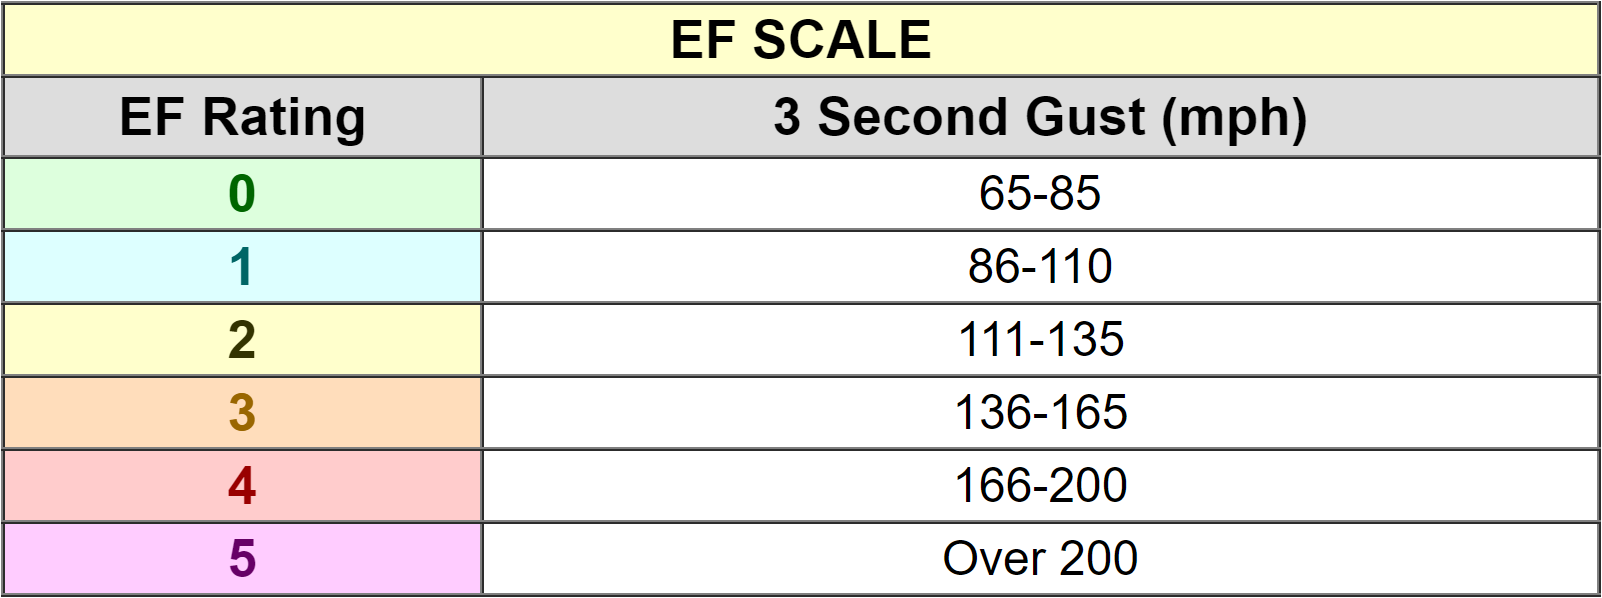
The intensity of tornadoes is measured on the enhanced Fujita scale, which assigns a value based on wind speed and damage. The enhanced Fujita scale, or EF scale, which became operational on February 1, 2007, is used to assign a tornado a rating based on estimated wind speeds and related damage. When tornado-related damage is surveyed, it is compared to a list of damage indicators (DIs) and degrees of damage (DoD), which help estimate better the range of wind speeds the tornado likely produced. From that, a rating (from EF0 to EF5) is assigned. The EF scale was revised from the original Fujita scale to reflect better examinations of tornado damage surveys so as to align wind speeds more closely with associated storm damage. The new scale has to do with how most structures are designed.
14.3.3 Hurricanes

Tropical cyclones are considered some of the most powerful weather systems on the planet because of their size, strength, and potential loss to life and property. Tropical cyclones go by different names depending on geographic location. In North and Central America, they are called hurricanes. In the northwestern portion of the Pacific Ocean near China and Japan, they are called typhoons. Furthermore, in the Indian Ocean and Australia, they are called cyclones.
By any name, they are the most damaging storms on Earth. Hurricanes arise in the tropical latitudes (between 10° and 25° N) in summer and autumn when sea surface temperatures are 28°C (82°F) or higher. The warm seas create a large humid air mass. The warm air rises and forms a low-pressure cell, known as a tropical depression. Thunderstorms materialize around the tropical depression. If the temperature reaches or exceeds 28°C (82°F), the air begins to rotate around the low pressure (counterclockwise in the Northern Hemisphere and clockwise in the Southern Hemisphere). As the air rises, water vapor condenses, releasing energy from latent heat. If wind shear is low, the storm builds into a hurricane within two to three days.
Hurricanes are huge systems with high winds. The exception is the relatively calm eye of the storm, where air rises upward. Rainfall can be as high as 2.5 cm (1 in) per hour, resulting in about 20 billion metric tons of water released daily in a hurricane. The release of latent heat generates enormous amounts of energy, nearly the total annual electrical power consumption of the United States from one storm. Hurricanes can also generate tornadoes.
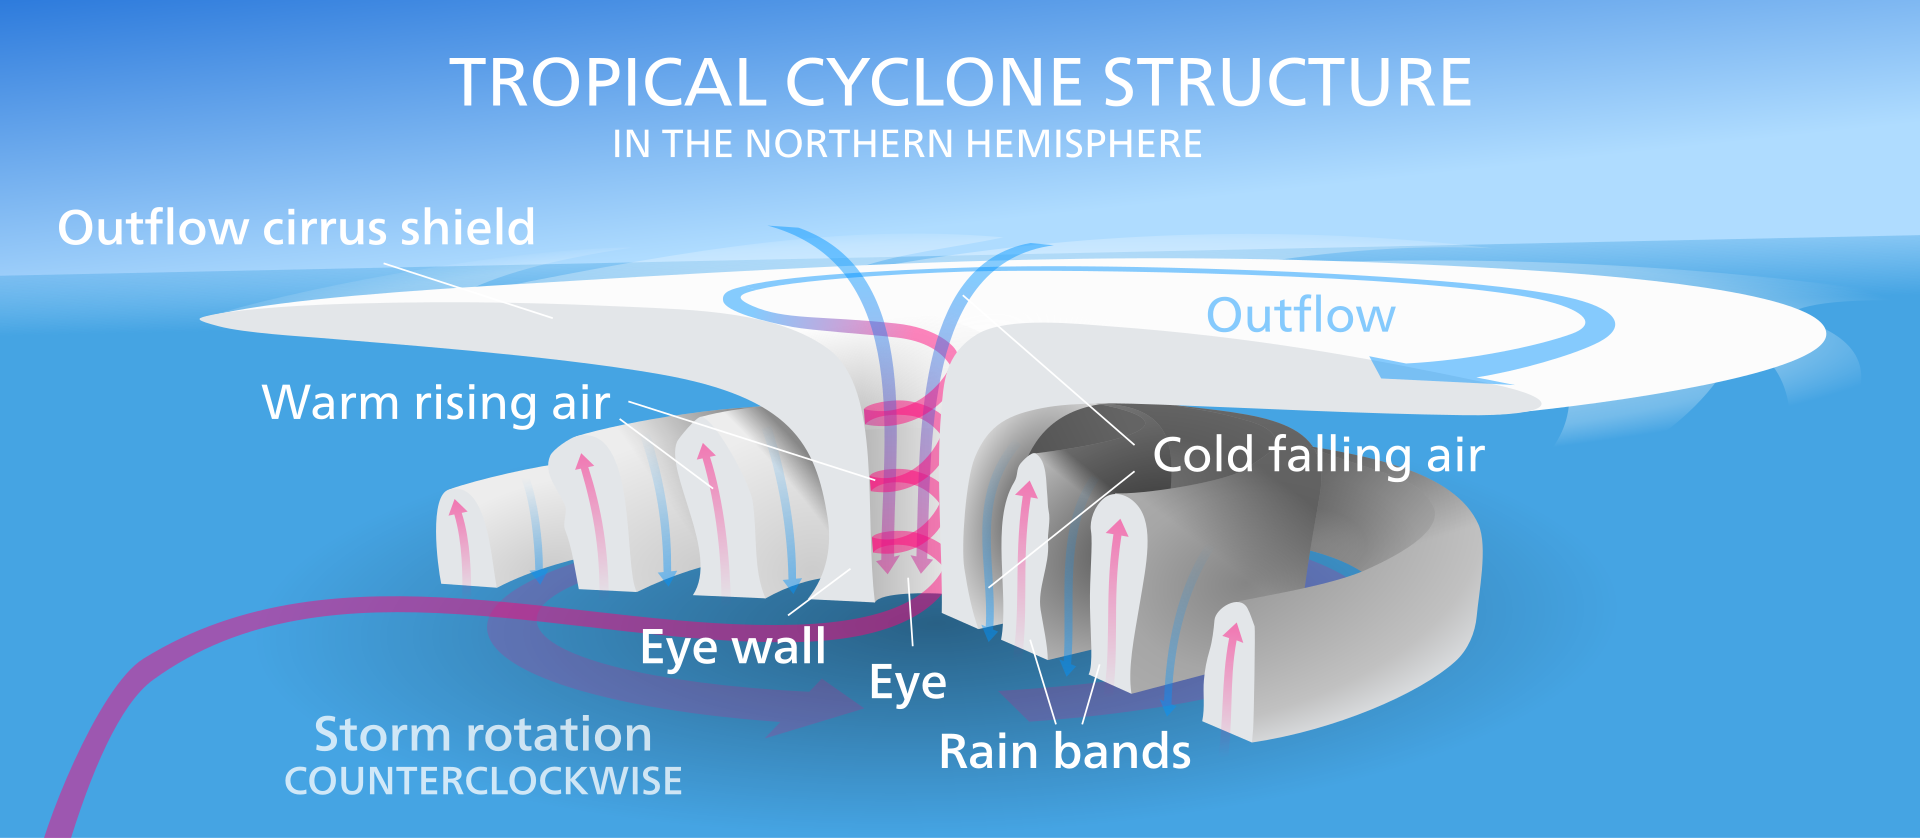
The structure of a hurricane is fairly simple, though the processes involved are quite complex. As a low-pressure disturbance forms, the warm, moist air rushes toward the low pressure in order to rise upward to form towering thunderstorms. Around the low-pressure disturbance is a wall of clouds called an eye wall. Within the eye wall, the wind speeds are greatest, the clouds are the tallest, atmospheric pressure is at its lowest, and precipitation is most intense.
At the center, or heart, of the hurricane is the eye. Within the eye of a hurricane, winds are light, precipitation is minimal, and occasionally the skies above are clear. It is the calm region of the tropical storm, but that is what makes it so dangerous. Many people tend to go outside as the eye moves overhead because they believe the storm is over. But what some don’t realize is that “round two” is coming from behind. Moving away from the eye wall are organized, intense thunderstorms called spiral rain bands, which rotate around and toward the storm’s eye wall.
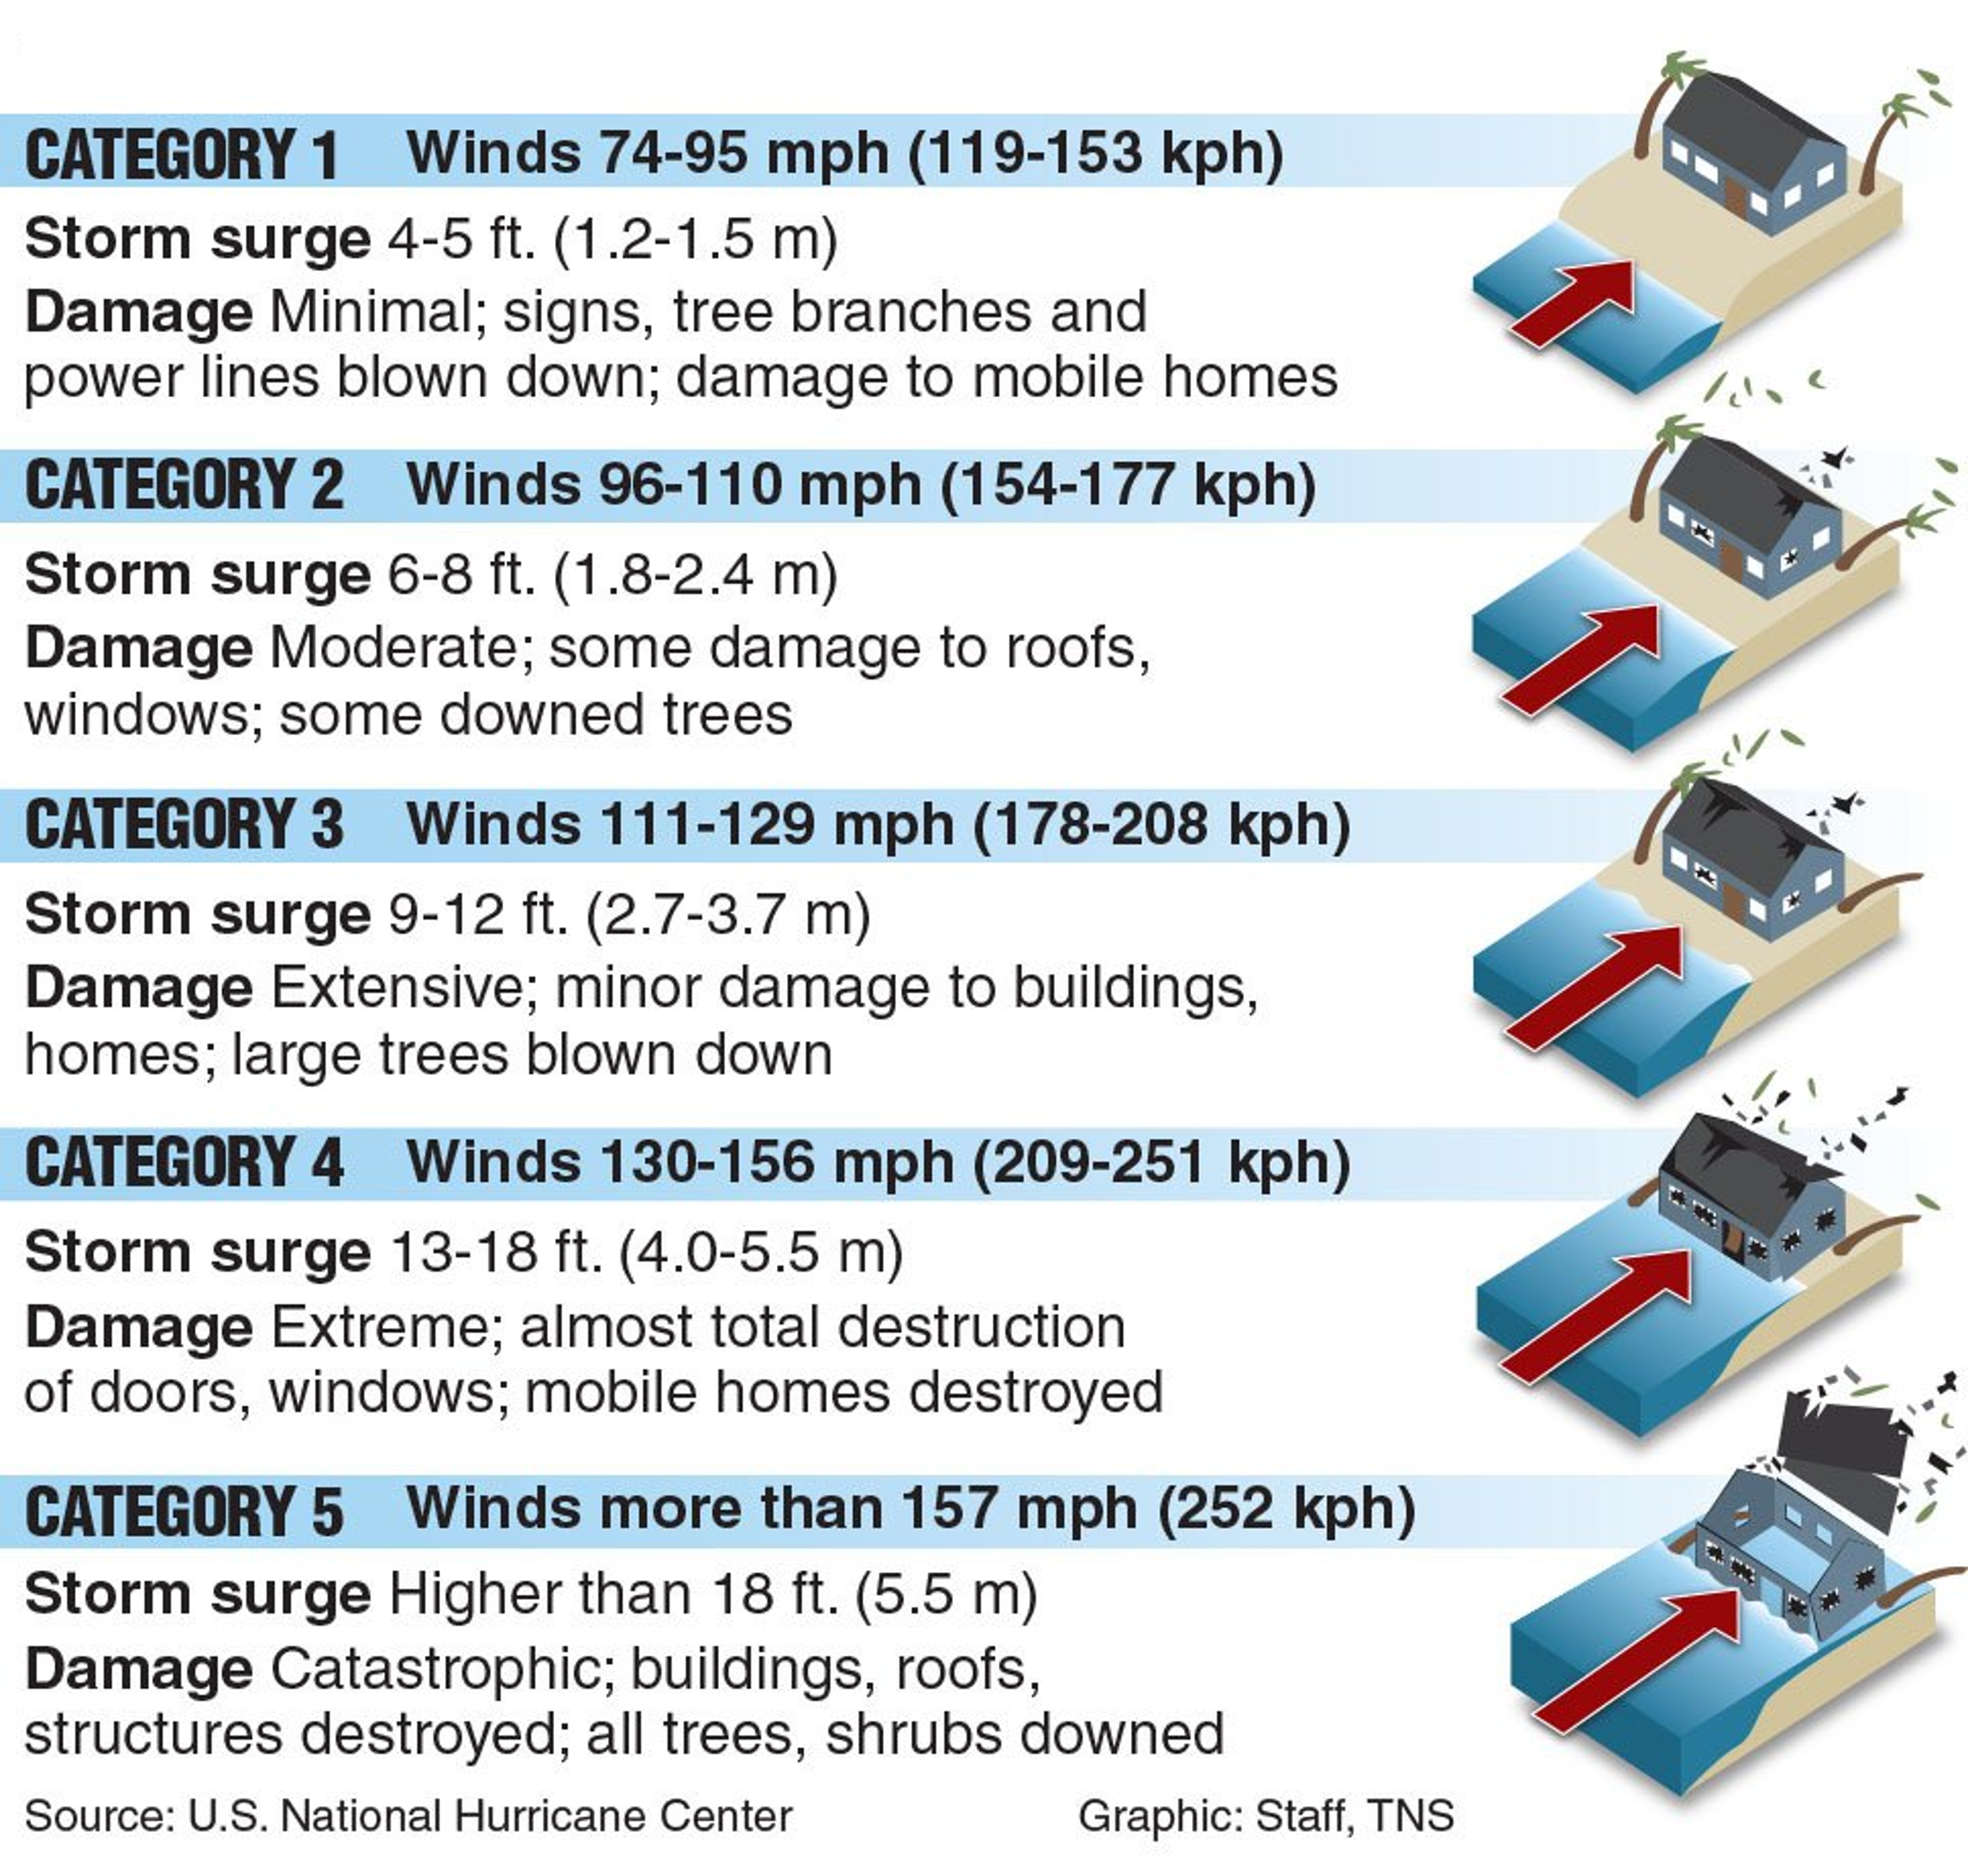
Hurricanes are assigned to categories based on their wind speed and estimated damage. The Saffir-Simpson scale was created to determine the strength and intensity of hurricanes. Just like the Fujita scale, it ranges from 1 to 5, with Category 5 being the strongest. The intensity of a hurricane increases as the atmospheric pressure near the eye decreases and the pressure-gradient force becomes steeper (atmospheric pressure decreases rapidly toward the eye), causing the winds to intensify, resulting in the potential for more damage.
For many years, hurricanes were named based on where they struck land. For example, the Galveston hurricane hit Galveston, Texas, in 1900. In the early 1900s, scientists started naming hurricanes using female names—clearly a sexist action by mostly white, male scientists at the time. But by the 1950s, the National Hurricane Center started naming hurricanes alphabetically, starting with the letter A and using male and female names. If the first year started the letter A with a female name, the following year, the first name would be male. The names are also determined six years in advance so that politics do not get involved with the naming of these deadly storms.
Hurricanes move with the prevailing winds. In the Northern Hemisphere, they originate in the trade winds and move to the west. When they reach the latitude of the westerlies, they switch direction and travel toward the north or northeast. Hurricanes may cover 800 km (500 mi) in one day.
Hurricanes typically last between five and ten days. Over cooler water or land, the hurricane’s latent heat source shut downs and the storm weakens. When a hurricane disintegrates, it is replaced with intense rains and tornadoes. There are about 100 hurricanes around the world each year, plus many smaller tropical storms and tropical depressions. As people develop coastal regions, property damage from storms continues to rise. However, scientists are becoming better at predicting the paths of these storms and fatalities are decreasing.
The National Hurricane Center (NHC) is the division of the United States’ National Oceanic and Atmospheric Administration (NOAA)/National Weather Service (NWS) responsible for tracking and predicting tropical weather systems between the prime meridian and the 140th meridian west poleward to the 30th parallel north in the northeast Pacific Ocean and the 31st parallel north in the northern Atlantic Ocean. Although the NHC is an agency of the United States, the World Meteorological Organization has designated it as the Regional Specialized Meteorological Center for the North Atlantic and eastern Pacific, making it the epicenter for tropical cyclone forecasts and observations occurring in these areas.

Damage from hurricanes comes from the high winds, rainfall, and storm surge. Storm surge occurs as the storm’s low-pressure center comes onto land, causing the sea level to rise unusually high. A storm surge is often made worse by the hurricane’s high winds blowing seawater across the ocean onto the shoreline. Flooding can be devastating, especially along low-lying coastlines such as the Atlantic and Gulf Coasts. Hurricane Camille in 1969 had a 7.3 m (24 ft) storm surge that traveled 200 km (125 mi) inland.
14.3.4 Winter Storms and Blizzards
Blizzards are dangerous winter storms that are a combination of blowing snow and wind, resulting in very low visibilities. While heavy snowfalls and severe cold often accompany blizzards, they are not required. Sometimes strong winds pick up snow that has already fallen, creating a ground blizzard. Officially, the National Weather Service defines a blizzard as a storm which contains large amounts of snow or blowing snow, with winds in excess of 35 mph and visibilities of less than a quarter-mile for an extended period of time (at least three hours).
Blizzards happen across the middle latitudes and toward the poles, usually as part of a mid-latitude cyclone. Blizzards are most common in winter, when the jet stream has traveled south and a cold, northern air mass comes into contact with a warmer, semitropical air mass. The very strong winds develop because of the pressure gradient between the low-pressure storm and the higher pressure west of the storm. Snow produced by the storm gets caught in the winds and blows nearly horizontally. Blizzards can also produce sleet or freezing rain.
Blizzards can create life-threatening conditions. Traveling by automobile can become difficult or even impossible due to “whiteout” conditions and drifting snow. Whiteout conditions occur most often with major storms that produce drier, more powdery snow. In this situation, it doesn’t even need to be snowing to produce whiteout conditions, as the snow already on the ground is blown around, reducing the visibility to near zero at times.
The strong winds and cold temperatures accompanying blizzards can combine to create another danger. The wind chill factor is the amount of cooling one feels due to the combination of wind and temperature. During blizzards, with the combination of cold temperatures and strong winds, very low wind chill values can occur. It is not uncommon in the Midwest to have wind chills below -60°F during blizzard conditions. Blizzards also can cause a variety of other problems. Power outages can occur due to strong winds and heavy snow. Pipes can freeze and regular fuel sources may be cut off.
14.3.5 Heat Waves
Another potentially deadly weather phenomena is a heat wave. A heat wave is different for different locations; it is a long period of hot weather, at least 86°F (30°C) for at least three days in cooler locations but much more in hotter locations. Heat waves can occur with or without high humidity. They have potential to cover a large area, exposing a high number of people to hazardous heat.
Heat waves form when a high-pressure area in the upper atmosphere strengthens and remains over a region for several days and up to several weeks. This traps heat near the Earth’s surface. It is usually possible to forecast heat waves, thus allowing authorities to issue a warning in advance. Heat waves have become more frequent and more intense over land, affecting almost every area on Earth since the 1950s.
Heat waves have an impact on the economy. They can reduce labor productivity, disrupt agricultural and industrial processes, and damage infrastructure. Severe heat waves have caused catastrophic crop failures and thousands of deaths from hyperthermia. They have increased the risk of wildfires in areas with drought. They can lead to widespread electricity outages because more air conditioning is used.
Heat poses danger to human health and there are a variety of heat related illnesses that can occur. During extremely hot and humid weather, your body’s ability to cool itself is challenged. When the body heats too rapidly to cool itself properly, or when too much fluid or salt is lost through dehydration or sweating, body temperature rises. You or someone you care about may experience a heat-related illness. It is important to know the symptoms of excessive heat exposure and the appropriate responses. The Centers for Disease Control and Prevention (CDC) provides a list of warning signs and symptoms of heat illness, and recommended first aid steps, which can be viewed here.

Take this quiz to check your comprehension of this section.
If you are using an offline version of this text, access the quiz for Section 14.3 via the QR code.
Summary
Weather is defined as the short-term atmospheric conditions at a specific time and place, influenced by variables like air temperature, pressure, and humidity. In contrast, climate refers to the long-term average weather patterns of a region, shaped by factors such as solar energy, geographic location, and altitude. Both weather and climate are directly affected by the Sun’s energy and how it interacts with the atmosphere. The troposphere, where nearly all weather occurs, is influenced by processes like convection and the greenhouse effect, which help trap heat and maintain the planet’s temperature balance. The atmosphere plays a vital in maintaining life on Earth by regulating temperature, supporting the water cycle, and protecting the planet from harmful solar radiation.
Key atmospheric processes such as the formation of clouds, precipitation, and the dynamics of air masses and weather fronts contribute to daily weather patterns and broader climate dynamics. The movement of air masses and the interactions at weather fronts play a critical role in shaping storms and other weather phenomena. Heat moves through various types of energy transfer including radiation, conduction, and convection.
Severe weather events like thunderstorms, tornadoes, hurricanes, and blizzards are driven by atmospheric instability, temperature differences, and moisture levels, with each event posing significant risks to both human life and property. It is important to understand these processes not only to predict weather more accurately but also to mitigate the effects of increasingly severe weather events exacerbated by climate change.

Take this quiz to check your comprehension of this chapter.
If you are using an offline version of this text, access the quiz for Chapter 14 via the QR code.
Text References
- Dastrup, R.A. (2020). Physical geography and natural disasters OER textbook: Salt Lake Community College. Creative Commons Attribution NonCommercial ShareAlike. Text adapted (remixed) by Laura Neser for clarification and formatting purposes only. https://slcc.pressbooks.pub/physicalgeography
- Estrada, C., Michel, C.L., Wilson, M., Simpson, Je., Santoro, M., and Megivern, K.J. (2021). Dynamic planet: Exploring geological disasters and environmental change OER textbook: Maricopa CommunityColleges. Creative Commons Attribution-NonCommercial-ShareAlike 4.0 International License. Text adapted (remixed) by Laura Neser for clarification and formatting purposes only. https://open.maricopa.edu/hazards/frontmatter/introduction
- National Oceanic & Atmospheric Administration, Severe weather. Public domain. https://www.nesdis.noaa.gov/our-environment/severe-weather
- National Oceanic & Atmospheric Administration, Winter storms and blizzards. Public domain. https://www.weather.gov/fgz/WinterStorms
- Solada, K., and Daniels, K.S. (2021). Principles of Earth science OER textbook: Open Oregon Educational Resources. Creative Commons Attribution-NonCommercial-ShareAlike 4.0 International License. Text adapted (remixed) by Laura Neser for clarification and formatting purposes only. https://openoregon.pressbooks.pub/earthscience
- Wikipedia, Heat wave. CC-BY-SA. https://en.wikipedia.org/wiki/Heat_wave
- Wikipedia, List of severe weather phenomena. CC-BY-SA. https://en.wikipedia.org/wiki/List_of_severe_weather_phenomena
- Wikipedia, National Hurricane Center. CC-BY-SA. https://en.wikipedia.org/wiki/National_Hurricane_Center
Figure References
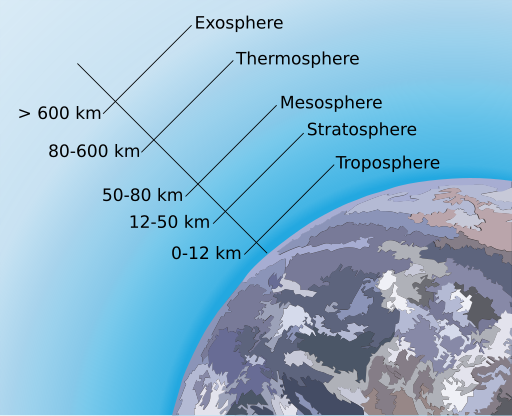
Figure 14.1: Layers of Earth’s atmosphere. Medium69. 2014. CC BY-SA. https://commons.wikimedia.org/wiki/File:Atmosphere_structure-en.svg
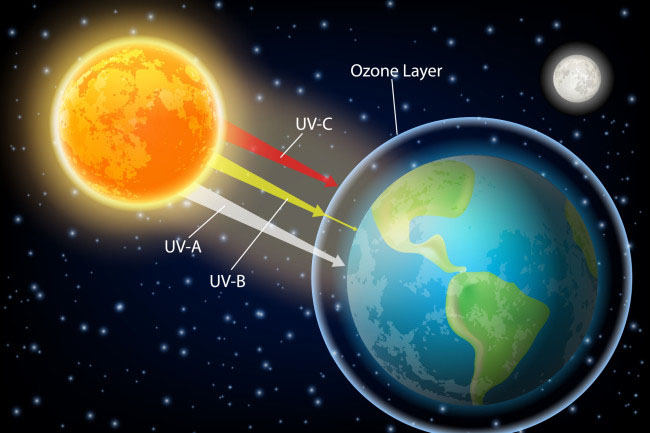
Figure 14.2: The ozone layer absorbs a portion of the radiation from the Sun, preventing it from reaching the planet’s surface. Felton Davis. 2020. CC BY. https://www.flickr.com/photos/felton-nyc/50768574522
Figure 14.3: Pie chart of Earth’s atmospheric composition. Dbc334. 2015. Public domain. https://commons.wikimedia.org/wiki/File:Composizione_dell%27atmosfera_terrestre.svg
Figure 14.4: Atmospheric pressure decreases as altitude increases. National Oceanic and Atmospheric Administration (NOAA). Last updated 18 December 2023. Public domain. https://www.noaa.gov/jetstream/atmosphere/air-pressure
Figure 14.5: Layers of Earth’s atmosphere with associated temperature changes. NOAA. Last updated Aug 20, 2024. Public domain. https://www.noaa.gov/jetstream/atmosphere/layers-of-atmosphere
Figure 14.6: Thermal profile of Earth’s atmosphere, showing the major divisions based on temperature. Benjamin J. Burger. 3 June 2020. CC BY-SA. https://commons.wikimedia.org/wiki/File:Thermal-Profile-of-Earths-Atmosphere.gif
Figure 14.7: Oscillations of electric and magnetic fields of an electromagnetic wave. Piotr Fita. 30 Jan 2023. Public domain. https://commons.wikimedia.org/wiki/File:Electromagnetic_wave_EN.svg
Figure 14.8: The percentage of diffusely reflected sunlight relative to various surface conditions. Wereon. 16 August 2006. CC BY-SA. https://en.wikipedia.org/wiki/Albedo#/media/File:Albedo-e_hg.svg
Figure 14.9: Solar radiation is strongest near the equator and weaker at the poles. Peter Halasz. 26 June 2007. CC BY-SA. https://commons.wikimedia.org/wiki/File:Oblique_rays_02_Pengo.svg
Figure 14.10: Earth’s greenhouse effect. EPA. 2012. Public domain. https://upload.wikimedia.org/wikipedia/commons/8/8e/Earth’s_greenhouse_effect_(US_EPA,_2012).png
Figure 14.11: Global distribution of relative humidity at the surface, averaged over the years 1981–2010. Greenmind1980. 4 July 2022. CC BY-SA. https://en.wikipedia.org/wiki/Humidity#/media/File:RH_wiki.png
Figure 14.12: Tropospheric clouds. Petr Hykš. 12 December 2018. CC BY-NC 2.0. https://www.flickr.com/photos/violetplanet/46239433602
Figure 14.13: Cloud types. Valentin de Bruyn. 3 January 2012. CC BY-SA. https://commons.wikimedia.org/wiki/File:Cloud_types_en.svg
Figure 14.14: Advection fog layer in San Francisco with the Golden Gate Bridge and skyline in the background. Brocken Inaglory. 26 September 2009. CC BY-SA. https://en.wikipedia.org/wiki/Fog#/media/File:San_francisco_in_fog_with_rays.jpg
Figure 14.15: North American air masses. NOAA. Last updated 5 June 2023. Public domain. https://www.noaa.gov/jetstream/synoptic/air-masses
Figure 14.16: Source regions of global air masses (NASA). NASA. 15 November 2008. Public domain. https://commons.wikimedia.org/wiki/File:Air_masses.svg
Figure 14.17: Guide to weather map symbols for weather fronts. -xfi-. 14 August 2006. Adapted by Laura Neser. CC BY-SA. https://commons.wikimedia.org/wiki/File:Weather_fronts.svg
Figure 14.18: Illustration of a warm front. Kelvinsong. 31 December 2014. CC BY-SA. https://commons.wikimedia.org/wiki/User:IsadoraofIbiza#/media/File:Warm_front.svg
Figure 14.19: Global map of the annually averaged near-surface air temperature from 1961 to 1990. Robert A. Rohde. 15 February 2008. Adapted by Laura Neser. CC BY-SA. https://commons.wikimedia.org/wiki/File:Annual_Average_Temperature_Map.jpg
Figure 14.20: Average air temperatures in New York City and San Francisco. Jturner20. 9 November 2021. Adapted by Laura Neser. CC BY-SA. https://commons.wikimedia.org/wiki/File:Ocean_influence_on_climate_at_four_example_locations.png
Figure 14.21: A thunderstorm with a classic anvil at the top. Griffinstorm. 16 August 2014. CC BY-SA. https://en.wikipedia.org/wiki/Thunderstorm#/media/File:Single-cell_Thunderstorm_in_a_No-shear_Environment..jpg
Figure 14.22: A diagram of thunderstorm formation. NOAA. 7 June 2010. Public domain. https://en.wikipedia.org/wiki/Thunderstorm#/media/File:Thunderstorm_formation.jpg
Figure 14.23: Some of the features to be found in a supercell storm. NOAA. Accessed September 2024. Public domain. https://www.nssl.noaa.gov/education/svrwx101/thunderstorms/types
Figure 14.24: F5 tornado (upgraded from initial estimate of F4) viewed from the southeast as it approached Elie, Manitoba, on June 22nd, 2007. Justin1569. 22 June 2007. CC BY-SA. https://en.wikipedia.org/wiki/Tornado#/media/File:F5_tornado_Elie_Manitoba_2007.jpg
Figure 14.25: A diagram of the location of Tornado Alley and the related weather systems. Dan Craggs. 18 September 2009. CC BY-SA. https://commons.wikimedia.org/wiki/File:Tornado_Alley_Diagram.svg
Figure 14.26: Tornadic supercell. NOAA. 4 April 2007. Public domain. https://commons.wikimedia.org/wiki/File:Tornadic_supercell.jpg
Figure 14.27: The enhanced Fujita scale (EF scale). National Weather Service. Accessed September 2024. Public domain. https://www.weather.gov/oun/efscale
Figure 14.28: Tropical cyclone Hurricane Florence in 2018 as viewed from International Space Station. NASA Goddard Space Flight Center. 12 September 2018. CC BY. https://en.wikipedia.org/wiki/Tropical_cyclone#/media/File:Dramatic_Views_of_Hurricane_Florence_from_the_International_Space_Station_From_9_12_(42828603210).jpg
Figure 14.29: Diagram of a tropical cyclone (hurricane) in the Northern Hemisphere. Kelvinsong. 16 December 2012. CC BY. https://en.wikipedia.org/wiki/Tropical_cyclone#/media/File:Hurricane-en.svg
Figure 14.30: The Saffir-Simpson hurricane wind scale is a 1 to 5 rating based on a hurricane’s sustained wind speed. Thomas Cizauskas. 8 September 2017. Public domain. https://www.flickr.com/photos/cizauskas/36294300853
Figure 14.31: The common paths of all tropical storms, based on all storm tracks available from the National Hurricane Center and the Joint Typhoon Warning Center through September 2006. NASA earth Observatory. Image of the Day for 2 November 2006. Public domain. https://earthobservatory.nasa.gov/images/7079/historic-tropical-cyclone-tracks
Figure 14.32: Hurricane Camille historical marker along US Route 29 and Virginia State Route 6 (Thomas Nelson Highway) near Woods Mill in Nelson County, Virginia. Famartin. 27 May 2016. CC BY-SA. https://commons.wikimedia.org/wiki/File:2016-05-27_09_07_16_Hurricane_Camille_historical_marker_along_U.S._Route_29_and_Virginia_State_Route_6_%28Thomas_Nelson_Highway%29_near_Woods_Mill_in_Nelson_County,_Virginia.jpg
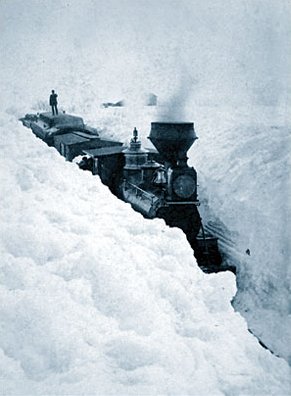
Figure 14.33: On March 29, 1881, snowdrifts in Minnesota were higher than locomotives. Minnesota Historical Society. 29 March 1881. Public domain. https://en.wikipedia.org/wiki/Blizzard#/media/File:Train_stuck_in_snow.jpg
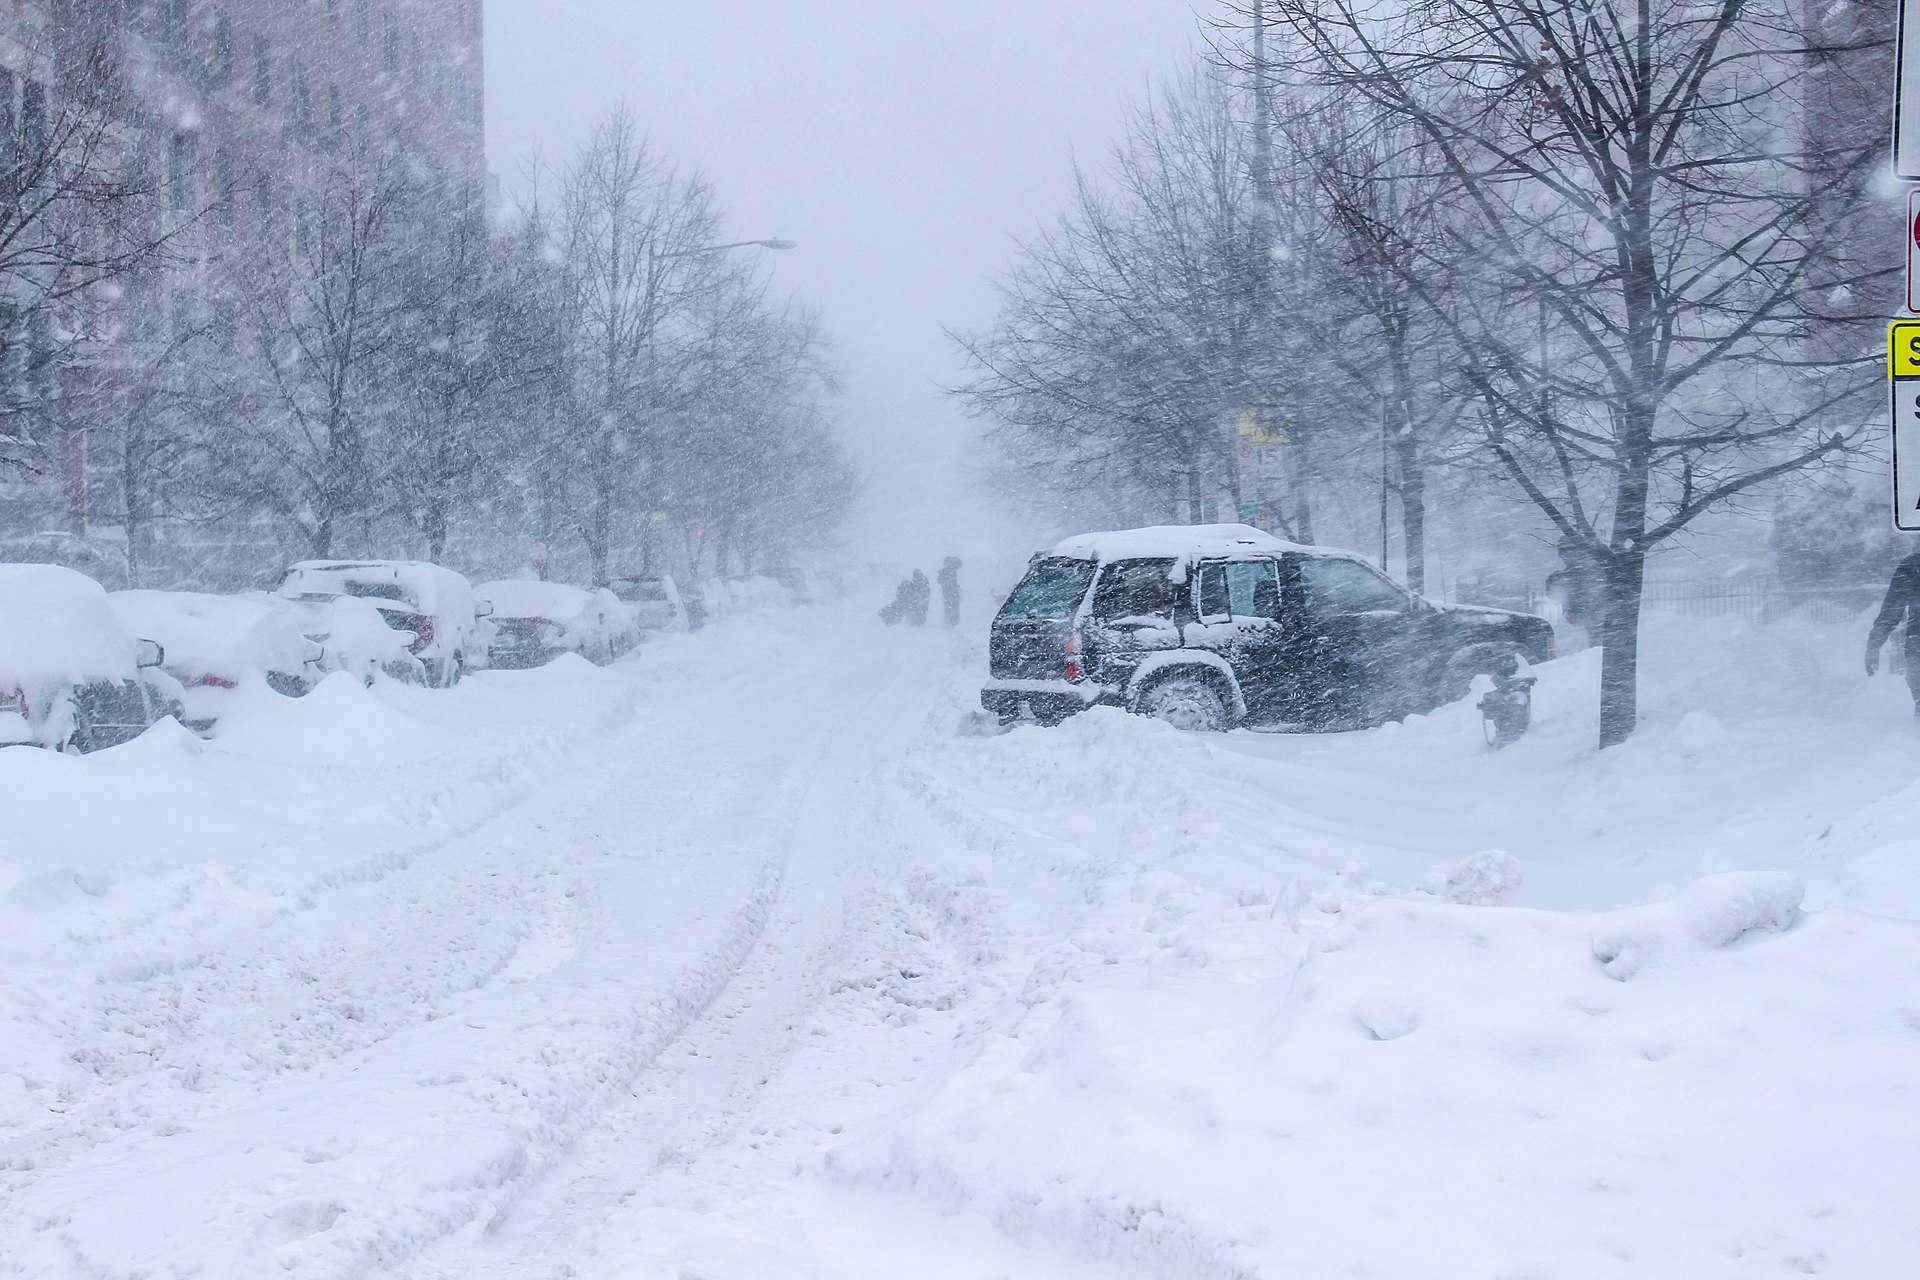
Figure 14.34: Heavy snow during the January 2016 United States blizzard. NOAA. 23 January 2016. CC BY. https://en.wikipedia.org/wiki/Blizzard#/media/File:Blizzard3_-_NOAA.jpg
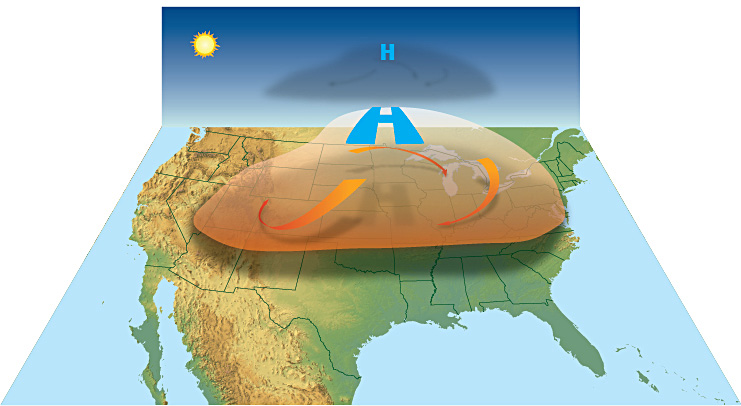
Figure 14.35: A high-pressure system in the upper atmosphere traps heat near the ground, forming a heat wave (for North America in this example). US National Weather Service/National Ocean Service. 21 July 2011. Public domain. https://en.wikipedia.org/wiki/Heat_wave#/media/File:Heat_Wave.jpg
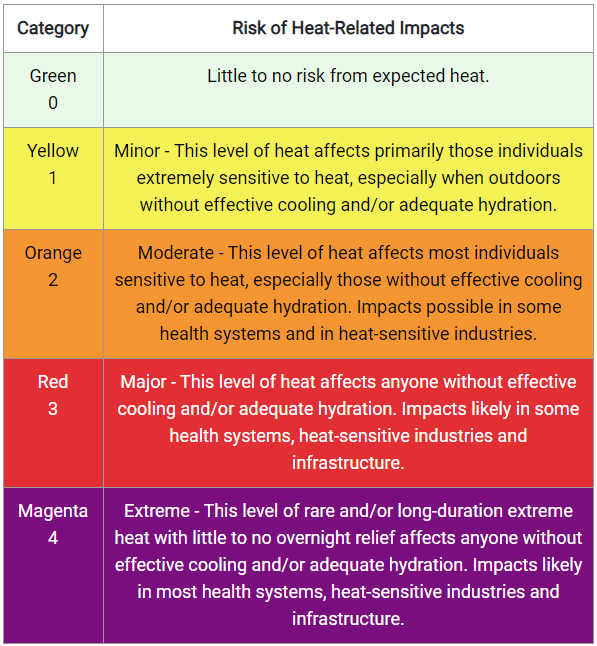
Figure 14.36: The National Weather Service risk categories for NWS HeatRisk. National Weather Service. Accessed September 2024. Public domain. https://www.wpc.ncep.noaa.gov/heatrisk
Figure Descriptions
Figure 14.1: Illustration of Earth as seen from space, with the layers of the atmosphere and their altitude ranges labeled along a straight line outward from Earth’s surface. The troposphere is closest to Earth’s surface, labeled 0-12 km; the stratosphere is above the troposphere, labeled 12-50 km; the mesosphere is above the stratosphere, labeled 50-80 km, the thermosphere is above the mesosphere, labeled 80-600 km, and the exosphere is the outermost layer, labeled greater than 600 km.
Figure 14.2: Illustration of the Sun on the left and Earth on the right with three colored arrows of different lengths pointing from the Sun to Earth. The lowermost arrow is white, labeled UV-A, and extends through Earth’s atmosphere to Earth’s surface; the middle arrow is yellow, labeled UV-B, and extends to a layer above Earth’s surface labeled Ozone Layer with a smaller yellow arrow traveling through the Ozone layer to the surface of Earth; and the top arrow is red, labeled UV-C, and extends to the top of the Ozone Layer.
Figure 14.3: A color-coded pie chart showing the percentage of Earth’s atmospheric gases. 78% of the pie chart is orange for nitrogen, 21% is purple for oxygen, 1% is gray for argon, less than 1% is teal for carbon dioxide, and less than 1% is navy blue for other gases.
Figure 14.4: Photograph of a desert area with an expanse of blue sky above the area; the image is split in half vertically and the left half has a partially transparent overlay of tan cartoon bubbles with a higher density of bubbles at the bottom, decreasing in density upwards.
Figure 14.5: Graph with temperature along the bottom horizontal axis labeled Temperature in degrees Celsius that goes from more than -100 on the left to over 60 on the right. The vertical axes represent altitude above Earth’s surface with the left vertical axis labeled from 0 upward to 130 km above the surface and the right vertical axis labeled from 0 upward to 81 mi above the surface. The temperature is plotted as a yellow arrow that increases in altitude; at 0 km altitude, the arrow starts at about 18 degrees Celsius, decreasing in temperature upward until 12 km where it reaches about -58 degrees Celsius, and this section is labeled Troposphere with the Tropopause labeled at its top. The yellow arrow continues upward vertically until about 20 km altitude, then begins increasing in temperature until it reaches about 0 degrees Celsius at 50 km altitude and this section is labeled Stratosphere with the Stratopause labeled at its top. The yellow arrow continues upward vertically until about 52 km altitude, then begins decreasing in temperature until it reaches about -90 degrees Celsius at 80 km altitude and this section is labeled Mesosphere with the Mesopause labeled at its top. The yellow arrow continues upward vertically until about 90 km altitude, then begins rapidly increasing in temperature until it reaches over 70 degrees Celsius at 120 km altitude with the arrow pointing off the graph and this section is labeled Thermosphere.
Figure 14.6: Graph with temperature along the bottom horizontal axis that goes from colder on the left to warmer on the right. The vertical axis is labeled altitude. The temperature is plotted as a black curved line; at the bottom of the graph, the line starts just to the right of the center of the horizontal axis, decreasing in temperature with altitude in a section labeled Troposphere until the Tropopause labeled at its top. The black line then curves toward the right, increasing in temperature in a section labeled Stratosphere until the Stratopause labeled at its top. The black line then begins decreasing in temperature in a section labeled Mesosphere until it reaches the Mesopause labeled at its top. The black line then begins increasing in temperature in a section is labeled Thermosphere until it reaches the top of the graph.
Figure 14.7: Color-coded line graph with with two perpendicular waves that oscillate in unison: a red horizontal sine wave labeled magnetic field and a blue vertical sine wave labeled electric field. The line axis goes from left to right, indicating the waves’ propogation direction to the right.
Figure 14.8: A pink chart that is labeled % along the left vertical side, going from 0 at the bottom to 100 at the top. Various surface conditions are plotted with double-pointed vertical blue arrows as follows: on the far left is forms of water, with snow plotted from 40 to 85% and fresh snow labeled near the top and old snow labeled near the bottom; ice from 32-39%; and water from 6-9%. To the right of those arrows is dry sand from 38 to 44% and wet sand from 7 to 14. To the right of those arrows is dry soil from 22 to 34% and dark wet soil from 6 to 14%. To the right is an arrow from 36 to 78% with cumulus stratus labeled near the top and stratus labeled near the bottom; an arrow from 27-29% labeled desert; an arrow from 18-19% labeled savanna; and an arrow from 6 to 14% labeled forest. To the right of those arrows is altostratus cirrus from 41 to 59% and meadows from 11 to 19%.To the right of those arrows is crops from 15 to 25%.
Figure 14.9: Cartoon of the Earth in the lower right corner with a lavender shell around it labeled atmosphere and white outer space outside of that; the Sun is just barely showing to the left of the figure. There are three red horizontal arrows pointing from the Sun to the upper part of Earth labeled sun’s rays, and the arrows span a circle on Earth’s surface labeled large area. There are three other red horizontal arrows pointing from the Sun to the equatorial part of Earth labeled sun’s rays, and the arrows span a smaller circle on Earth’s surface labeled small area.
Figure 14.10: A cartoon of the Earth at the bottom of the figure and the Sun in the upper left. Two lines of blocky arrows point from the Sun to the Earth; one line consists of thicker blocky arrows reaching the Earth’s surface, labeled Most radiation is absorbed by the Earth’s surface and warms it. The set of lines to the right are thinner, labeled Some solar radiation is reflected by the Earth and the atmosphere; the line of arrows divides into two sets when they enter Earth’s atmosphere with one set reflecting from the middle of the atmosphere and the other set reflecting from the Earth’s surface. There is a very thick curved arrow that exits from Earth’s surface, makes a U-turn in the atmosphere, and then points back to Earth’s surface, labeled Infrared radiation is emitted by the Earth’s surface.
Figure 14.11: World map color-coded according to relative humidity; the legend shows a color gradient with light bluish yellow representing approximately 30% humidity and navy blue representing 100% humidity. There are dark blue areas at the poles on the map and lighter areas everywhere else; notable regions with the lowest humidities include northern Africa, the Middle East, Australia, southwestern South America, and southwestern North America.
Figure 14.12: An illustrated chart of common cloud types depicted against a blue sky with brown land at the bottom, arranged in three categories based on their altitude. High clouds are the top row with cirrostratus depicted as thin, veil- like layers, cirrus depicted as thin, wispy streak, and cirrocumulus depicted as small, fluffy patches. Medium clouds are the middle row with altocumulus depicted as white slightly larger puffy clusters and altostratus depicted as a uniform, whitish sheet. Low clouds are the bottom row with stratocumulus depicted as low, lumpy layers, stratus depicted as flat, uniform gray layers near the surface, nimbostratus depicted as thick, dark rain clouds, and cumulus depicted as puffy, gray-white clouds with flat bases. One type of cloud spans low, medium, and high, labeled cumulonimbus, which has thick gray stormy clouds near the surface, thinning out to white clouds above, and spreading to a white anvil-shape with lightning at the top.
Figure 14.13: An illustrated chart of common cloud types depicted against a blue sky with green land at the bottom, arranged in three categories based on their altitude. High clouds are the top row at 23,000 to 40,000 feet altitude with cirrostratus (Cs) depicted as thin, veil-like layers, cirrus (Ci) depicted as thin, wispy streak, and cirrocumulus (Cc) depicted as small, fluffy patches. Mid clouds are the middle row at 6,500 to 23,000 feet altitude with altocumulus (Ac) depicted as white slightly larger puffy clusters and altostratus (As) depicted as a uniform, whitish sheet. Low clouds are the bottom row at 0 to 6,500 feet altitude with stratocumulus (Sc) depicted as lumpy layers, stratus (St) depicted as flat, low layers near the surface, cumulus (Cu) depicted as puffy, gray-white clouds with flat bases, and nimbostratus (Ns) spanning both Low and Mid levels depicted as thick, dark rain clouds. One type of cloud spans low, medium, and high, labeled cumulonimbus (Cb), which has thick gray stormy clouds near the surface, thinning out to white clouds above, and spreading to a white anvil-shape with lightning at the top.
Figure 14.14: Photograph of low-lying thick white cloud cover with the Golden Gate Bridge visible in the background rising out of the fog.
Figure 14.15: Grayscale illustration of the upper half of Earth with a grid overlain and colored partially transparent air masses labeled on top. The North pole is covered by a pink nearly circular air mass labeled Ca; there is a curved blue line with teeth pointing southward labeled Arctic Front around the southern border of the Ca air mass over northern North America. Just south of the curved blue line is a navy-blue air mass labeled cP that covers most of Canada with blue arrows pointing southward from the air mass. South of the cP air mass is another blue line with teeth pointing southward labeled Polar Front from the air mass; south of the blue line is a small orange air mass labeled cT in southwest North America. There are two light blue air masses labeled mP, one over the Pacific Ocean off the Pacific northwest coast of North America, and the other over the Atlantic Ocean off the northeast coast of North America. Lastly, there are two green air masses labeled mT, one over the Pacific Ocean off the Pacific southwest coast of North America, and the other over the Atlantic Ocean off the southeast coast of North America.
Figure 14.16: A world map with a grid overlain and color-coded air masses labeled on top. Navy-blue areas are labeled cA and/or cP, located over Antarctica, Greenland, northern North America, and north-central Asia. Light blue areas are labeled mP, located over the northern Atlantic Ocean, northern Pacific Ocean, southern Atlantic Ocean, and southern Pacific Ocean. Pink areas are labeled mT, located over the mid-northern Atlantic Ocean, mid- northern Pacific Ocean, mid-southern Atlantic Ocean, and mid-southern Pacific Ocean. Dark pink areas are labeled mE, located over the mid- Atlantic Ocean and mid-Pacific Ocean. Red areas are labeled cT, located over northern Africa and the Middle East, south-central Africa, central Australia, and west-central North America.
Figure 14.17: Four horizontal lines with triangles and/or semicircles along the length of each line according to the type of front. The top line has alternating red semicircles on top and blue triangles pointing downward, labeled stationary front. The second line has blue triangles on top pointing upward, labeled cold front. The third line has red semicircles on top, labeled warm front. The bottom line is purple and has alternating purple semicircles on top and purple triangles on top pointing upward, labeled occluded front.
Figure 14.18: Block diagram of thick white clouds hovering over green land with a blue sky in the background. There is a red line in front of the clouds with red semicircles along the line pointing toward the clouds labeled warm front. In front of that line are red arrows pointing in the direction of the clouds labeled Warm air mass (mT). The front portion of the clouds is labeled Rising warm air, and the clouds include the labels of specific cloud types within them including stratus and nimbostratus at the front, altostratus in the middle, and cirrostratus and cirrus at the back of the set of clouds; stratocumulus clouds are visible separately in front of the heavy cloud cover. The back side of the cloud cover is labeled Receding cold air, with a blue Cold air mass (cP) located there.
Figure 14.19: World map color-coded according to temperature; the legend shows a color gradient with light pink to white representing approximately -50 degrees Celsius, changing to deep blue around -25 degrees Celsius, light blue at 0 degree Celsius, yellow to orange from 10-15 degrees Celsius, and red up to 30 degrees Celsius. In terms of extremes, there is only one whitish-pink area over part of Antarctica, there are two dark blue areas at the poles on the map, and red areas cover the equator toward the midlatitudes.
Figure 14.20: Graph with temperature in degrees Celsius along the vertical axis from 0 at the bottom to 30 at the top. The months of the year are along the horizontal axis, starting with January at the left and December at the right. Two locations are plotted: New York is in red, starting at nearly 0 degrees in January, increasing smoothly to about 25 degrees in July, then decreasing to about 4 degrees in December; San Francisco is in blue, starting at 10 degrees in January, increasing slightly to about 17 degrees in September, then decreasing slightly to 10 degrees in December.
Figure 14.21: Photograph of a massive white cloud in the distance that includes smaller fluffy clouds at the base and a thick vertical column that rises upward, spreading into a wide flat top. There is a road and trees in the foreground.
Figure 14.22: A set of three diagrams showing the land surface at the bottom and altitude labeled upward to over 40,000 feet. The first diagram on the left is labeled towering cumulus stage and features a fluffy white cloud with a flat base at approximately 5,000 feet altitude and the top at approximately 19,000 feet altitude; there are three yellow arrows rising from the ground upward into the cloud and there is a nearly horizontal dashed line crossing near the top of the cloud labeled 0 degrees Celsius. The second diagram in the middle is labeled mature stage and features a towering high cloud with a flat base at approximately 5,000 feet altitude and the top at over 40,000 feet altitude; on the right half of the cloud there are many yellow arrows rising from the ground upward into the cloud and on the left half of the cloud there are yellow arrows pointing from the top of the cloud downward toward the ground where rain is occurring. There is a curvy dashed line crossing the cloud at approximately 15,000 feet altitude labeled 0 degrees Celsius. The third diagram on the right is labeled dissipating stage and features a high cloud with a curved base at approximately 22,000 feet altitude and a flat top at over 40,000 feet altitude; there are multiple yellow arrows pointing from the cloud downward toward the ground where rain is occurring and a few yellow arrows pointing up and to the right near the top of the cloud. There is a nearly horizontal dashed line below the cloud at approximately 15,000 feet altitude labeled 0 degrees Celsius.
Figure 14.23: Photograph of a massive set of clouds in the distance that includes smaller fluffy clouds at the base labeled flanking line, spreading into a single large wide cloud labeled cumulonimbus, with a smaller fluffy cloud on the top labeled overshooting top. The bottom of the set of clouds is labeled wall cloud and there is a tornado visible coming off the bottom; there is also rain and/or hail falling from the center base of the set of clouds. There is a road and a green field in the foreground.
Figure 14.24: Photograph of a whitish grey funnel cloud rising from the ground upward into the dark grey clouds above; there are visible bits of debris flying around the base of the tornado.
Figure 14.25: Map of the United States with color-coded weather systems overlain; there is a blue area labeled cold dry air over the northwest-central U.S. with an arrow pointing southeast toward the central U.S. An orange area labeled warm dry air is over the southwest U.S. with an arrow pointing east-northeast toward the central U.S. A light green area labeled warm moist air is over the southern U.S. with an arrow pointing northward toward the central U.S. A red area labeled tornado alley covers the central U.S. where the arrows converge.
Figure 14.26: A diagram of a towering cloud with mid-level winds entering from the left at an altitude of 10,000 to 20,000 feet and upper-level winds entering from the left at an altitude of 40,000 to 60,000 feet. There are spiraled arrows rising from the ground through the center of the cloud complex, exiting through the over shooting top. A tornado is drawn at the base of those arrows.
Figure 14.27: A two-column chart describing the Enhanced Fujita (EF) Scale with the left column titled EF Rating and the right column titled 3 Second Gust (mph). EF rating 0 corresponds with 65-85 mph 3 second gusts; EF rating 1 corresponds with 86-110 mph 3 second gusts; EF rating 2 corresponds with 111-135 mph 3 second gusts; EF rating 3 corresponds with 136-165 mph 3 second gusts; EF rating 4 corresponds with 166-200 mph 3 second gusts; and EF rating 5 corresponds with over 200 mph 3 second gusts.
Figure 14.28: Photograph of part of the Earth as seen from space with a massive, swirling cloud system with a well-defined, circular eye at its center, with parts of the International Space Station visible on the left-hand side of the photo.
Figure 14.29: Cartoon diagram of a hurricane cloud system in the northern hemisphere cut vertically in half to show the structure. There is a column of white cloud at the center labeled eye wall with blue arrows decreasing along the outer edge labeled cold falling air; a spiraling pink arrow points upward through the empty middle, labeled eye; the eye wall widens at its top to a flat- topped cloud labeled outflow cirrus shield. Surrounding the eye wall are three separate circular bands of clouds labeled rain bands, with pink arrows rising through each labeled warm rising air. The storm rotation is counterclockwise.
Figure 14.30: A chart describing the Saffir-Simpson Hurricane Wind Scale categories from 1 to 5 in text along with graphics showing the extent of damage. Category 1 is described as having wind speeds of 74-95 mph with a storm surge of 4-5 feet, causing minimal damage. Category 2 is described as having wind speeds of 96-110 mph with a storm surge of 6-8 feet, causing moderate damage. Category 3 is described as having wind speeds of 111-129 mph with a storm surge of 9-12 feet, causing extensive damage. Category 4 is described as having wind speeds of 130-156 mph with a storm surge of 13-18 feet, causing extreme damage. Lastly, Category 5 is described as having wind speeds of 157+ mph with a storm surge of higher than 18 feet, causing catastrophic damage.
Figure 14.31: A world map with grey continents and dark blue oceans, with the tracks of tropical storms overlain, color-coded by their intensity. Tropical depressions are blue, tropical storms are cyan, category 1 hurricanes are light yellow, category 2 are yellow, category 3 are marigold, category 4 are orange, and category 5 are red. The areas covered by these tracks include the following parts of the Pacific Ocean: a dense, large set of tracks off the eastern coast of Asia with all colors represented; off the eastern coast of Australia with all colors except red represented; and off the western and southwestern coast of North America with all colors represented. The northern half of the Atlantic Ocean is nearly completely covered by storm tracks with all colors represented. The Indian Ocean is covered in both its northern and southern ends by storm tracks. There is one minor storm track off the east coast of South America.
Figure 14.32: Photograph of a historic marker sign titled R 51 Hurricane Camille with the following text: on 20 Aug. 1969, torrential rains, following remnants of Hurricane Camille, devastated this area. A rainfall in excess of 25 inches, largely within a five-hour period, swept away or buried many miles of roads, more than 100 bridges, and more than 900 buildings. 125 people died in Nelson County. The damage totaled more than $100,000,000, and Virginia was declared a disaster area.
Figure 14.33: Old photograph of a black train with white snow drifts on either side rising above the top of the train; a man in black stands on one of the train cars.
Figure 14.34: Photograph of a snow-covered part of a city with cars parked along either side of the street, covered in snow, and bare trees lining either side of the snow-covered road. A few people are barely visible in the distance due to the snowy conditions.
Figure 14.35: A diagram drawn in the style of a shadow box with a map of the United States and part of Mexico and Canada laying on the bottom of the shadow box with blue sky and sunshine on the background of the shadow box. There is a large, orange-shaded bubble covering a large portion of the interior of the United States labeled H, with three curved orange arrows circulating in a clockwise manner within the bubble.
Figure 14.36: A two-column chart describing the risk categories for people experiencing heat with the left column titled Category and the right column titled Risk of Heat-Related Impacts; each row is color-coded. The top row is Green Category 0 with little to no risk from expected heat. The second row is Yellow Category 1 with minor risk; this level of heat affects primarily those individuals extremely sensitive to heat, especially when outdoors without effective cooling and/or adequate hydration. The third row is Orange Category 2 with moderate risk; this level of heat affects most individuals sensitive to heat, especially those without effective cooling and/or adequate hydration; impacts possible in some health systems and in heat- sensitive industries. The fourth row is Red Category 3 with major risk; this level of heat affects anyone without effective cooling and/or adequate hydration; impacts likely in some health systems, heat-sensitive industries and infrastructure. The fifth final row is magenta Category 5 with extreme risk; this level of rare and/or long-duration extreme heat with little to no overnight relief affects anyone without effective cooling and/or adequate hydration; impacts likely in most health systems, heat-sensitive industries and infrastructure.
Current conditions within the atmosphere.
The science concerned with the Earth's atmosphere and its physical processes.
Long-term averages and variations within the conditions of the atmosphere.
Waves bouncing off of a boundary between mediums of different properties.
The amount of light that is reflected off of an object, measured on a scale of 0 (absorbs all light) to 1 (reflects all light).
A form of potential energy stored in the bonds of chemical compounds and released during a chemical reaction.
The ability for the atmosphere to absorb heat that is emitted by a planet's surface.

.png)
.jpg)