The Earth’s Mosaic: Land Use and Land Cover
Earth Mosaic Activity Overview
In this activity, your group will explore:
- Geography and Geographic Terms
- Land Use and Land Cover
- Introduction to Remote Sensing
We’ll be viewing satellite imagery of the earth to learn more about land use and land cover. The travels of your Virginia Geocoin will give us the locations to study. (For more on the Virginia Geocoin, be sure to read the Getting Started Guide.)
Tiles of the Earth Mosaic
Imagine you are a flying superhero, and not only do you have perfect eyesight, but you also have super vision that allows you to see in the dark, tell how hot or cold something is, or even see what’s inside a forest without walking into it! With your amazing superhero vision, you’re now ready to become a remote sensing expert! Remote sensing is a science that sees and scans the Earth’s surface from above to learn more about it.
Remote Sensing: gathering information about something without being close to the object of study. Here, we apply remote sensing to study the earth’s surface from above: using airplanes or satellites equipped with sensors.
Land Use: The human use of land. Some examples of different human land uses would be industrial, commercial, agricultural, and residential.
Land Cover: The physical features that cover land. Some examples would be forested, grassland, agricultural, urban, water, and others.
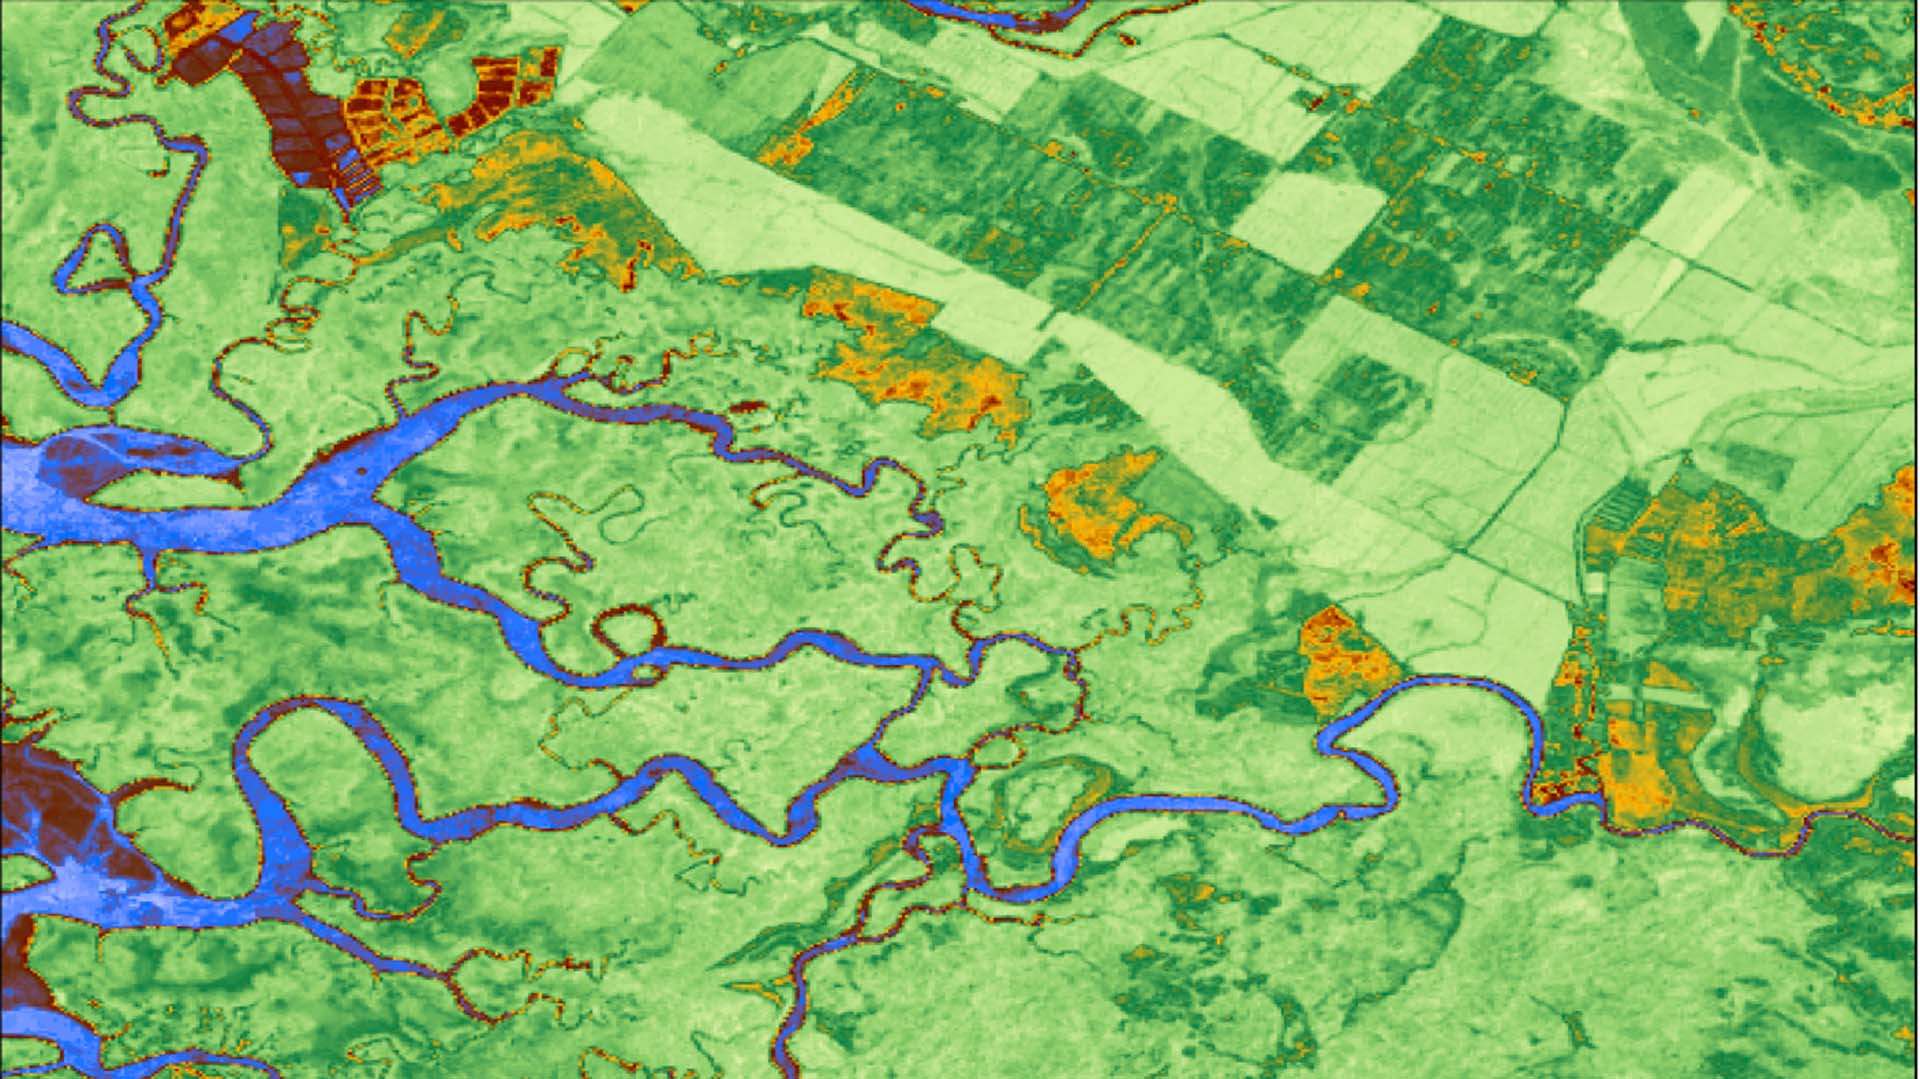
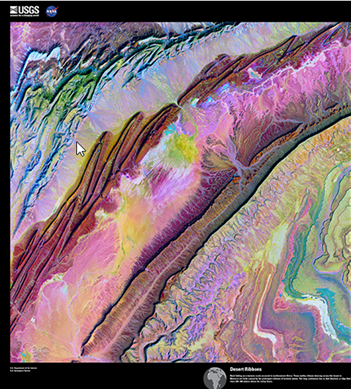
Scientists use remote sensing to see the land cover, and with this information, we can figure out the land use as well. From way up above, the Earth’s surface looks like a patchwork quilt made up of different shades of brown and green, even different shapes! We call this an aerial mosaic, and each ‘tile’ has its own land cover and land use. To see some cool aerial mosaics, check out the gallery at the USGS Earth as Art webpage https://eros.usgs.gov/media-gallery/earth-as-art.
Exploring Land Use and Land Cover
We are going to compare the land use and land cover in your community with a place where your Virginia Geocoin has traveled. By doing this, we will be taking a quick look at two “tiles” in the earth’s mosaic of different land uses. We can use the information we gather by looking at imagery to discuss differences between places and changes over time.
Note to Leaders: Make sure your Geocoin has traveled to at least one new place before starting this activity.
Required Software: Ensure Google Earth Pro for desktop has been installed before beginning the activity. You can download the desktop version at www.google.com/earth/about/versions/. For a primer on how to navigate Google Earth, download the Google Earth tutorial from virginiaview.cnre.vt.edu/tutorials/.
Activity Charts: There are a few activity charts for students to fill out. These can be found on the Google site inside of the “Land Use and Land Cover” folder: https://drive.google.com/drive/folders/1PtWUuT1bIQuzseJ92EtNXtXOPr8l_mZZ?usp=sharing. Please make as many copies as need for your class, and feel free to modify the copied versions for your class needs.
Let’s Get Started!
- Log in to www.geocaching.com/play with the account you used when you dropped off the geocoin.
- From the ‘Play’ dropdown menu, select ‘Trackables’ (Figure 5.3).
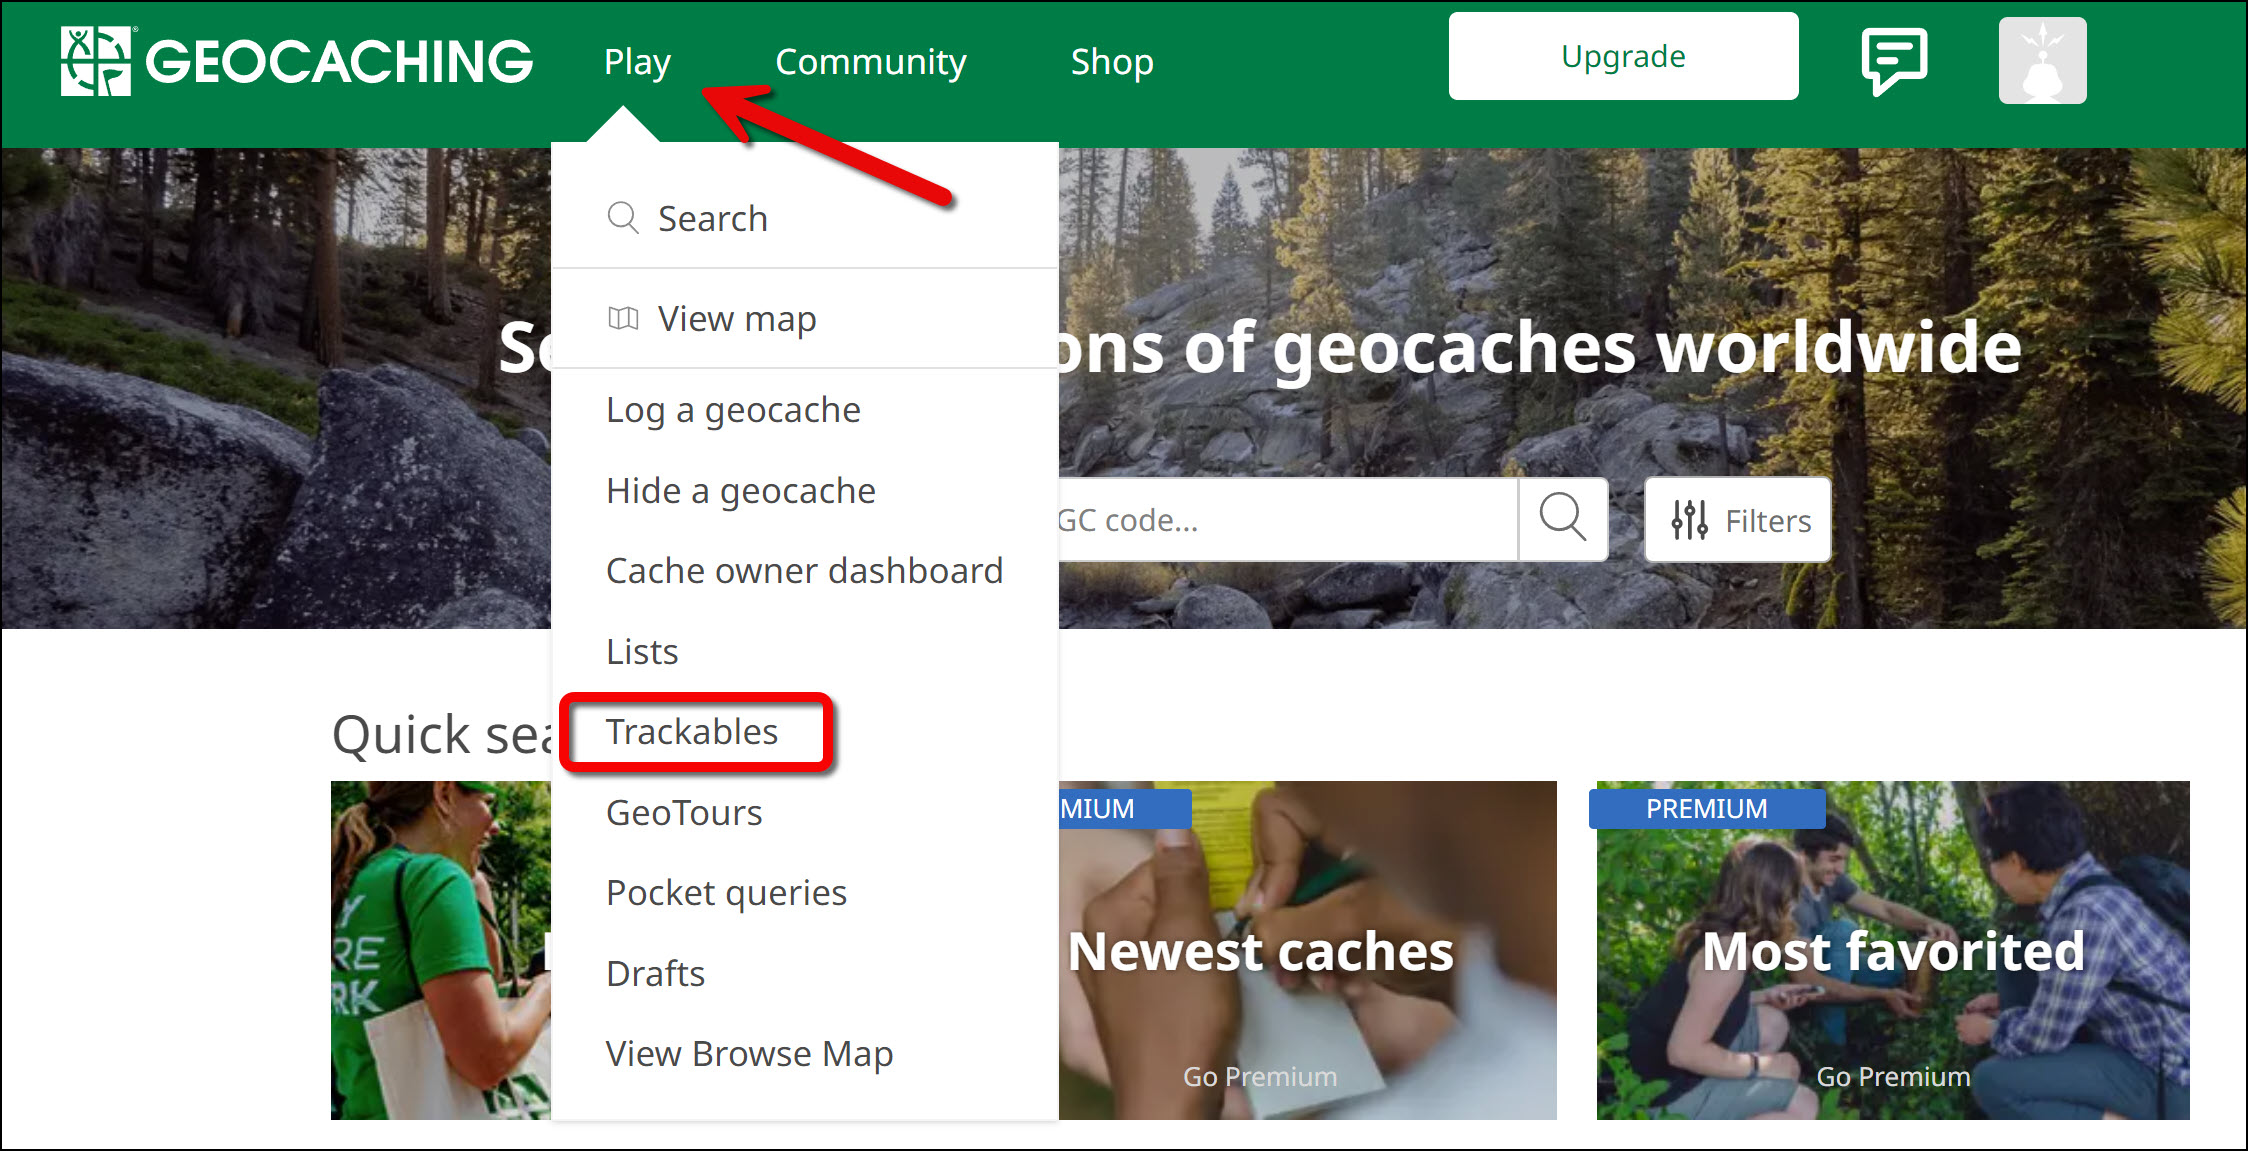
Figure 5.3: Geocaching website page displaying ‘Play’ dropdown menu with ‘Trackables’ emphasized. - Enter the tracking code printed on the trackable (ex: XX234XX).
- Note: Once the secret tracking code is entered, a ‘nickname number’ will appear on the webpage to reference the geocoin. The nickname number is okay to share with others.
- From the geocoin’s log page, click on ‘View in Google Earth’ under the Trackable Options menu (Figure 5.4). This will generate a KML file for you to download to your computer.
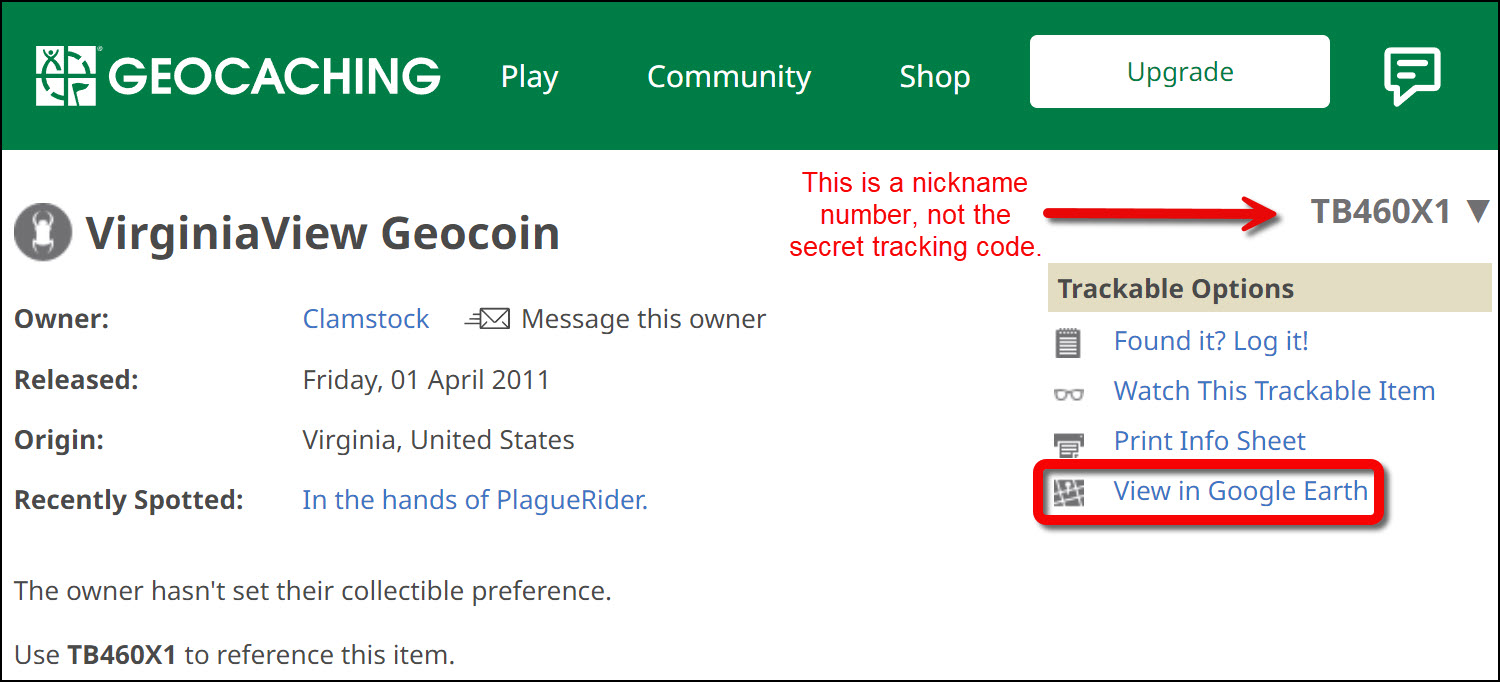
Figure 5.4: Geocoin log page emphasizing ‘View in Google Earth’ link. - After downloading the KML file to your computer, double click on the file to open it with Google Earth Pro for desktop. You should now see yellow tracks on the map and tracks for your geocoin listed on the left-hand menu.
- Now you can zoom in to each stop on your geocoin’s journey. Be sure not to forget the starting location (your community) as you answer the following questions!
- You’ll also want to play with the historical imagery on Google Earth. While zooming in to a point, click on the Clock symbol at the top menu bar. This brings up the time slider and you can view one or more historical images by dragging and sliding (Figure 5.5).
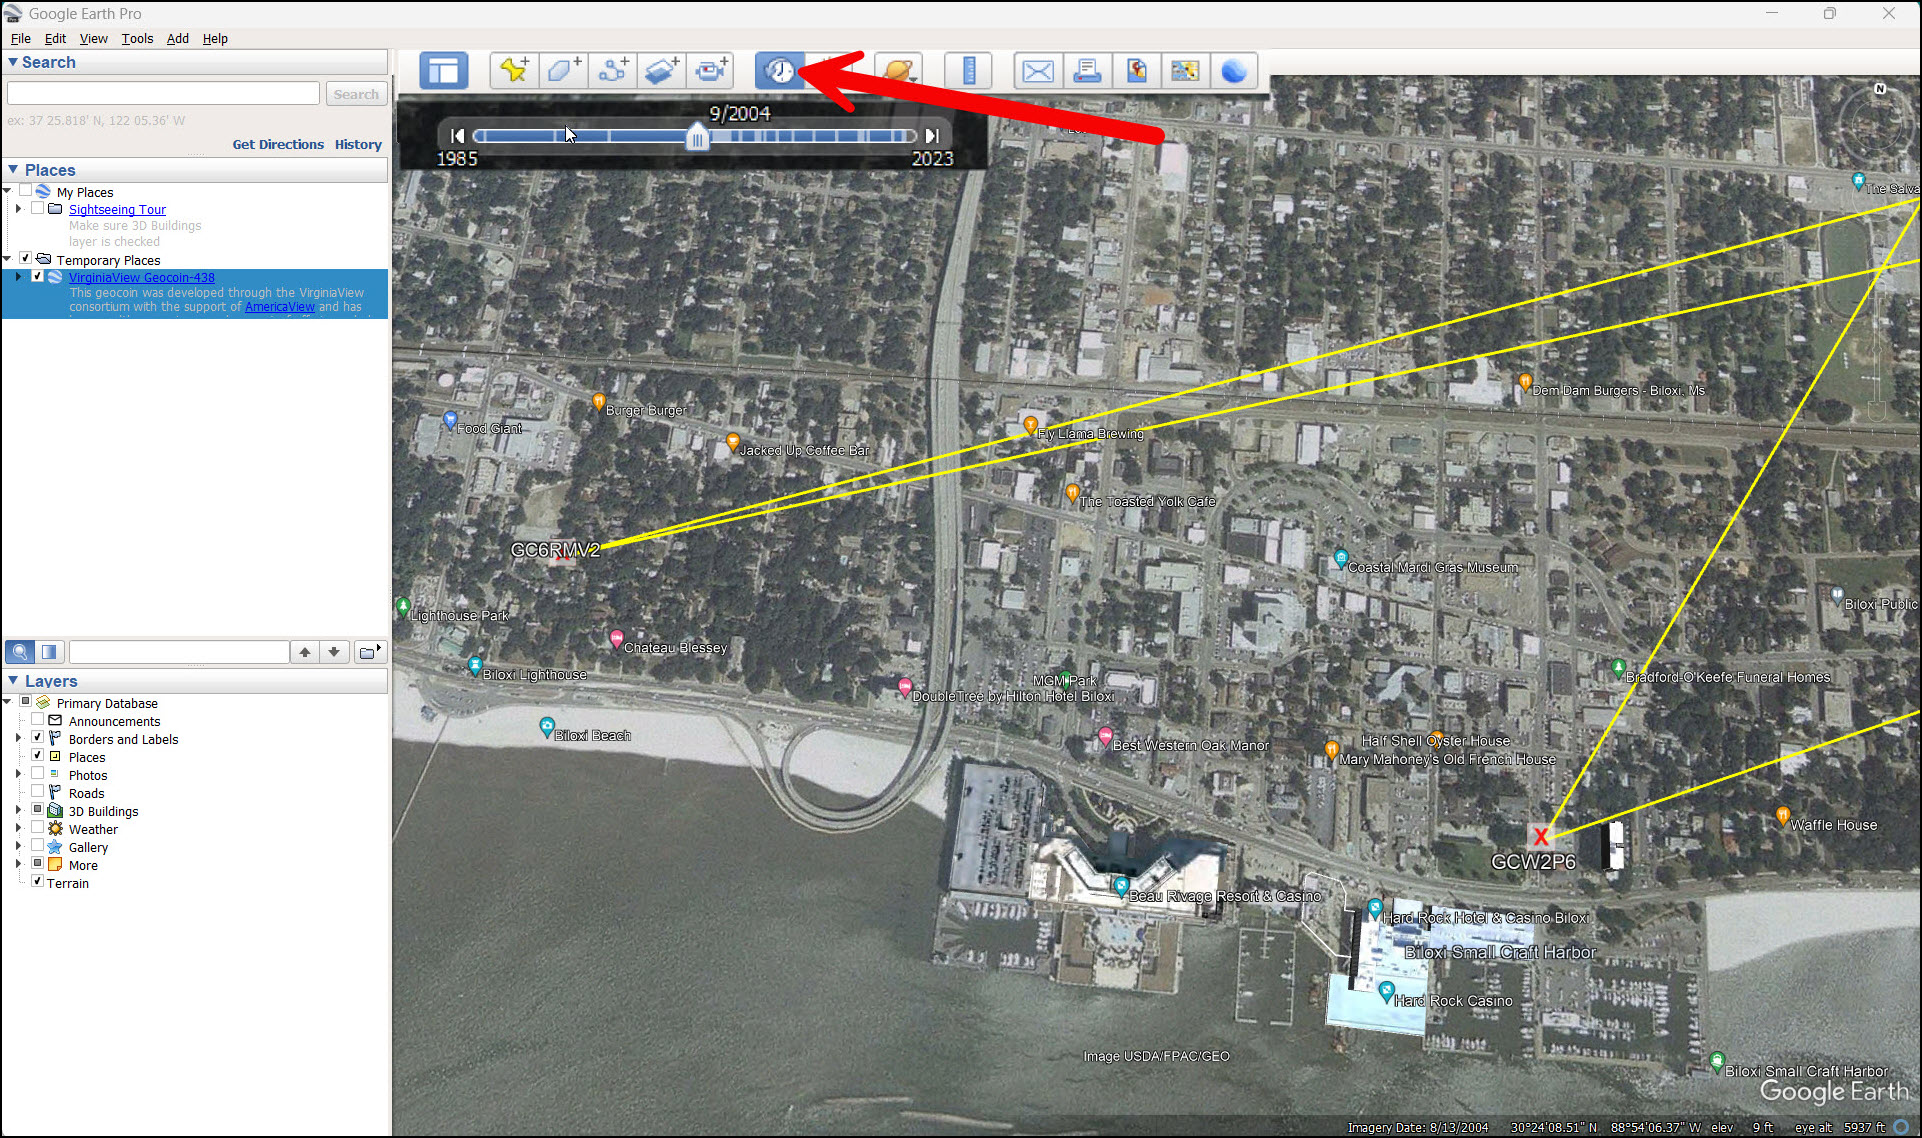
Figure 5.5: Google Earth page with arrow pointing to the Clock icon and time scale bar open.
Gathering Information
Answer the following questions about your first geocoin site as well as any stops your geocoin has made in its travels by using Google Earth. You can record your answers by visiting the Google site https://drive.google.com/drive/folders/1PtWUuT1bIQuzseJ92EtNXtXOPr8l_mZZ?usp=sharing to download a copy of the activity tables and record your answers there, or you can write down your answers on paper.
- Using a geocoin stop, interpret the aerial photography by zooming in to the area on Google Earth. Describe any of the following features that you can find in your map area. You can use the “Examples of Land Cover” chart for help (Figure 5.6). Example: “I see a big parking lot that is black and is probably asphalt”.
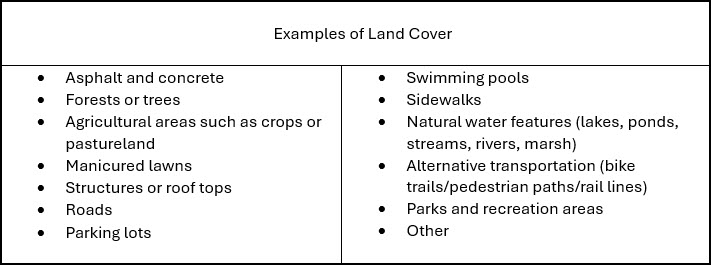
Figure 5.6: Data table showing examples of land cover. - Hypothesize and describe how many of the features found above may contribute to the following issues. Hint: you might need to research some of these.
- Urban heat island effect
- Water quality (surface or ground water)
- Transportation/ congestion
- Personal safety
- Presence, absence, or diversity of wildlife
- Carbon footprint
- Compare differences between the geocoin stop(s) and your community (the first geocoin stop) that might influence the following in the Community and Geocoin Comparison table found below (Figure 5.7) or in the Land Use / Land Change Google folder.
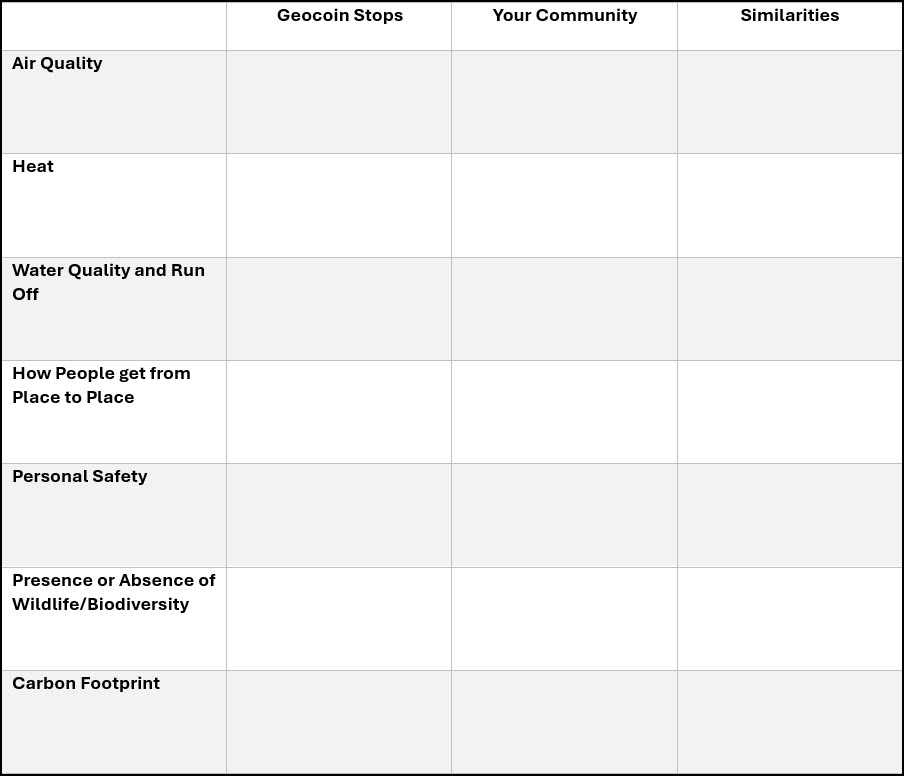
Figure 5.7: Geocoin and Your Community comparison chart. - Compare differences of an area over two time periods by using the time slider function in Google Earth. Record your answers in the Time Change Comparison table located below (Figure 5.8) or in the Land Use / Land Change Google folder.
- Hint: You may need to experiment with the amount of landscape that you are viewing by zooming-in or zooming-out. Changes to the landscape in some communities may be clear from an elevation of 10,000 or 12,000 feet (found in the lower right-hand corner of the Google Earth screen). Other landscapes may require a higher (or lower) elevation. Experiment and find the most suitable elevation for your community or area of interest!
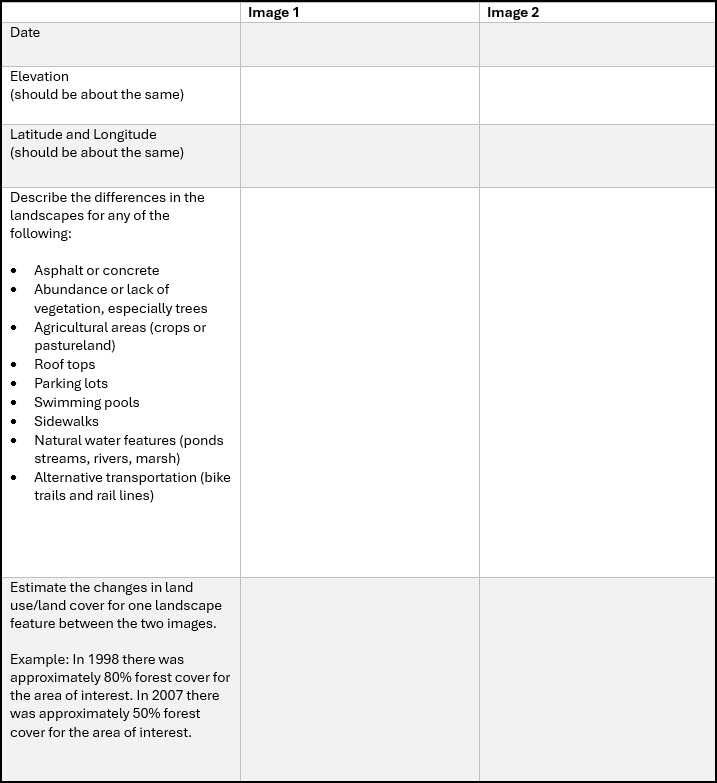
Figure 5.8: Data table to compare Image 1 and Image 2 based on criteria in the first column.
- Hint: You may need to experiment with the amount of landscape that you are viewing by zooming-in or zooming-out. Changes to the landscape in some communities may be clear from an elevation of 10,000 or 12,000 feet (found in the lower right-hand corner of the Google Earth screen). Other landscapes may require a higher (or lower) elevation. Experiment and find the most suitable elevation for your community or area of interest!
- Make sure that the “scale bar” is tuned on, by going to the <View> menu, and selecting <Scale Legend> (Figure 5.9). This will generate a scale bar on your Google Earth screen.
- Find an isolated site (a small patch at least the size of a city block or so that has experienced a significant change in land use over time.
- Describe how the land use of this site has changed over time.
- Estimate the perimeter of this area of change:
- Estimate the acreage of this area.
Reflection Questions
- What surprised you in this exploration of land use?
- What action can you take to curb the negative impacts associated with land use change?
- Who would be potential community collaborators to help you in your efforts to curb the negative impacts associated with land use change? List at least 3 collaborators and describe how they could potentially help your efforts.
- How could you inform decision-makers in your community about your findings?
Resources
Land Use and Land Cover with Satellite Imagery:
United States. Department of the Interior. Geological Survey. A Land Use and Land Cover Classification System for Use with Remote Sensor Data. By James R. Anderson, Ernest E. Hardy, John T. Roach, and Richard E. Wimter. Washington: United States Government Printing Office, 1976. USGS. Web.
http://landcover.usgs.gov/pdf/anderson.pdf
Tutorials for using Google Earth:
http://sitescontent.google.com/google-earth-for-educators/tutorials-and-tips
Earth as Art satellite imagery:
http://eros.usgs.gov/imagegallery/
- What might have caused this change? (development, increased population, conservation, etc.)
- What might be some of the impacts on the environment and on the community that may be associated with these changes in land cover over time? Think of specifics: flooding from storm water runoff, less open space for recreation, improved air quality—depending on what you see.
- What did you notice that is most interesting about land use across time?