Watershed Wanderings
Watershed Activity Overview
In this activity, you’ll be using the travels of your trackable geocoin to explore the effects of nonpoint source water pollution. The location of your geocoin will become the site of a future poultry farm. You’ll explore the possible effects of this farm and what it means to live downstream.
Through this activity, your group will explore:
- The geography of watersheds
- Nonpoint source water pollution
- Geography terms and tools
Watershed Background Information
Go to the following link on the EPA water website: www.epa.gov/hwp and click on ‘Basic Information and Frequently Asked Questions.’
-
- In your own words, what is a watershed?
- What do you think the phrase, ‘We all live downstream,’ means?
Types of Water Pollution
There are two main categories of water pollution that can affect the quality of water in a watershed: point source and nonpoint source. Both sources contribute to the degradation of water quality and can harm ecosystems, human health, and water resources. Examples of the types of pollution include chemicals, sediments, nutrients, and pathogens. The primary difference between point source and nonpoint source pollution lies in how and where the pollutant enters the environment.
Point Source: pollution that comes from specific, identifiable sources and is regulated by federal and state agencies.
Nonpoint Source: a collective of pollutants from various sources over a large area making it challenging to identify the direct sources of pollutants.
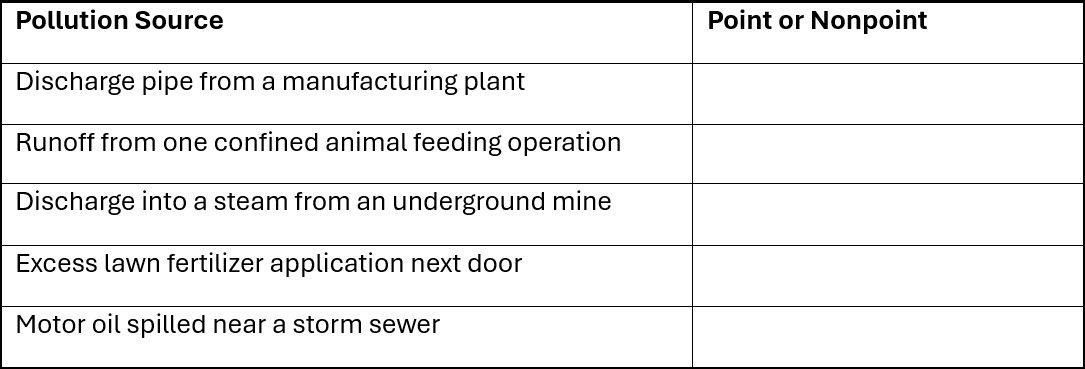
Based on the definitions, classify each of the following types of water pollution as a point or nonpoint source in the table below (Figure 4.2).
Visit https://www.epa.gov/nps/types-nonpoint-source-pollution.
What are the main sources of nonpoint source water pollution in our region (Mid-Atlantic, or search for your region if you are not in a Mid-Atlantic state)?
___________________________________________________
___________________________________________________
Visit www.epa.gov/nps/nonpoint-source-agriculture#Q2 and read the ‘How do agricultural operations affect water quality?’ section. Then watch a short video at thinktv.pbslearningmedia.org/resource/envh10.sci.life.eco.chickenwaste/chicken-waste-and-water-pollution.
Name three impacts that a large-scale chicken house may have on water quality and quantity
-
-
- ___________________________
- ___________________________
- ___________________________
-
If you are interested, read more about water quality challenges here! https://sciencing.com/effects-sewage-aquatic-ecosystems-21773.html.
Watershed Data Collection
You or someone else in your group should have dropped off a Geocoin in a Geocache a while ago (See Virginia Geocoin Adventure: Getting Started Manual if these terms sound unfamiliar). Now, we can use your Geocoin’s log information to explore spongy moth infestations. We will imagine that your Virginia Geocoin is a chicken tycoon looking for a new site to build a large poultry farm. Each ‘stop’ the geocoin makes will give us a chance to weigh the effects of poultry farming at that location by looking at the characteristics of that location’s watershed.
Note to Leaders: You’ll want to make sure that your Geocoin has traveled to at least 3 (hopefully more) different places before starting this activity. If it has not, then you can always select a different geocoin to complete this exercise. You can conduct a search for Trackable Geocoins on www.geocaching.com/play, and under the ‘Play’ menu, select ‘Trackables.’ You can search for a “Trackable by name” and enter ‘VirginiaView’ (for a listing of all VirginiaView Geocoins), ‘Map@syst’ (for a listing of all Map@syst Geocoins), ‘4H’ (for a listing of all 4H geocoins), or any other geocoin name that you might be familiar with! You can sort these lists by distance traveled (number of miles)! If you have not dropped off trackable Geocoin, then you can use an existing trackable item that is already in circulation.
Required Software: You will also want to ensure Google Earth Pro for desktop has been installed before beginning the activity. You can download the desktop version at www.google.com/earth/about/versions/. For a primer on how to navigate Google Earth, download the Google Earth tutorial from virginiaview.cnre.vt.edu/tutorials/.
Activity Charts: The Appendix A table is located at the end of the Watershed Wanderings section. However, for a downloadable version of the Appendix A table, visit the the Google site inside of the ‘Watershed Wanderings’ folder: https://drive.google.com/drive/folders/1PtWUuT1bIQuzseJ92EtNXtXOPr8l_mZZ?usp=sharing. Please make as many copies as need for your class, and feel free to modify the copied versions for your class needs.
Let’s Get Started!
- Log in to www.geocaching.com/play with the account you used when you dropped off the geocoin.
- From the ‘Play’ dropdown menu, select ‘Trackables’ (Figure 4.3).
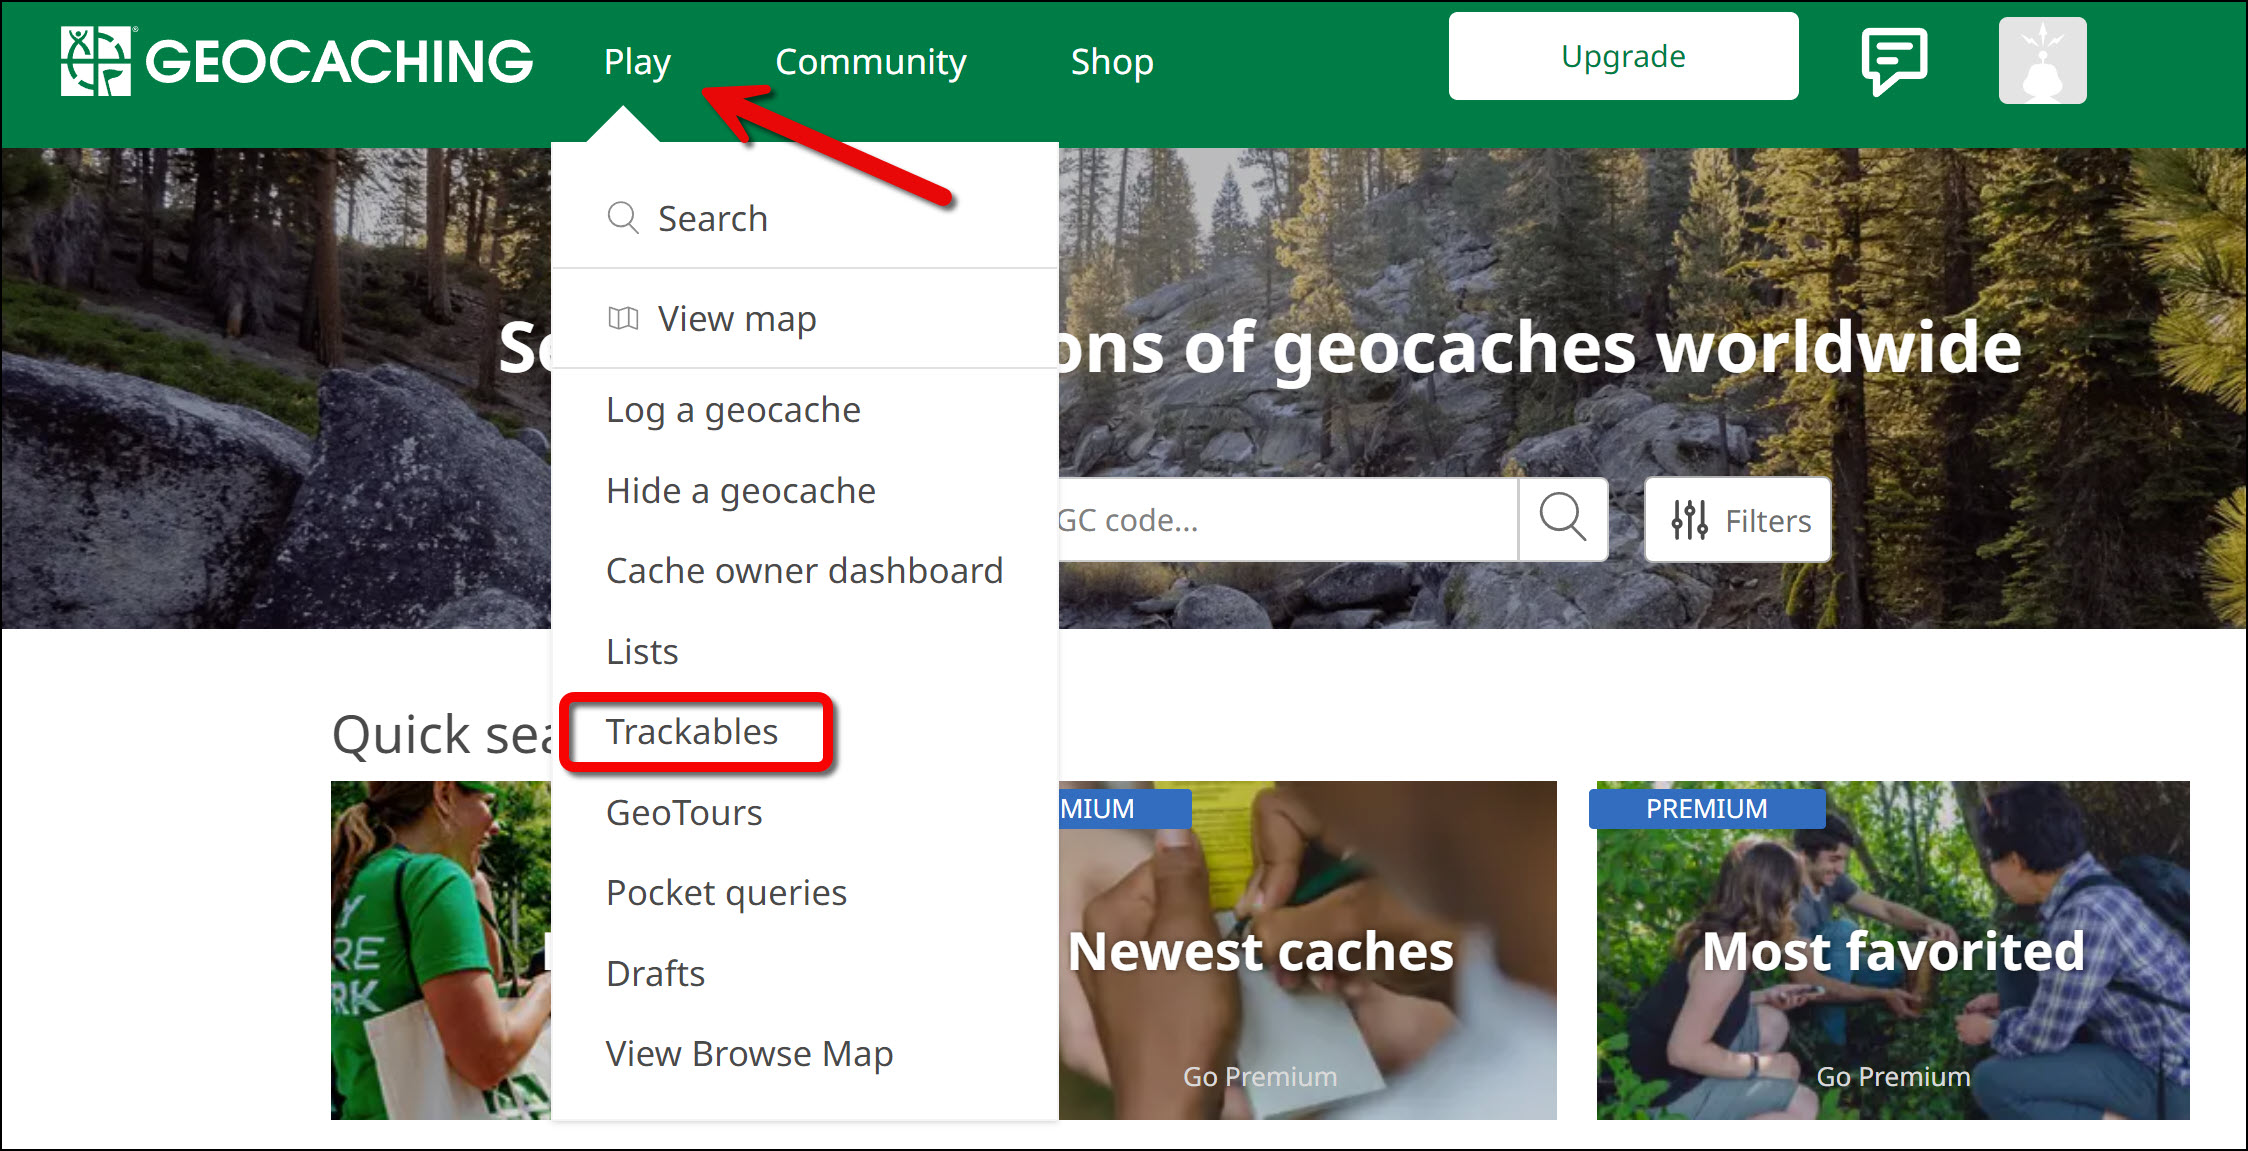
Figure 4.3: ‘Play’ dropdown menu with rectangle around ‘Trackables’ button on the Geocaching webpage. - Enter the tracking code printed on the trackable (ex: XX234XX). Note: Once the secret tracking code is entered, a ‘nickname number’ will appear on the webpage to reference the geocoin. The nickname number is okay to share with others.
- Scroll down to the bottom of the page to see ‘Tracking History’ (Figure 4.4). Each entry in the log represents one potential chicken farm site.
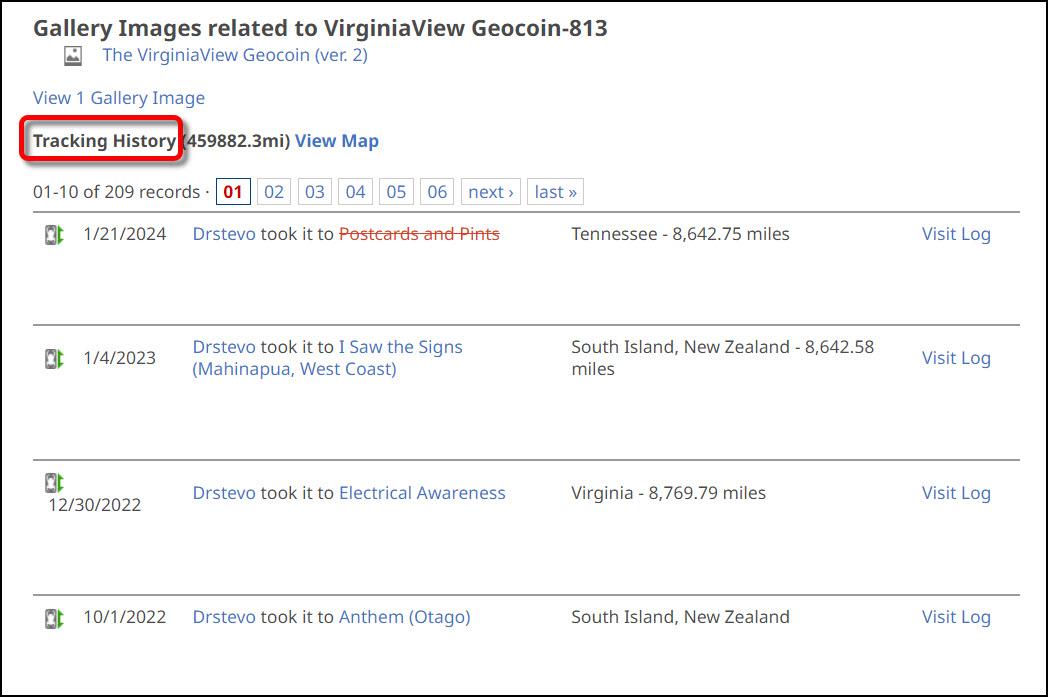
Figure 4.4: ‘Tracking History’ section of a geocoin’s log page. - From the geocoin’s log page, scroll up and click on ‘View in Google Earth’ under the Trackable Options menu (Figure 4.5). This will generate a KML file for you to download to your computer. Note: Ensure Google Earth Pro for desktop is installed before clicking ‘View in Google Earth.’ You can install the application from www.google.com/earth/about/versions/.
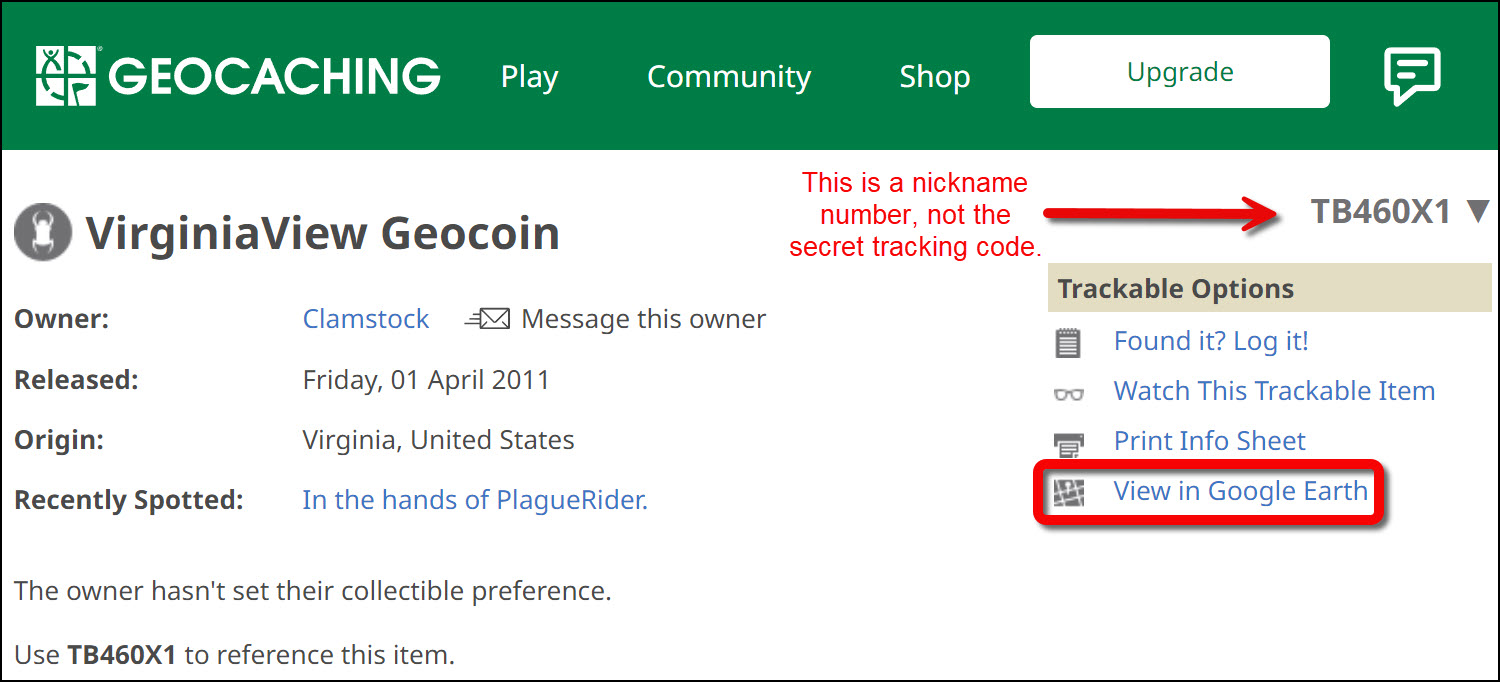
Figure 4.5: ‘View in Google Earth’ link highlighted on the Virginia View Geocoin page. - After downloading the KML file to your computer, double click on the file to open it with Google Earth Pro for desktop. You should now see yellow tracks on the map and tracks for your geocoin listed on the left-hand menu. Be sure that the ‘Borders and Labels’ layer found on the left-hand panel is turned on (Figure 4.6). Hint: Turn off the ‘Roads’ layer to better see the geocoin’s tracks.
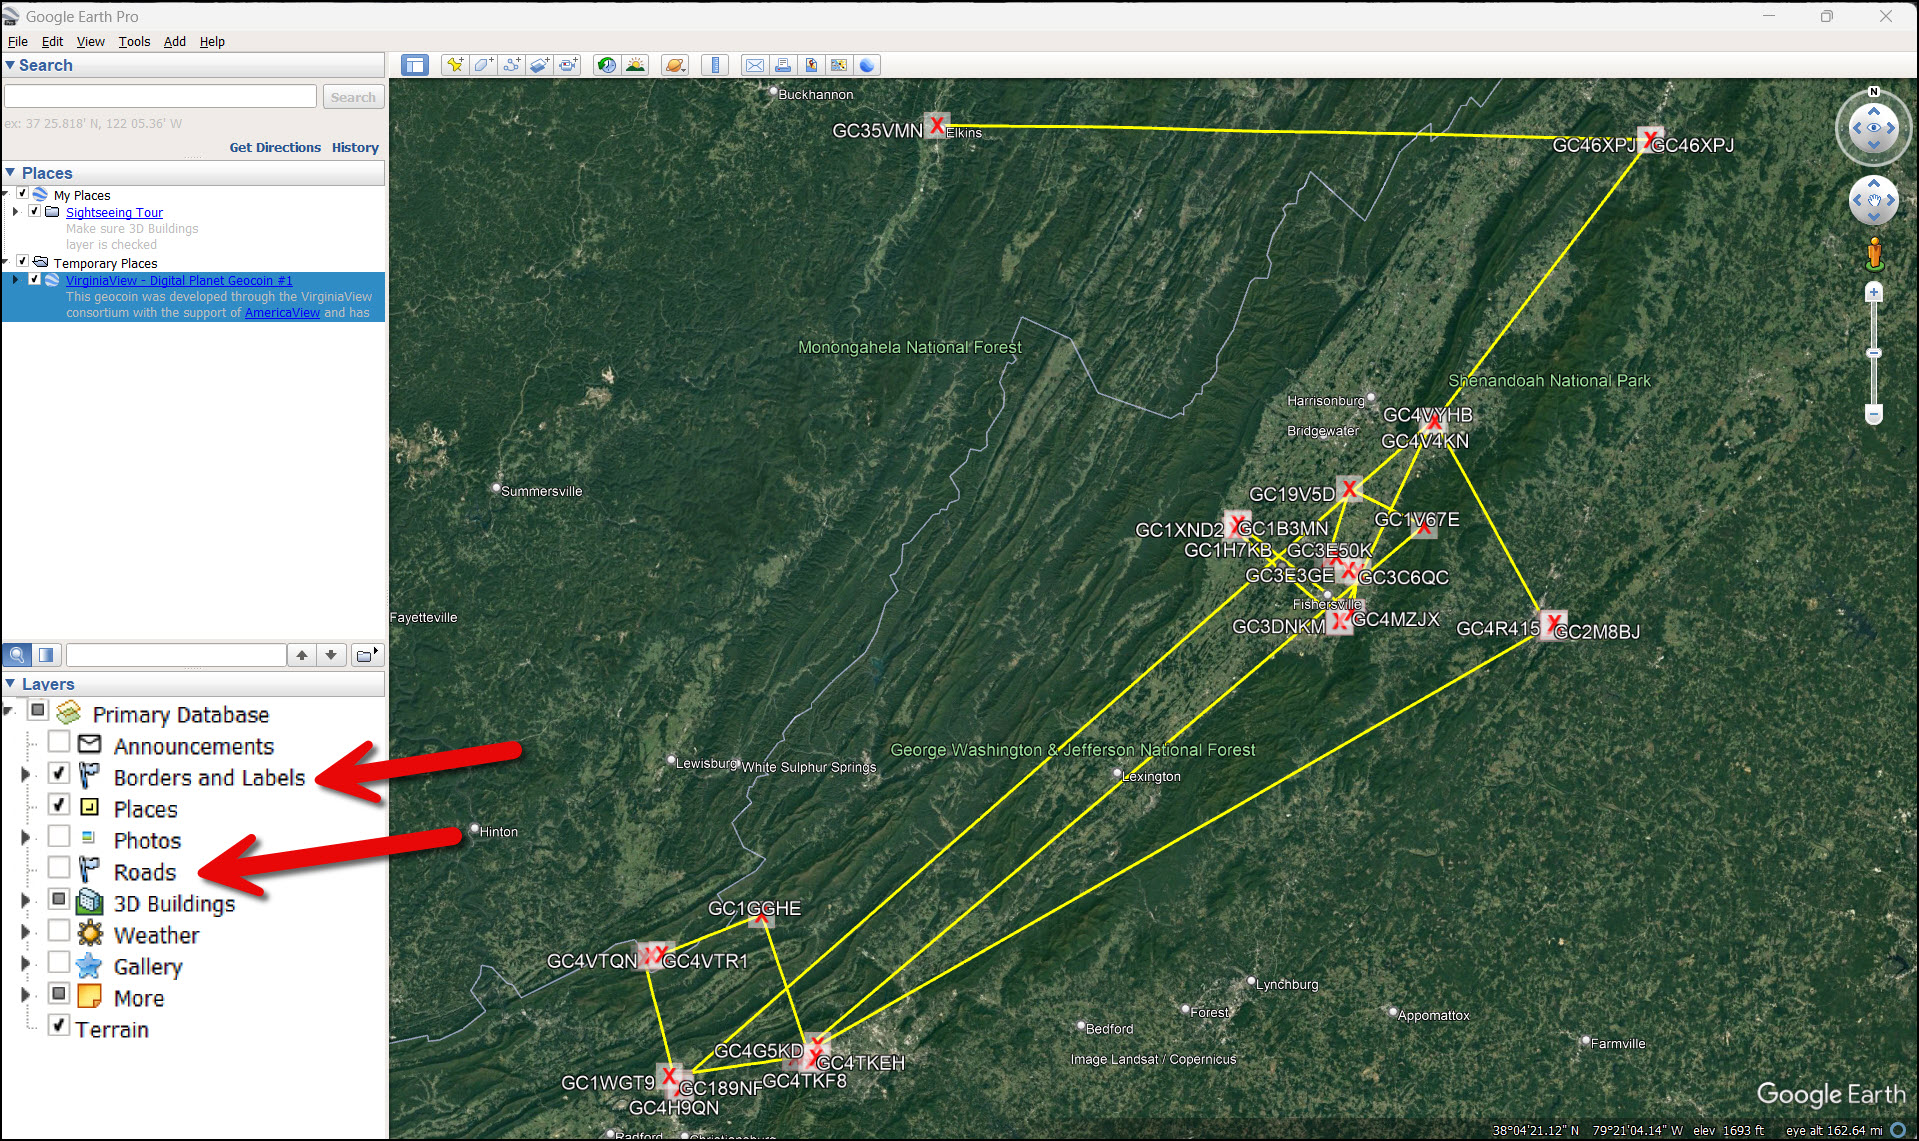
Figure 4.6: Google Earth page with yellow tracks representing the geocoin’s travel route. ‘Borders and Labels’ layer is turned on and the ‘Roads’ layer is turned off. - For each stop on the geocoin’s journey, zoom in and explore the immediate area. You should be able to determine if the geocoin landed in a spot that is obviously not a suitable site for a chicken farm (such as a suburban neighborhood).
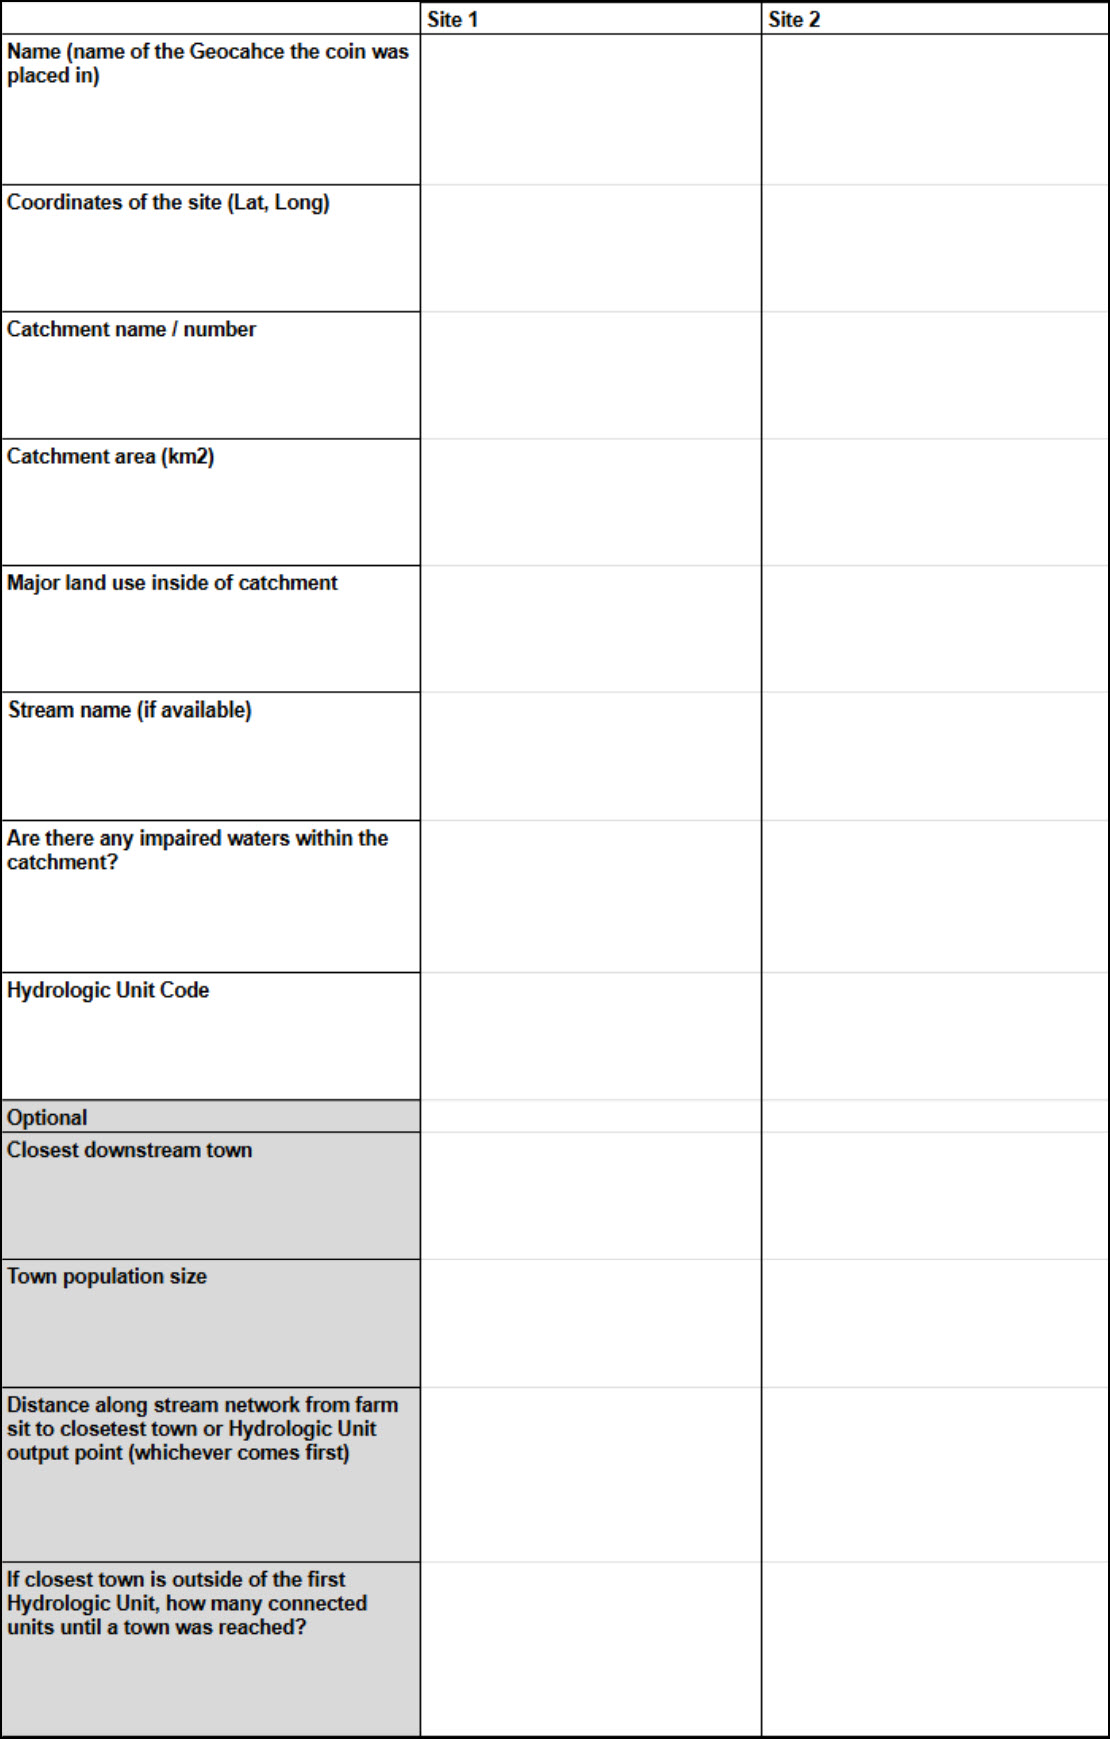
- Choose 2 potential sites and list their names (the site name will be the name of the Geocache the coin was placed in) in the form in Appendix A.
- Next, we’ll add data from the EPA that will give us more information about individual watersheds. Open a web browser and go to www.epa.gov/waterdata/viewing-waters-data-using-google-earth#Download and download the WatersKMZv1.10 file (Figure 4.7).
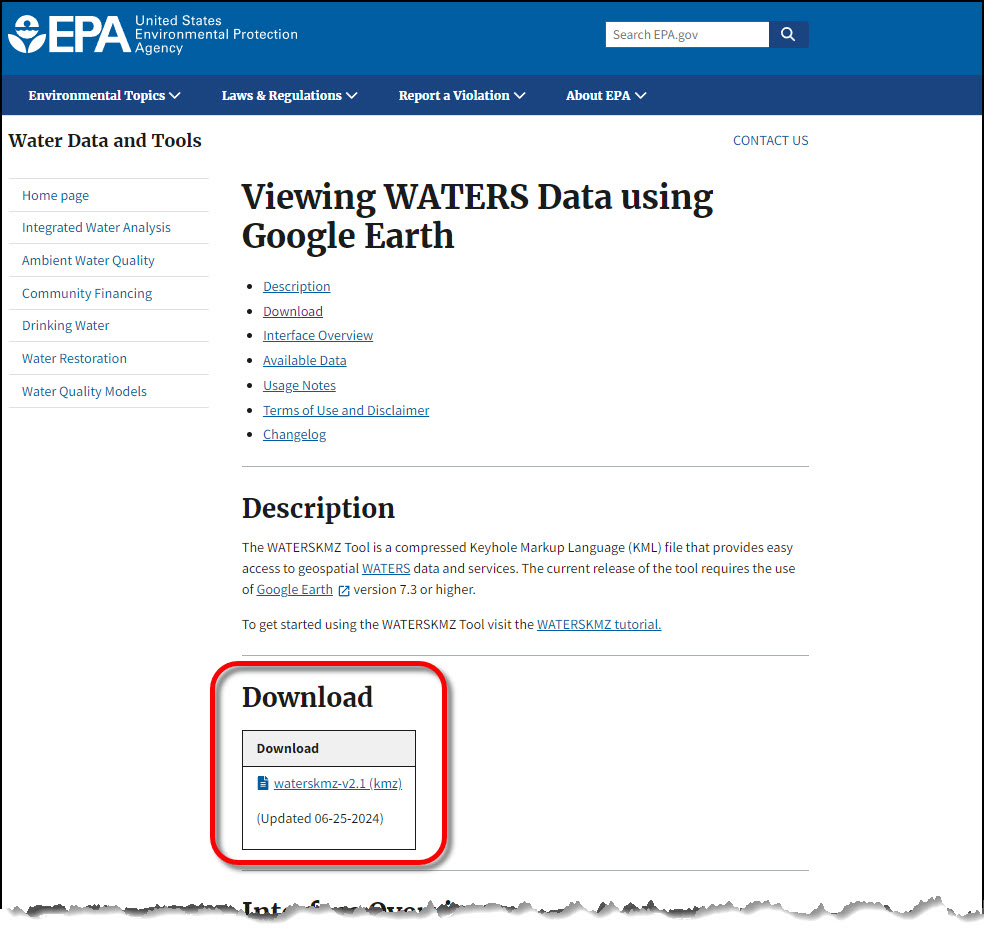
Figure 4.7: EPA website where the WATERS download link is located. - Once downloaded, double click the WATERS KMZ file, and it will open directly in Google Earth. On the Places panel, check (turn on) the Surface water Features layer and uncheck (turn off) the EPA Linked Data and Other Linked Data layers (Figure 4.8). Note: If you still cannot see the WATERS data on the map, zoom in closer to your 2 potential chicken farm sites and wait a few moments for the data to appear.
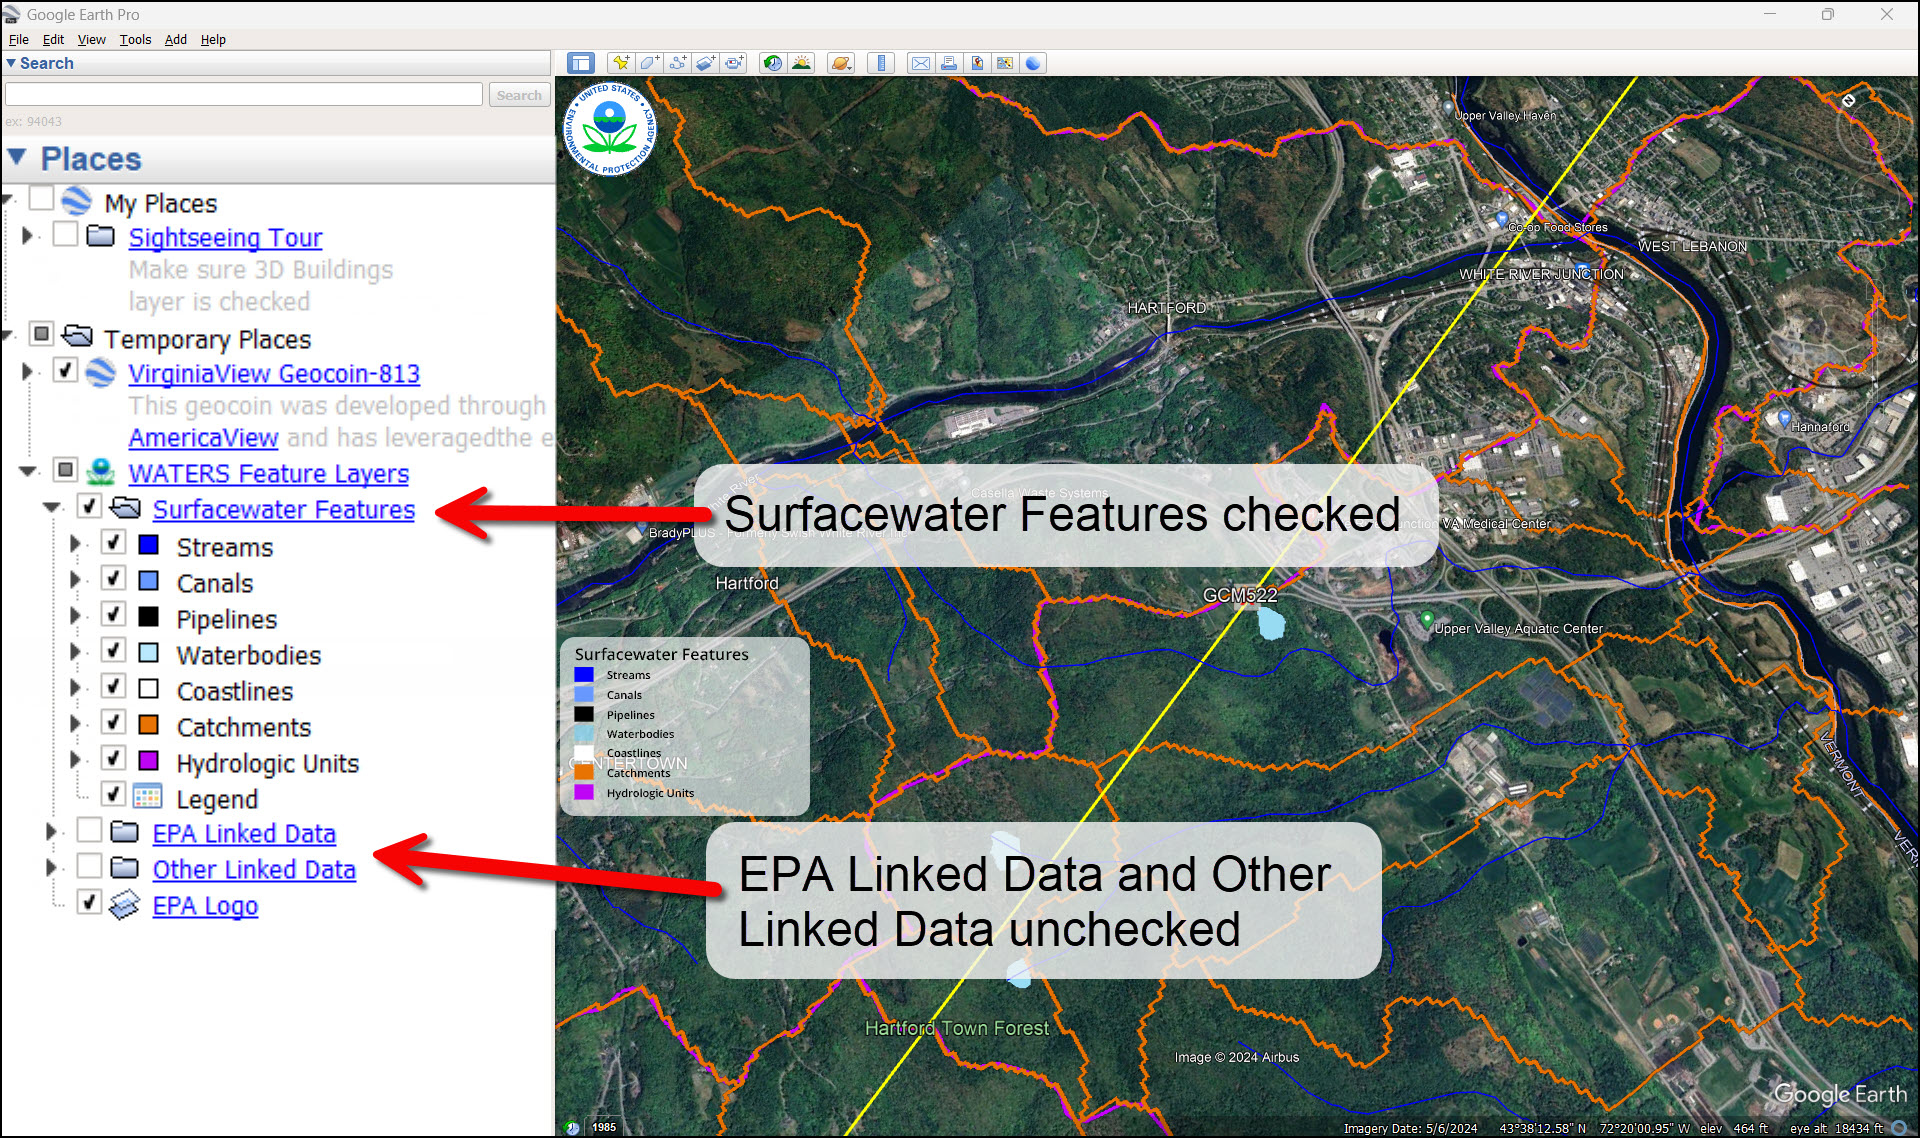
Figure 4.8: Google Earth page with the geocoin and WATERS data displayed. ‘Surface waters Features’ layer is turned on, and ‘EPA Linked Data’ layer is turned off. - You can see on the Surfacewater Features sub-menu that Streams, Canals, and other water features are featured. From these features, we will focus on the Catchments and Hydrologic Units layers for our activity to record in Appendix A.
Catchment: Also known as a watershed, it is the area of land where all precipitation collects and drains into a specific part of a stream (contained within the catchment boundary). Each catchment had a unique ID assigned to it.
Hydrologic Unit: A collection of interconnected catchments. Hydrologic Units are similar in total land area to one another. Each hydrologic unit has a unique ID assigned to it.
- Turn off (uncheck) the Hydrologic Units layer but leave the Catchments layer on. Make sure you are zoomed out enough that you can see the entire outline of the catchment area that surrounds your farm site.
- Click anywhere inside the catchment of your farm location and an information box will pop up. From this box, record Catchment Name and Area (km2) in Appendix A (Figure 4.9). Then, determine the major land use or land cover inside of catchment. Record your answer in Appendix A.
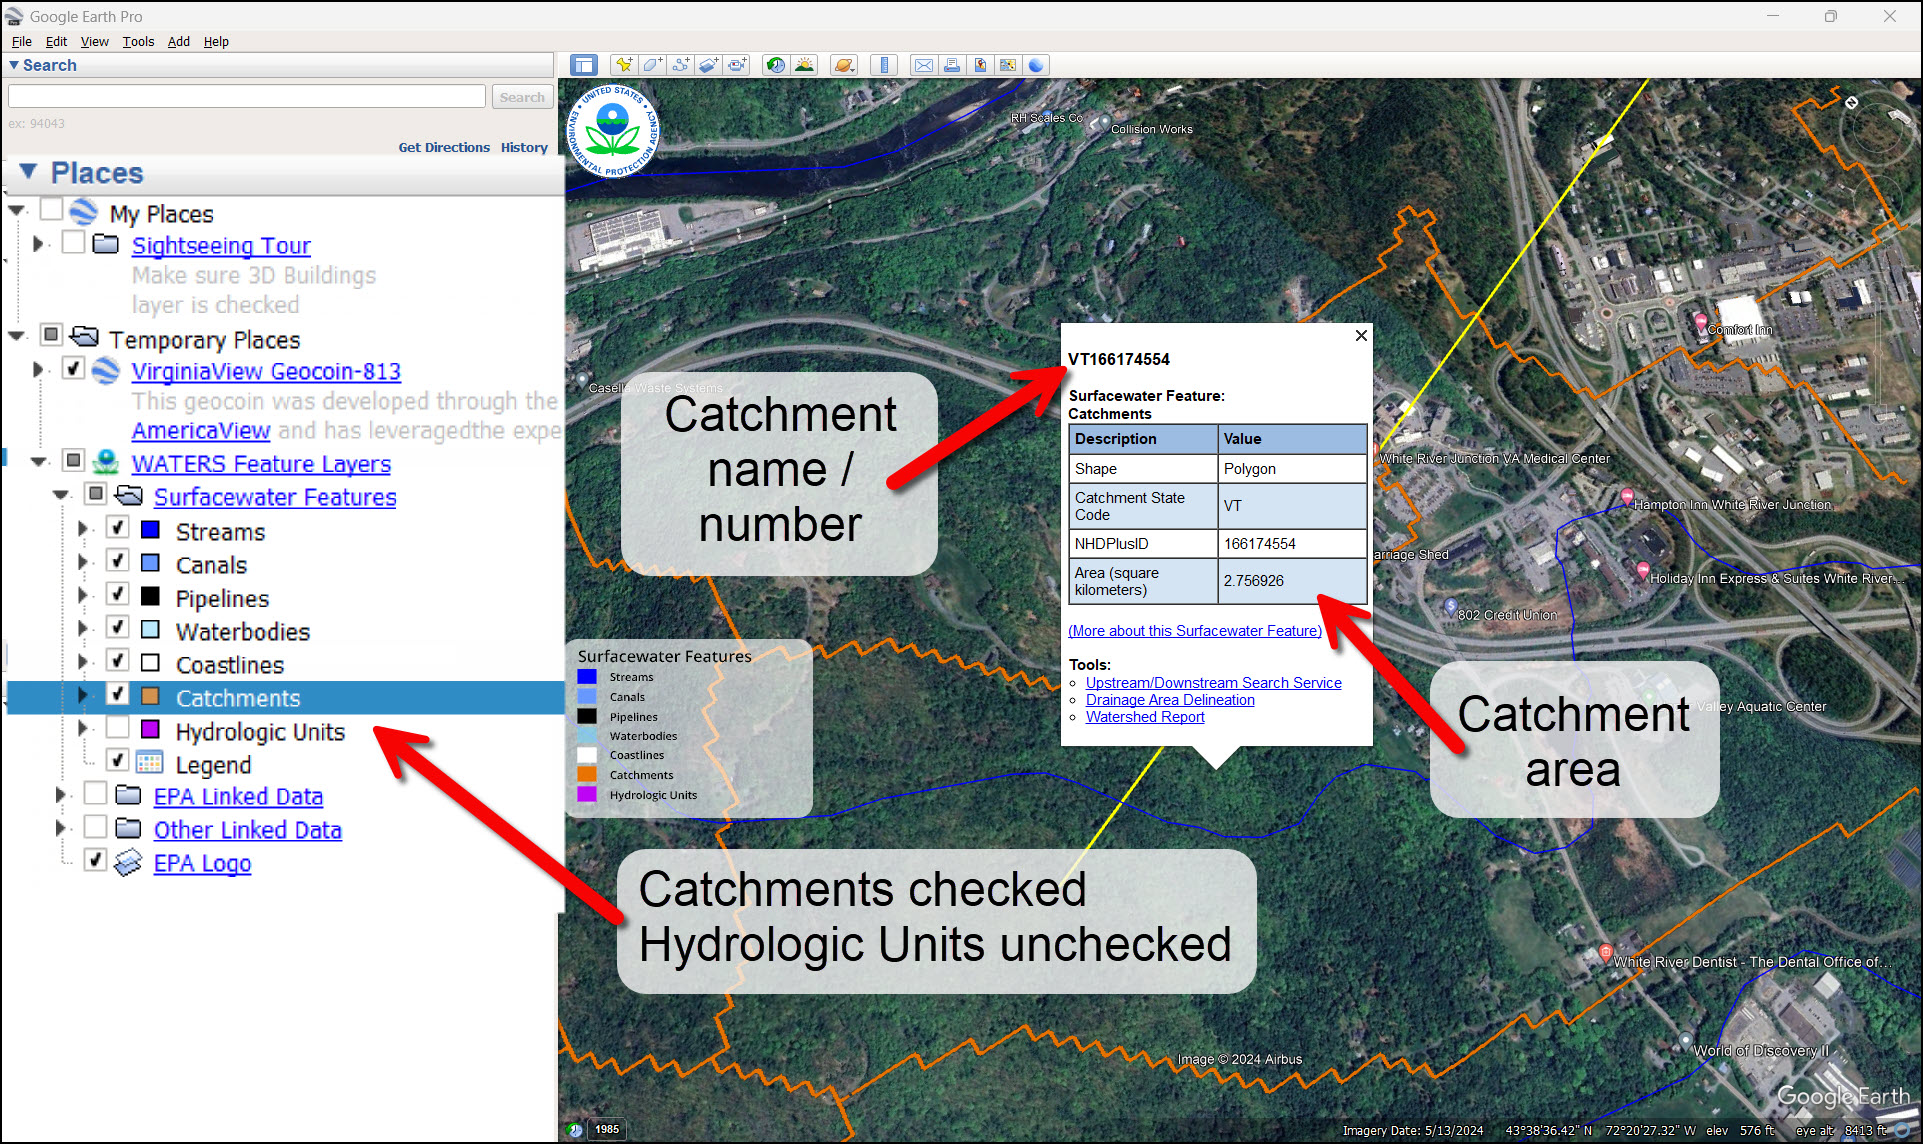
Figure 4.9: Google Earth page with ‘Catchments’ layer turned on and ‘Hydrologic Units’ layer turned off. An example of the Catchment information window is displayed with arrows pointing to the Catchment name / number and the Catchment area (km2). - Turn on the EPA Linked Data layer. Check to see if any impaired waters (red areas) fall within the farm’s catchment area (Figure 4.10). Record this information in Appendix A. Turn the EPA Linked Data layer off once you have completed this step.
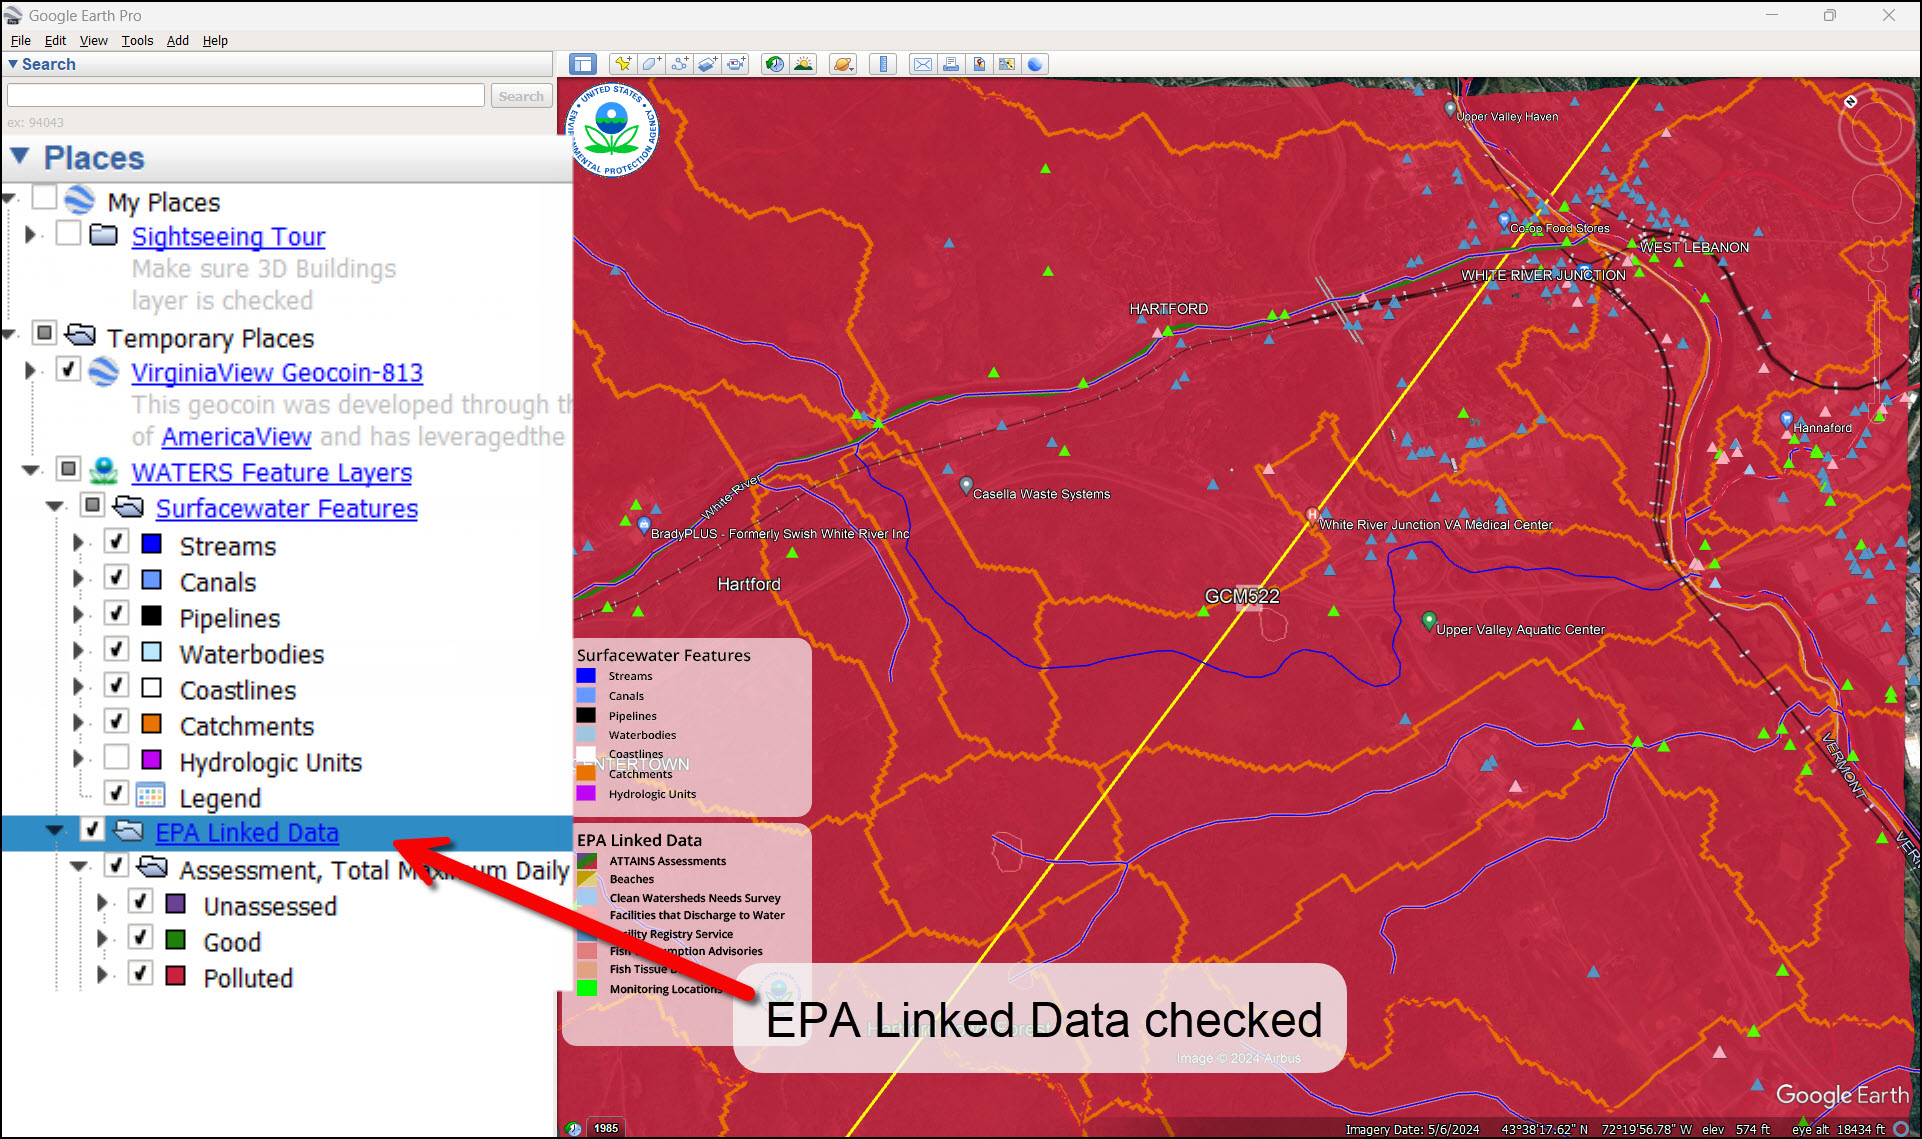
Figure 4.10: Google Earth page with ‘EPA Linked Data’ turned on displaying the pollution assessment data within the catchment area. - Now, turn off the Catchments layer and turn on the Hydrologic Units layer (Figure 4.11). Click on the same point as you did for the catchment layer and another information box will appear. From this box, record the Stream Name and Hydrologic Unit Code in Appendix A.
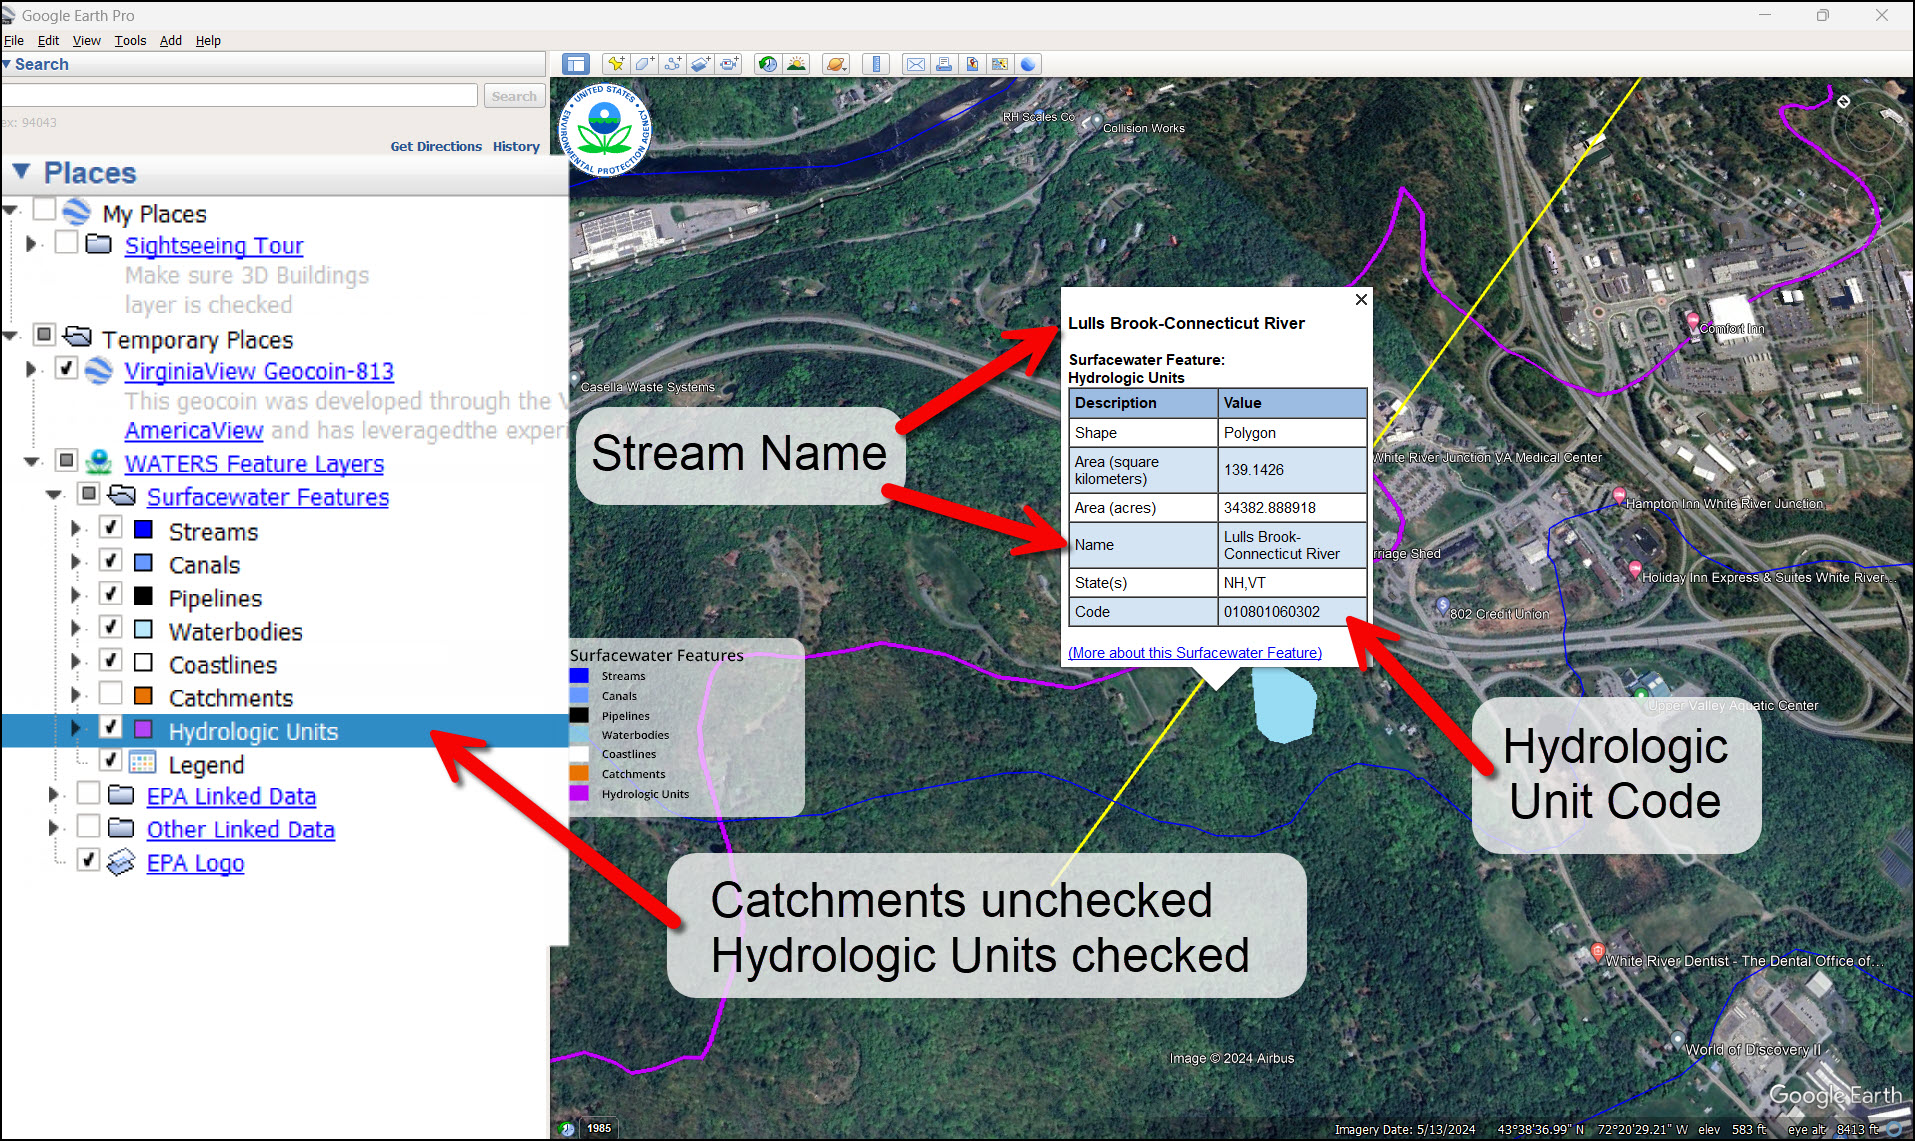
Figure 4.11: Google Earth page with ‘Hydrologic Units’ layer checked and the ‘Catchments’ layer unchecked. The Hydrologic Units window displays where to find the Stream Name and Hydrologic Unit Code for the exemplified Hydrologic Unit boundary.
Challenge (Optional/Advanced): Try to determine the closest downstream town to your farm site. Use the Hydrologic Units and the Streams layers to give you clues.
- Use the Add Placemark (Push Pin) tool to mark the location for the farm site. Then turn off your Geocoin layer in the Places panel.
- Turn on (check) Streams and Hydrologic Units and uncheck all the other WATERS layers. Zoom out so you can see the entire Hydrologic Unit that contains your farm site (Figure 4.12).
- Note: Be sure to refresh your Streams and Hydrologic Units layers as you zoom out by right clicking on the layer in the Places panel and selecting Refresh. The layer’s icon will spin while it is refreshing.
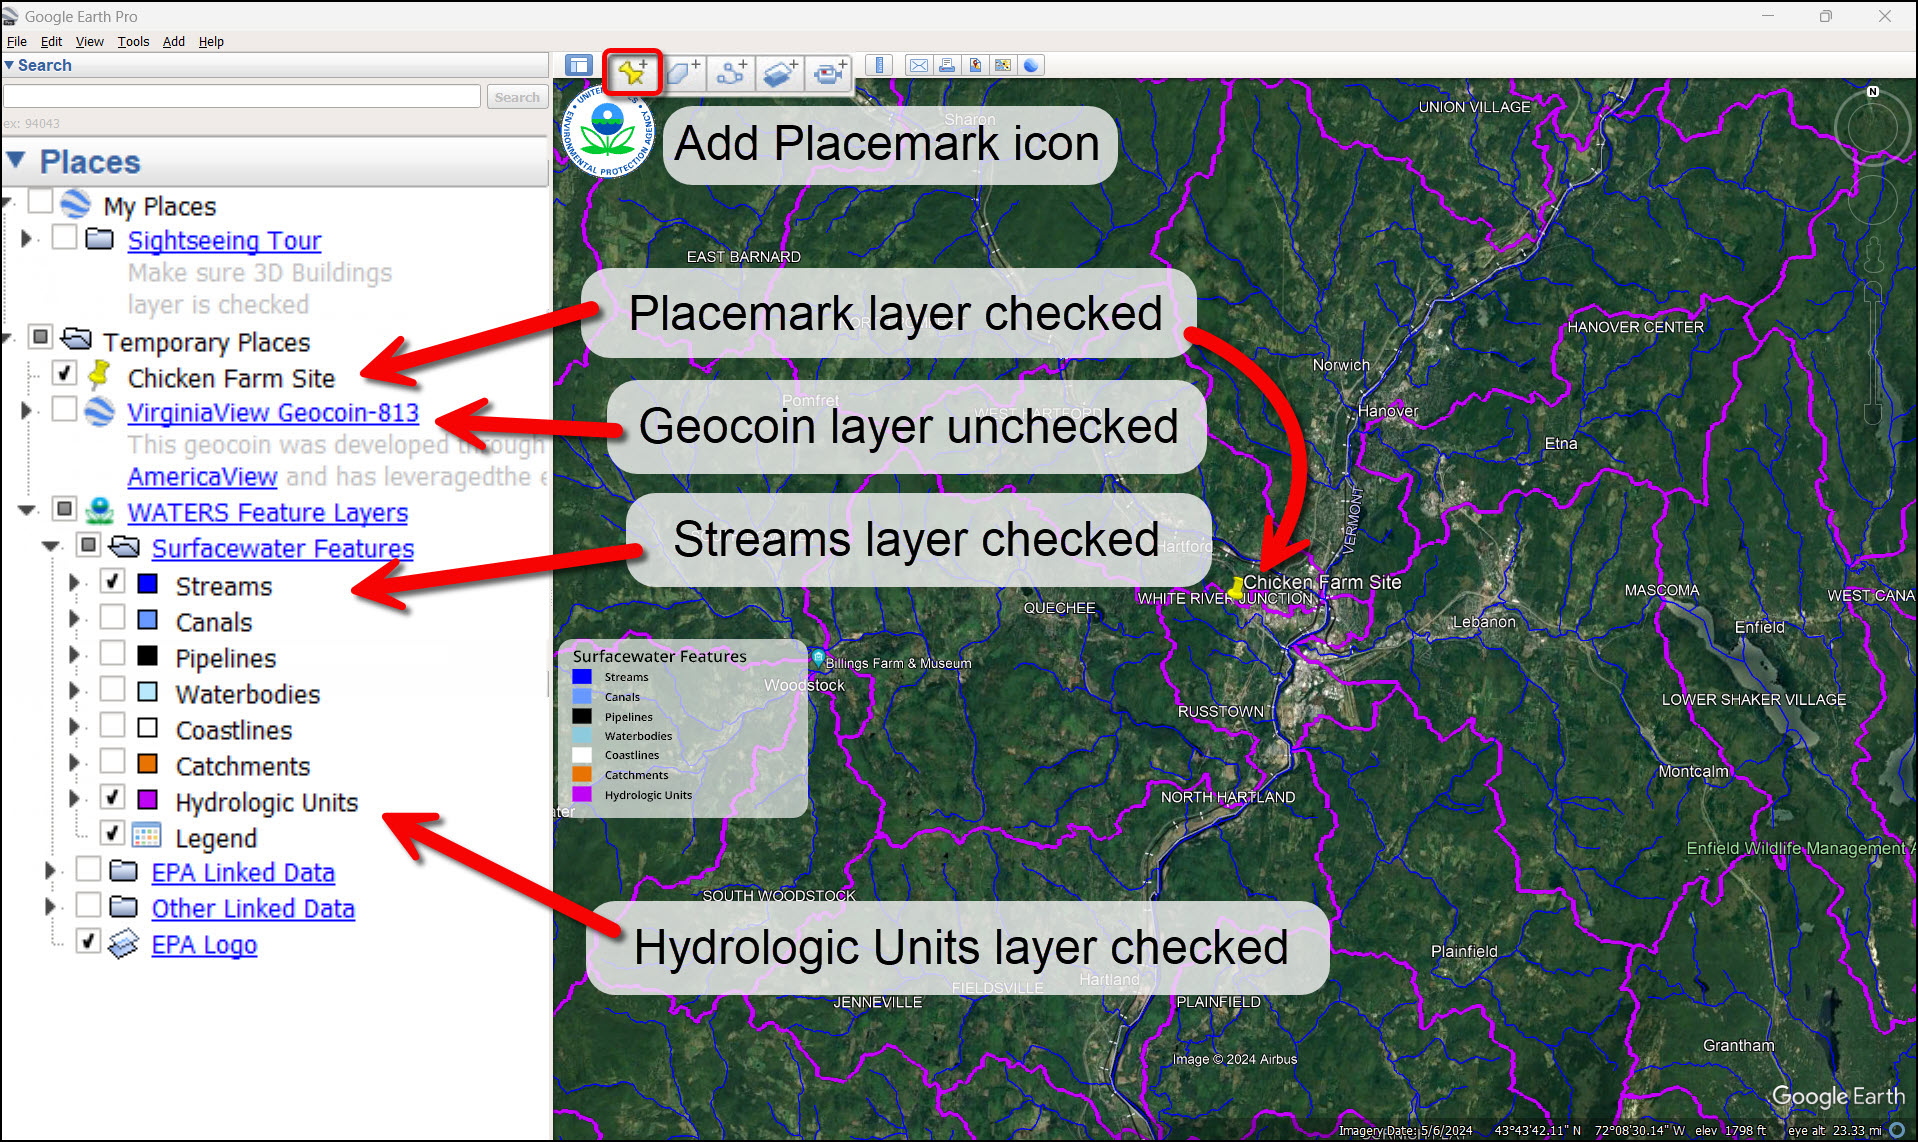
Figure 4.12: The Add Placemark icon is on the toolbar to pinpoint your chicken farm site. The Chicken Farm Site placemark, ‘Streams,’ and ‘Hydrologic Units’ layers are checked in the Places panel. The geocoin’s layer is unchecked in the Places panel.
- Note: Be sure to refresh your Streams and Hydrologic Units layers as you zoom out by right clicking on the layer in the Places panel and selecting Refresh. The layer’s icon will spin while it is refreshing.
- Use the Add Placemark tool to mark the outlet point for each Hydrologic Unit that contains a potential chicken farm. Each Hydrologic Unit has only one outlet point. To determine the outlet point, hover your cursor over where a stream crosses the boundary line and record the elevation. The lowest elevation is the outlet point (Figure 4.13).
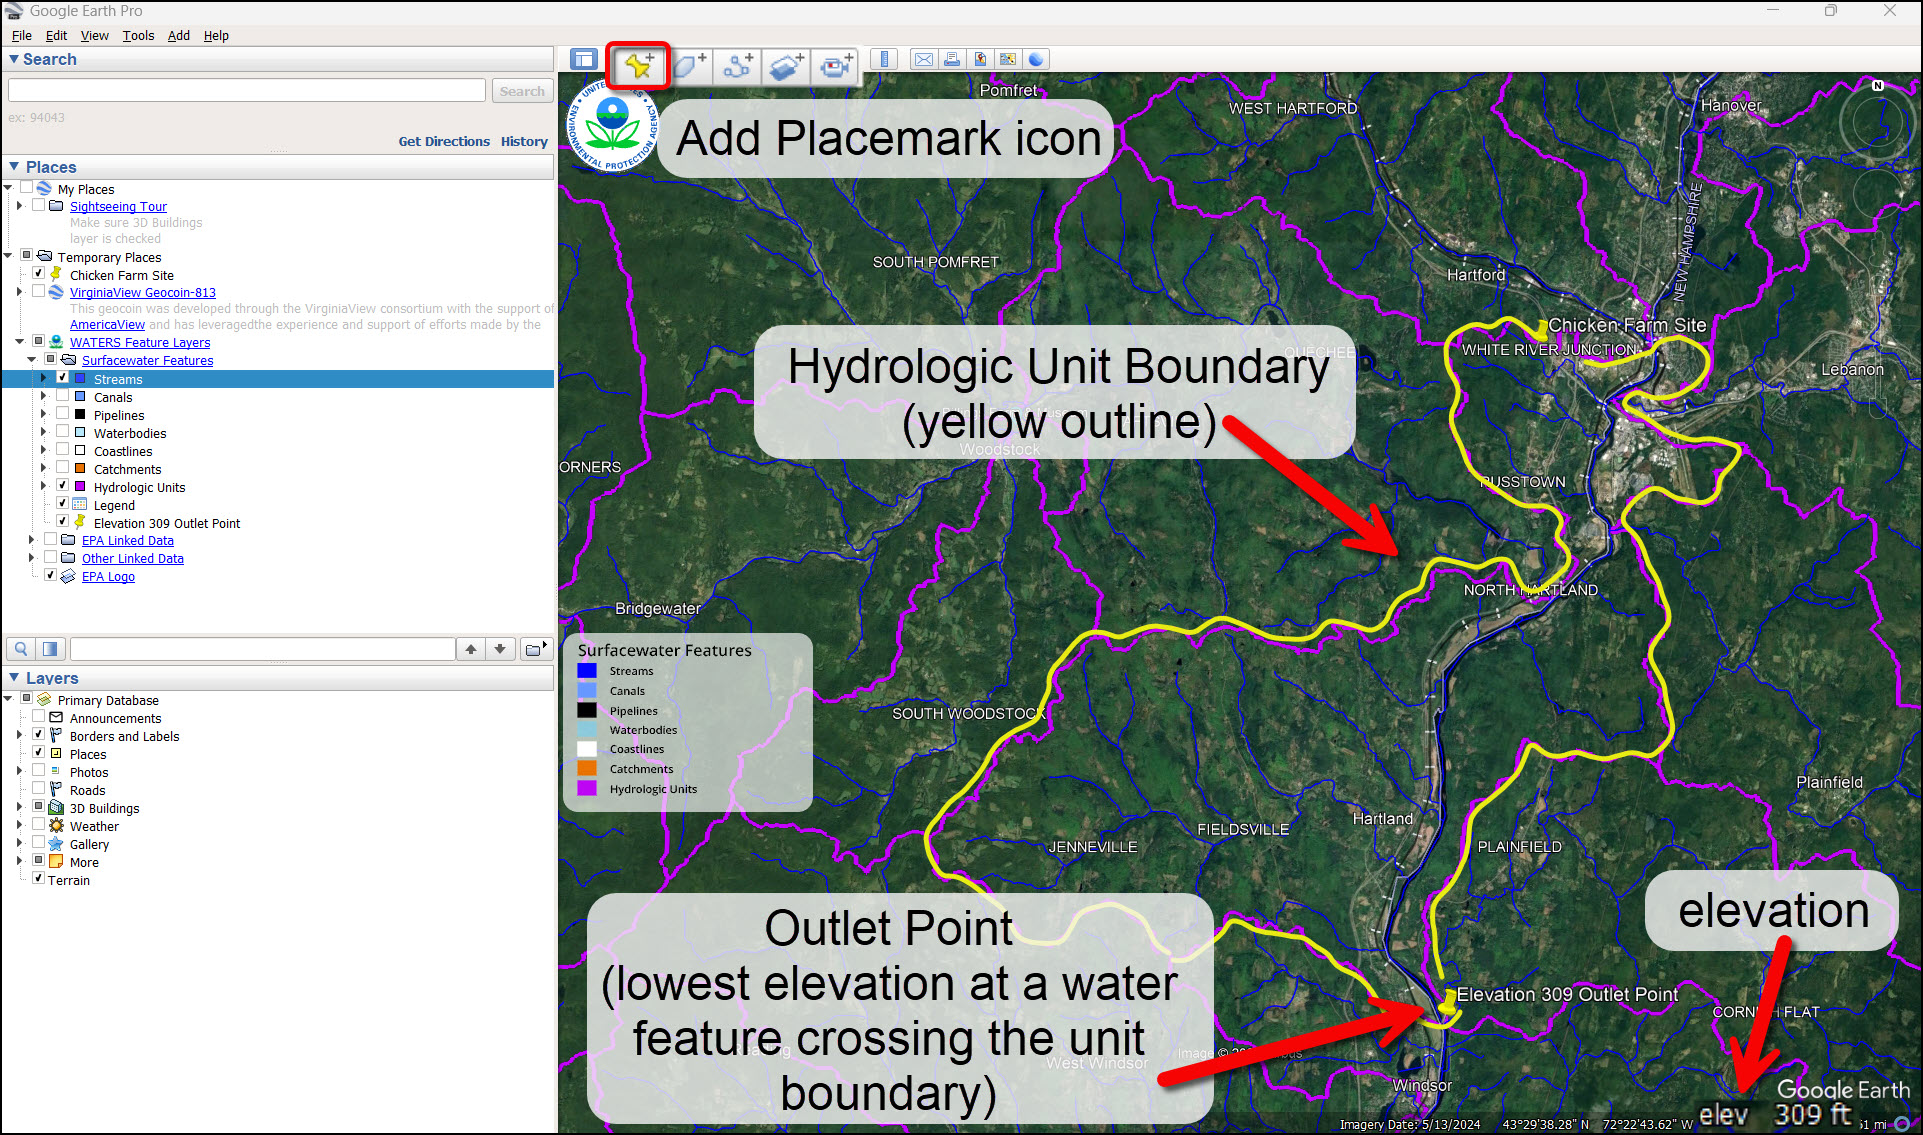
Figure 4.13: A yellow boundary line shows the outline of the Hydrologic Unit which contains the Chicken Farm site and the Outlet Point. The elevation at the bottom right corner of the page helps determine the Outlet Point (the lowest point of elevation at a water feature crossing the Hydrologic Unit boundary line). - Now we can determine a downhill path from the farm location to the outlet point and see if any towns or cities are within the path. Use the Add Path tool to trace the water leaving your farm to the outlet point along the streams and waterbodies as they flow downhill (Figure 4.14).
- Note: You will likely need to stop as you go to reposition the map—to do this, click OK, reposition the map as you need to. Then right-click on your path name in the Places panel and go to Properties. This allows you to keep editing.
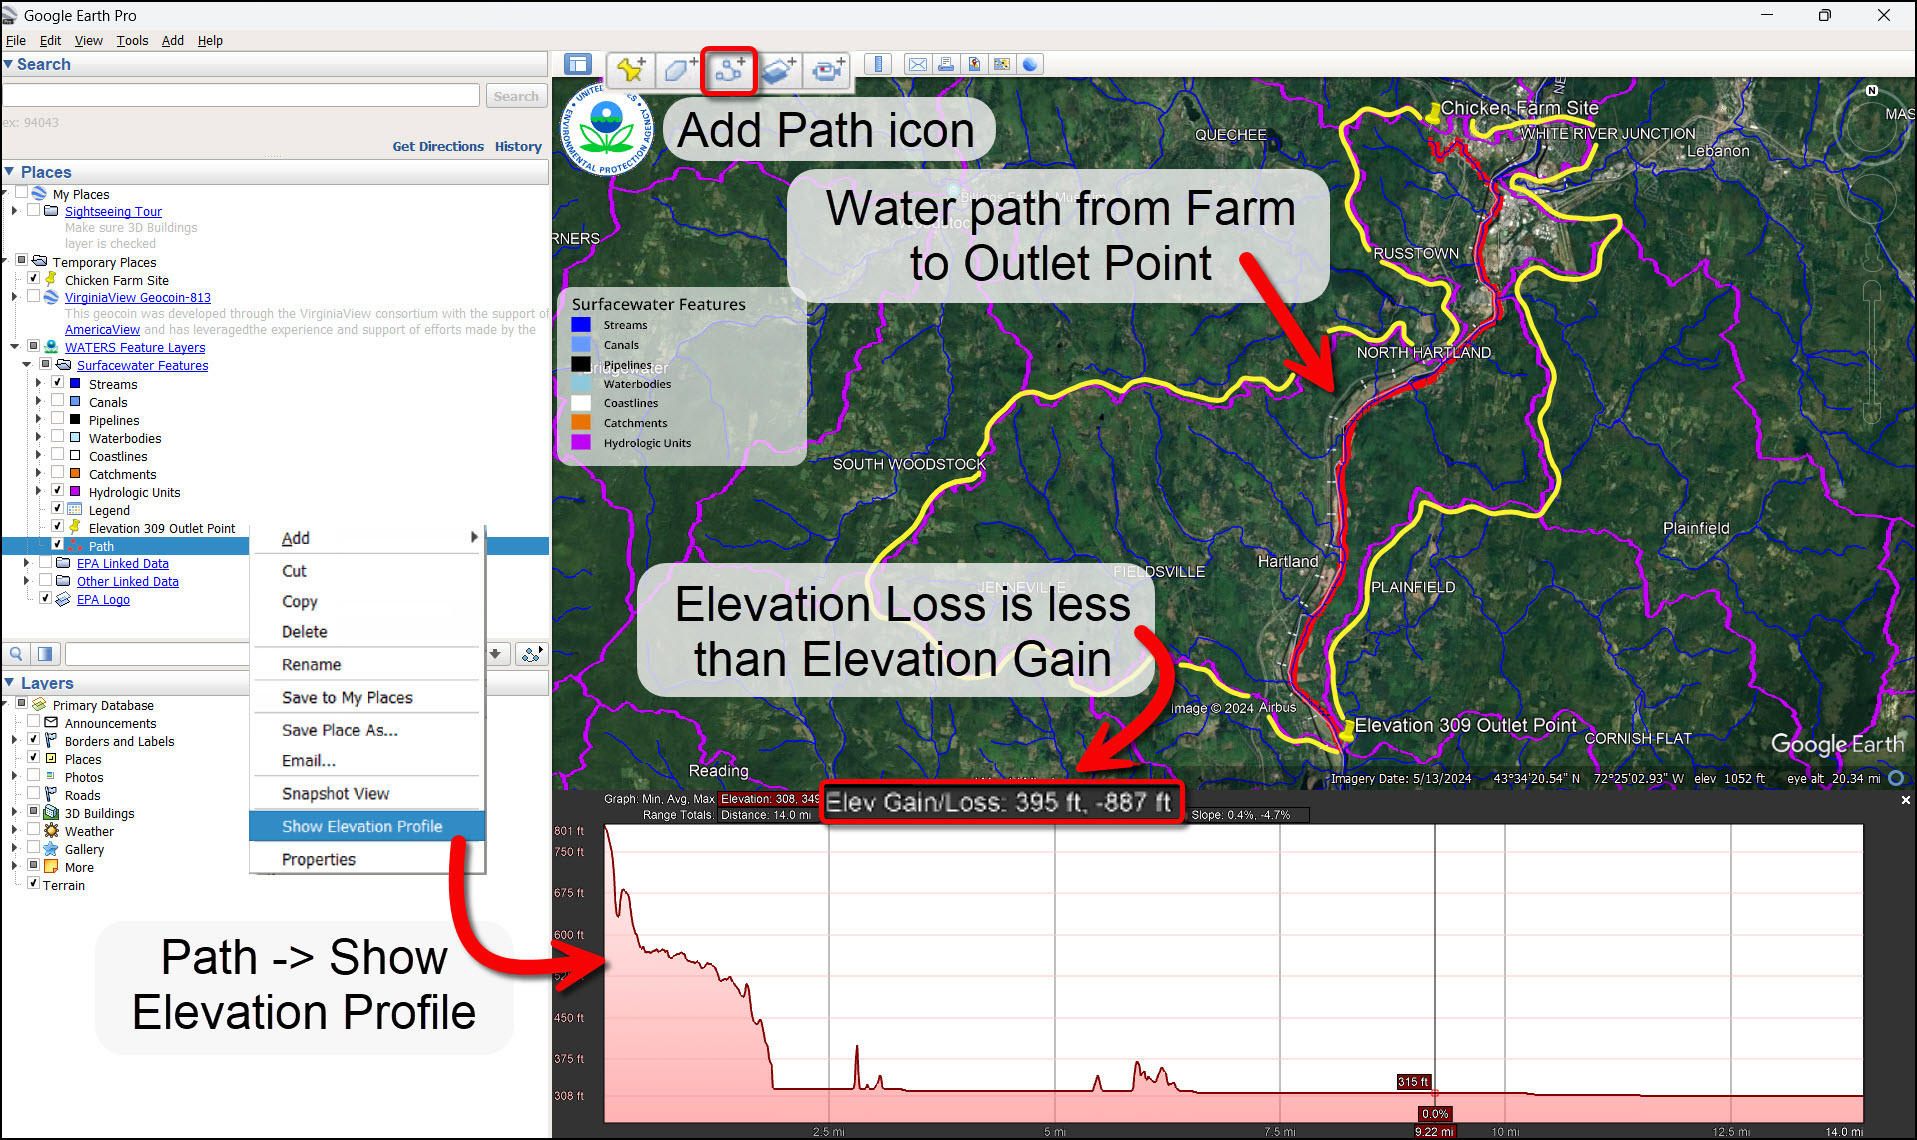
Figure 4.14: The Add Path icon is found in the toolbar ribbon. A path is drawn from the Chicken Farm site to the Outlet Point along the waterway which the natural flow of pollution would flow along. Right clicking the Path name and clicking ‘Show Elevation Profile’ will display the Elevation Gain/Loss of your path. If the overall Elevation Loss is less than the Elevation Gain, you traced the path correctly because water flows downhill.
- Note: You will likely need to stop as you go to reposition the map—to do this, click OK, reposition the map as you need to. Then right-click on your path name in the Places panel and go to Properties. This allows you to keep editing.
- Check Your Work: Right-click on your new Path name in the Places panel and select Show Elevation Profile. Remember—water always flows downhill, so if your path has an overall elevation loss, you are on the right track! Be sure to ask your leader/teacher for guidance with this one!
- After you’ve created your downhill path to the outlet point, explore the closest town within your path (if there is one). Record the town or city name in Appendix A and do an internet search to find the town’s population. Use the elevation profile of the path to find the distance (in miles) along the stream network from the farm site to the town.
- If there is no town within the downhill path you just created: First record the distance of the downhill path you created from the farm site to the outlet point. Then, look at the other Hydrologic Units that are connected to the one containing your farm site. Mark the outlet points (using Add Placemark) of each Hydrologic Unit until you find one that contains a town. Write down the name of this town and how many hydrologic units are linked from your farm site to the town.
Reflection Questions and Assessments
-
- Look at all the information you’ve recorded on the worksheet in Appendix A. Which of these two sites would be best for a chicken farm location from a watershed health point of view? Why? Do you think this decision would conflict with a business’ point of view?
- Use Google Earth to create a presentation map or video that shows your site. Add layers from the WATERS layers and create placemarks or other objects to help make your point. Print your map.
- What types of additional things might the chicken farmer do to lessen their impact on the health of the watershed?
Appendix A. Watershed Information for potential chicken farm sites